


As a product manager, I’m happy to be able to rely on data during my everyday work. I know I can work in a flow without being interrupted by the absence of a needed insight. I aim to develop data literacy across my team by providing them with needed dashboards and helpful data visualizations. This helps us to stay on track and spot trends and performance changes beforehand.
But it wasn’t like this all the time.
I used to work with large Google Spreadsheets that had over 10k rows and were extremely slow. I was building a lot of pivot tables to analyze data and it took me forever just to wait for a result.
I saved myself from this by learning SQL. I talked to my manager and was allowed to test Google BigQuery and get some help from a data engineer. This laid the foundation of our self-service product analytics.
How I used Metabase to set up self-service analytics for my product team
One of my current responsibilities is figuring out how reports should look like and how to build them. Working closely with a data engineer, we prepare all infrastructure to let our team make data-driven decisions.
We set up Metabase as our Business Intelligence tool on top of the Google BigQuery. Through API I set up our third-party data to be ingested on a daily basis. Some data still sits in Google Spreadsheets but it is also now connected to Google Big Query. I also used dbt to transform all the raw data for further analysis.
Here are the steps I followed:
-
Making sure data is ingesting daily.
- Some ad networks provide their data through API (e.g. Audience Networks Ads API, Google Ad Manager API). I used Google Cloud Function to schedule daily run to get data into the Google BigQuery.
- Some ad networks required us to download data from their backstage or emails. Instead of downloadinng CSV/XLS manually every day I used a python script to transfer the CSV/XLS format to the Google BigQuery.
- I added test as monitoring to check if the data was ingesting daily. If not, I would receive an alert to a Slack channel.
-
Prepare for the data transformation.
- All the raw data is stored as
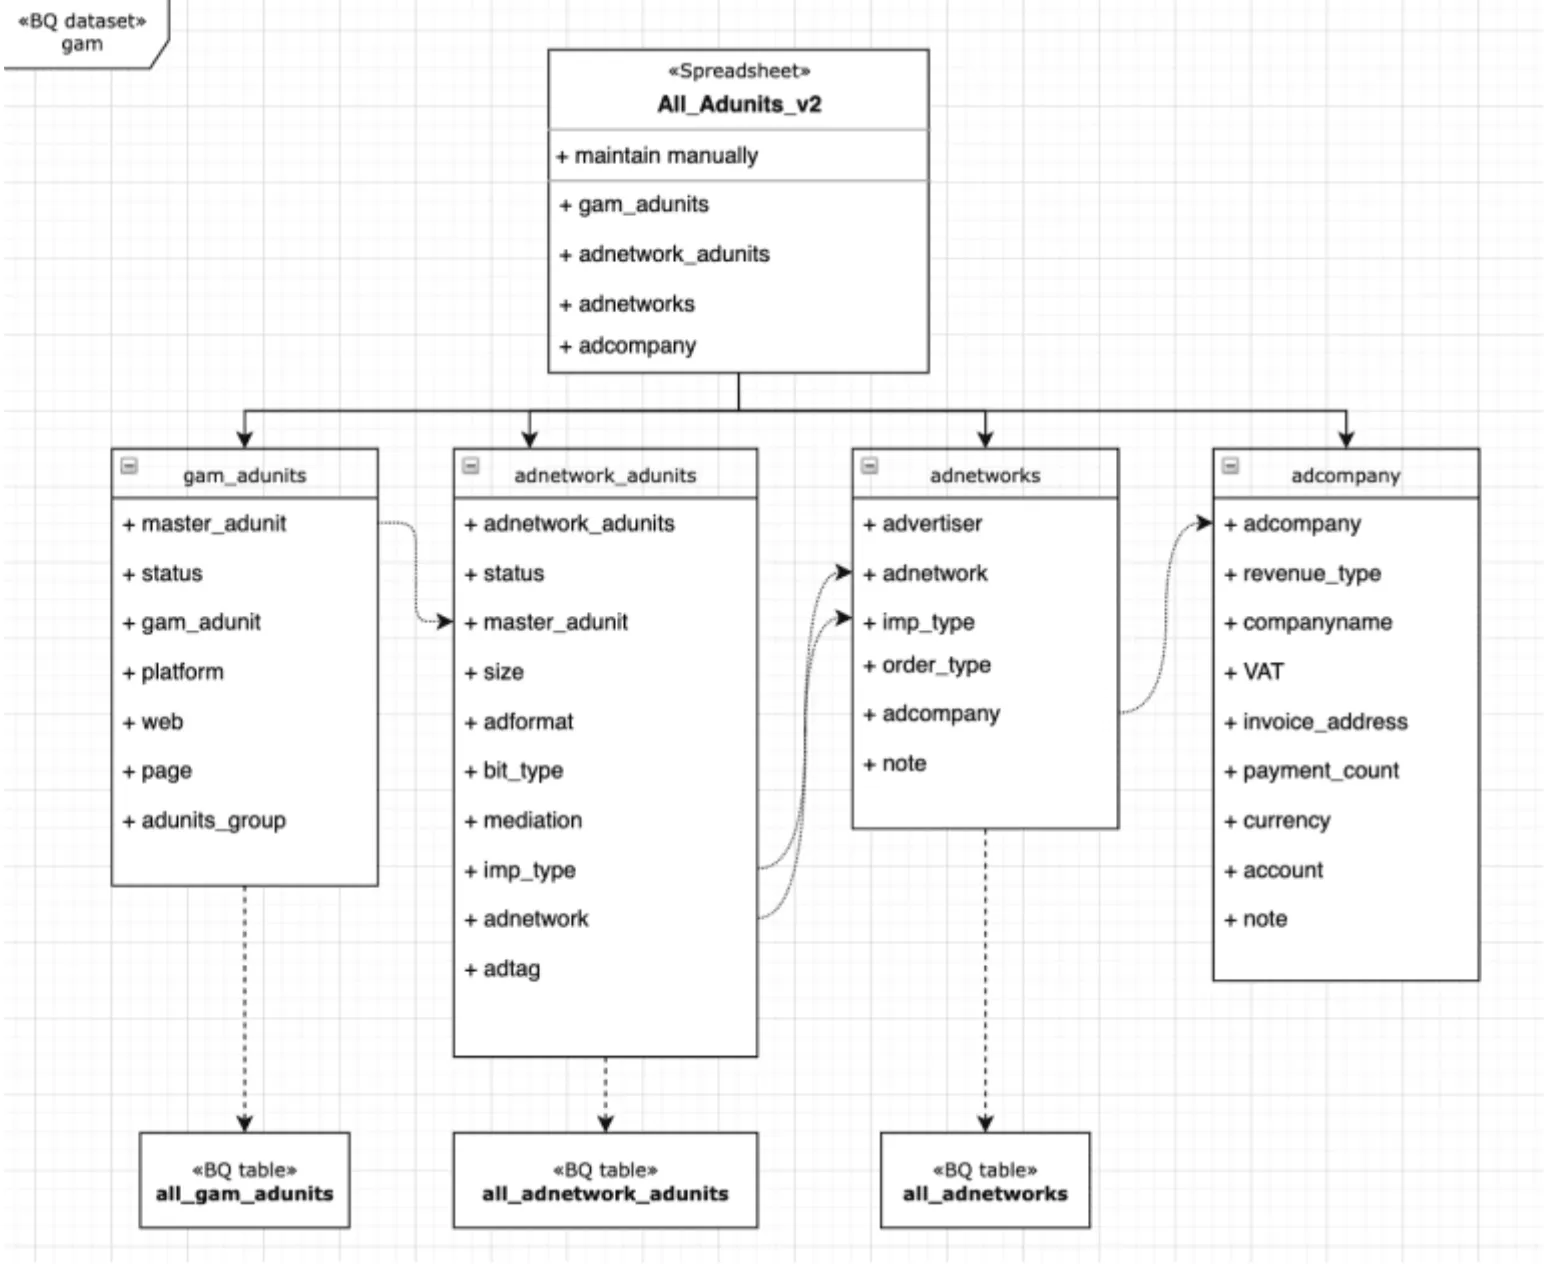
raw_XXtables in the Google BigQuery (see the scheme below). - Some tables are manually edited in Google spreadsheets connecting to Google BigQuery. These are business rules, e.g., the ad networks we worked with and the ad units we added. See
All_Adunits_v2below.
- All the raw data is stored as
-
Transfer raw data
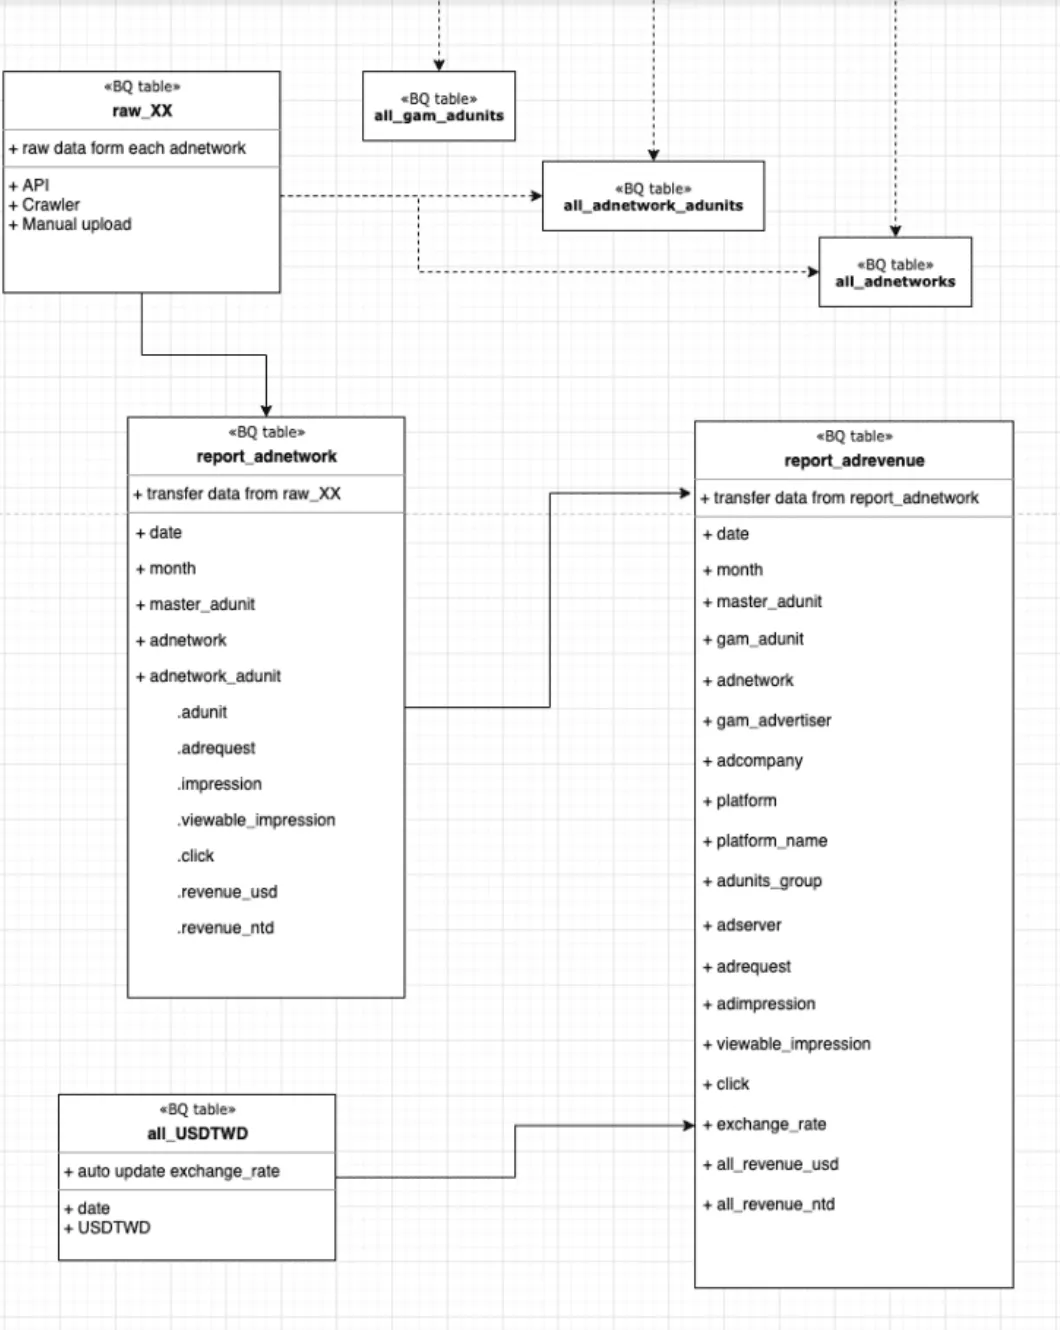
- My goal was to build
report_adnetworkandreport_adrevenue.report_adnetworkconsolidates all the raw data and business rules to easily view the impression of an ad unit from an ad network.report_adrevenueis an extension from ``report_adnetwork`, so I can easily compare the impression of an ad unit from all the ad networks.
- My goal was to build
-
Create dashboards based on the data transferred into the Google BigQuery.
Here is the structure: Raw data → Table by ad networks → Table by ad revenue
The final table showed revenue in the different periods. With this table, my team could analyze the data from different angles: by platform, by ad networks, by ad units, etc.
For many initiatives, I used Metabase and Google Data Studio to help me out. My team really likes to use the Metabase Dashboard Subscriptions feature which sends reports to our company’s Slack channel and brings the most important metrics in front of us. We also use Data Studio was for some of our self-serve dashboards.
Even though it took me a few months to learn and build the dashboards, it helped my team to better understand our performance.
As a product manager here is what I track with the help of dashboards
- Customer acquisition funnels for our premium plan: my team can see how many users signed up, tried premium features, and converted;
- On-going experiments: we run a/b tests and monitor their performance. I usually build the dashboard before the experiment is launched enabling a smooth tracking process;
- User journey: my team monitors how our users performed on the essential paths.
Dashboards helped my team to become more efficient
- Designers started to analyze which step may cause a friction for our users;
- Engineers began to run more experiments;
- Other departments adopted this mindset since it was reasonable for them to track how their initiatives were performing;
As the product manager, I benefit from this data-driven approach a lot. As any conversation arise, I can quickly pull all the needed information and make thoughtful decisions.
The best thing is that data usually talks for itself and unites the team. When we run experiments we all see how they perform and we do not spend time arguing about it anymore.