

‧
4 min read
How data-driven is your org?
The Metabase Team
‧ 4 min read

Share this article
To make the most of your Metabase, you first need to find out whether your team is actually getting the data they need.
Once you learn who’s looking at what, you can move some pieces around to make it easier for people to find the data they’re looking for.
The Metabase analytics collection
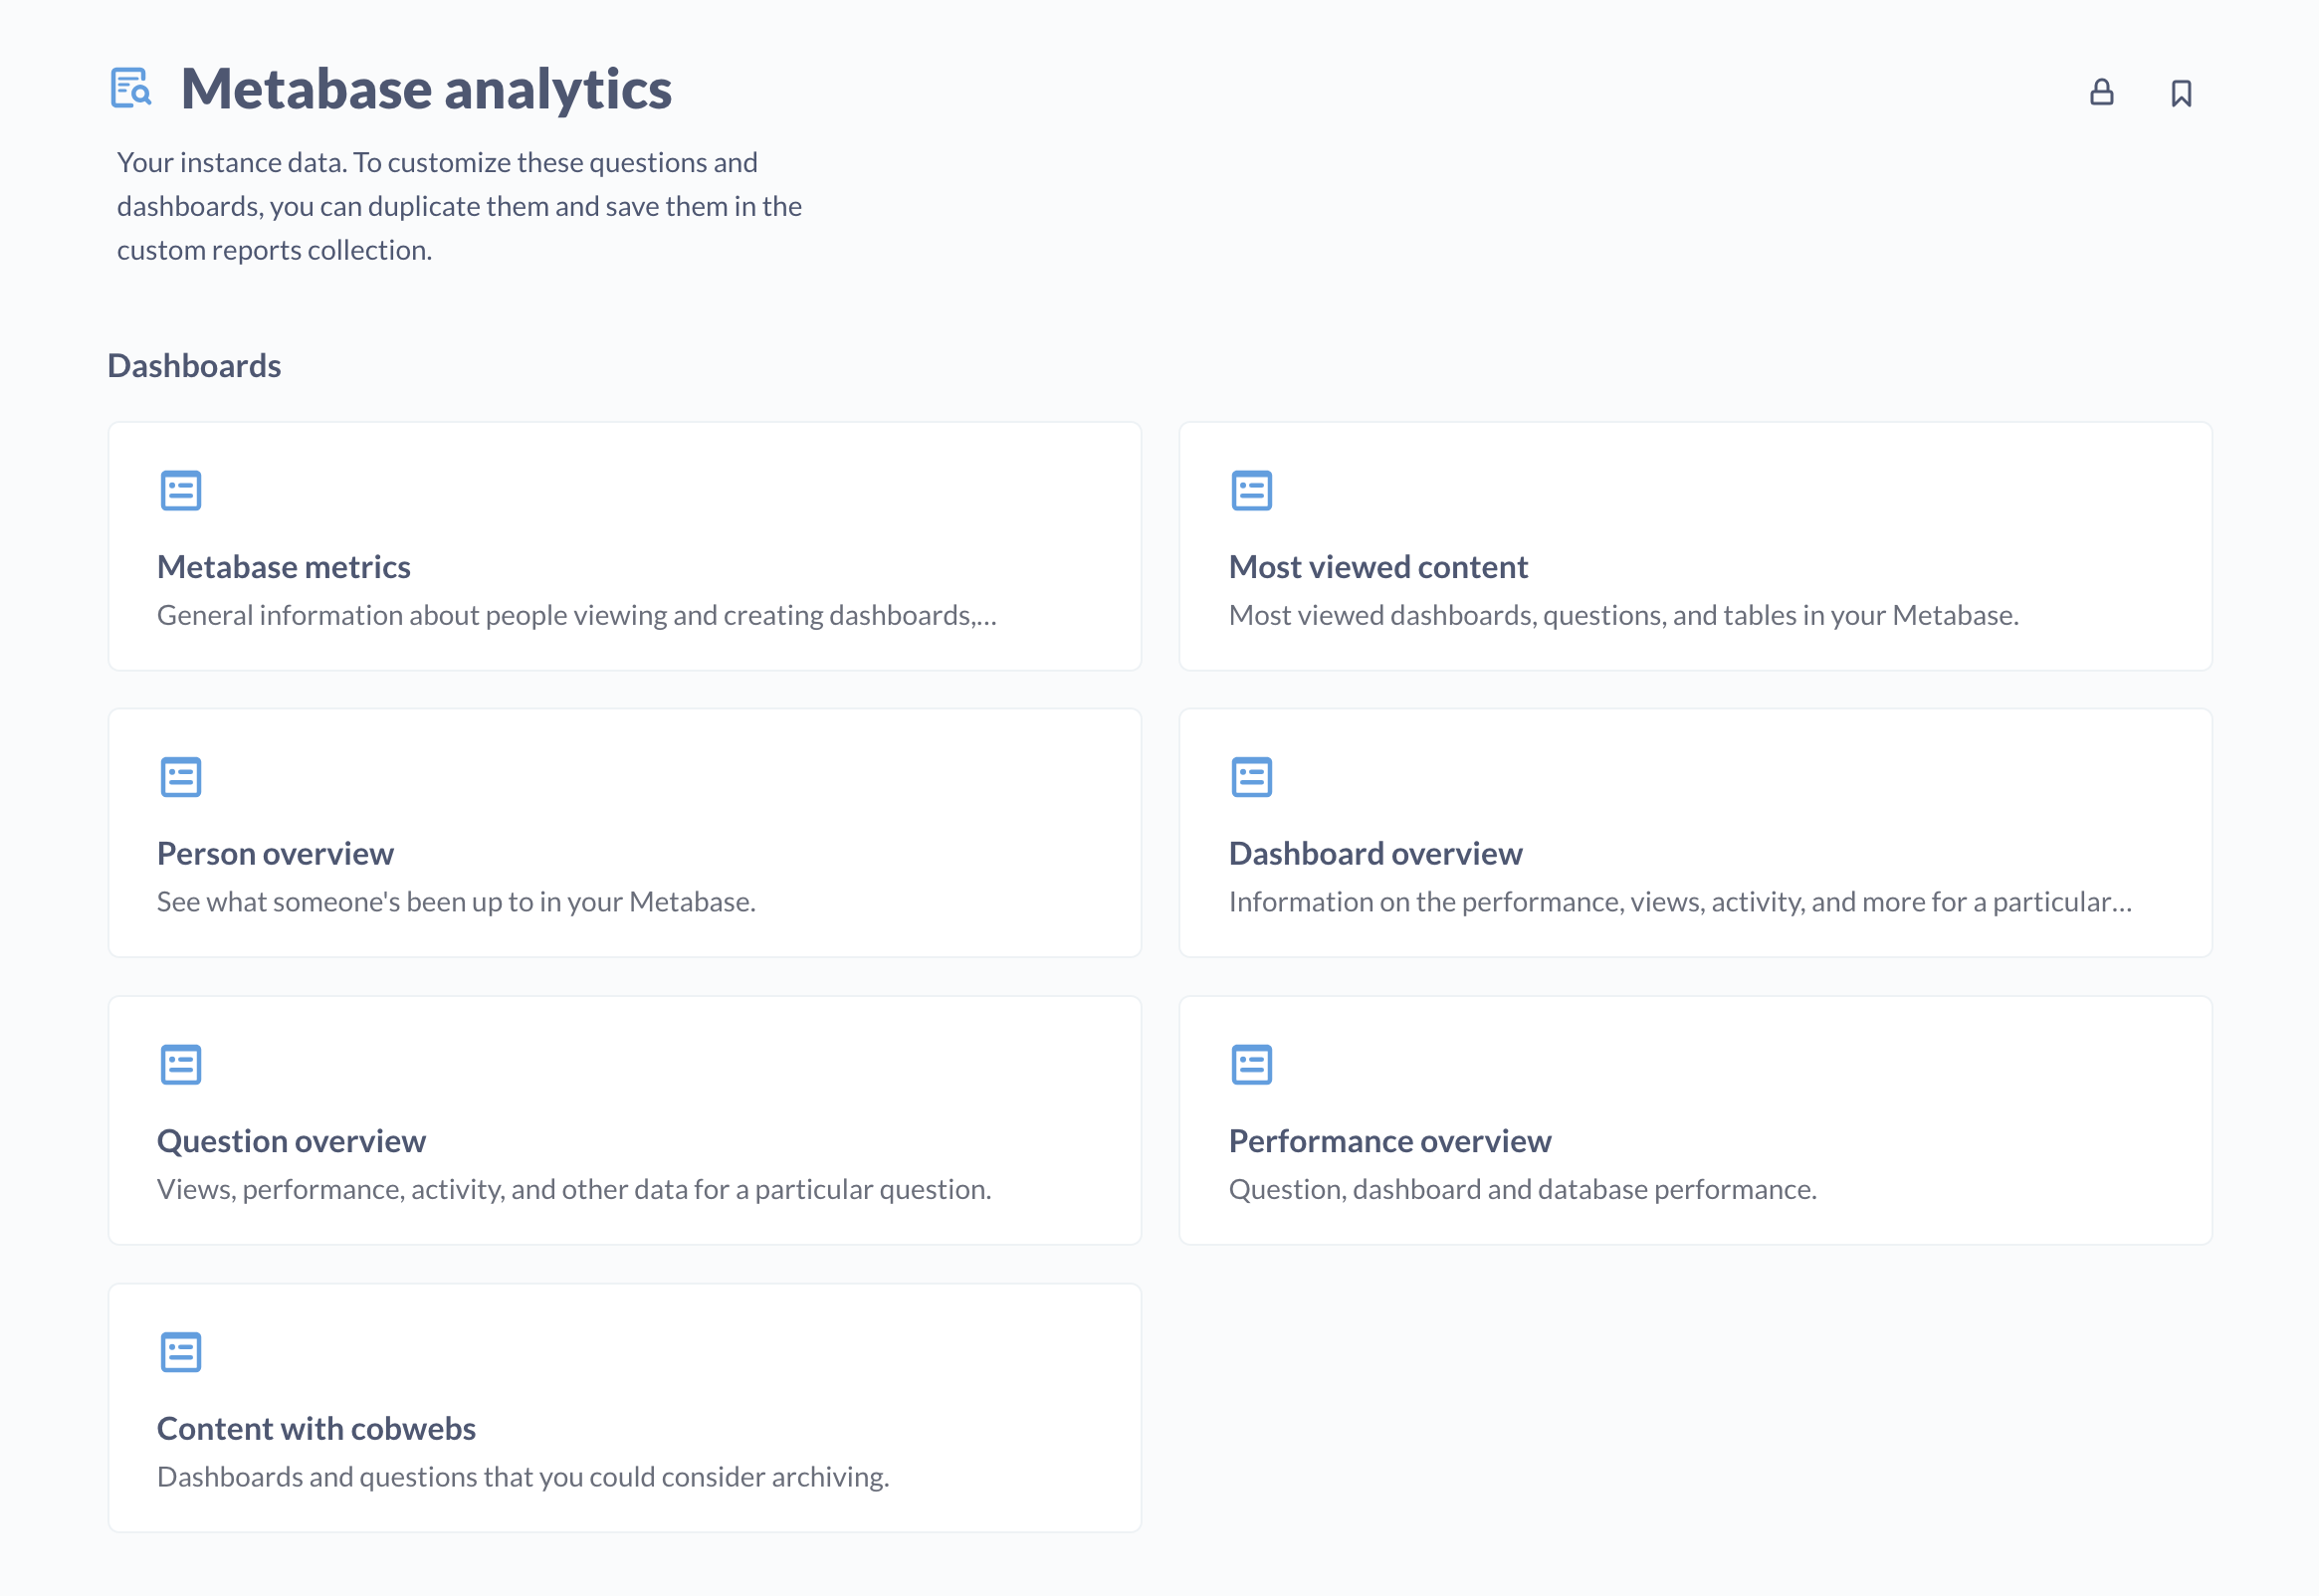
Starting with Metabase 48, the fancy versions of Metabase (Pro and Enterprise) ship with a special collection called Metabase analytics that brings together all of the usage data for your Metabase. The collection provides a set of models, questions, and dashboards that give you in-depth analytics on your Metabase—for both compliance and just general are-we-getting-value-out-of-Metabase info.
When designing the Metabase analytics collection, we tried to anticipate which questions people typically want to ask of their Metabase activity, and packaged up some dashboards to make those questions easy to answer. The collection also includes a set of models with logs of all queries, query execution times, user activity in Metabase, and more.
By default, the Metabase analytics collection is only visible to admins, though admins can grant view access to other groups. But even admins can’t edit the collection. The Metabase analytics collection is eternal. You can, however, duplicate any of the items, save then to the nested custom reports collection, and customize the reports to your needs.
Some things you can learn from the Metabase analytics collection
The Metabase analytics collection covers a lot of territory, but for eyeballing how engaged people are with your data, we’ll just focus on a few basic questions:
How many people are logging into your Metabase, and how often?
The “Metabase metrics” dashboard can show you weekly active users, and the number of question views per week. You can filter by user group to see which departments (or customers) are the most engaged.
Find out what people are looking at the most
The “Most viewed content” dashboard covers the most viewed dashboards, questions, tables, and models in your Metabase. You can filter by group, individual user account, and whether those accounts are active. You can see when stuff was created, by whom, when it was last updated, and who viewed it 100,000 times (Jerry, are you okay?). If you have a dashboard in an unofficial collection that’s getting a lot of eyeballs, maybe it’s time to give it a badge (that is, promote it to an official collection).
How often is your exec team clicking around Metabase, and what are they looking at?
If you want to look at a particular account, check out the “Person overview” dashboard. Maybe make sure your boss is looking at the right stuff, and that the data backing that stuff is, in fact, accurate.
How to encourage more people to at least look at the right data
You can make it easier for people to find the data they’re looking for—and be able to trust the data they find.
Here are some tips:
Put the most important stuff in a dashboard on the home page
You can set a dashboard as a custom home page. All of your most popular questions should live there. You can group them with heading cards (by team or by theme). You can also create sections that curate link cards to other dashboards people might like to (or should) know about.
Keep the most-viewed stuff accurate and up to date
Follow up with whomever created the most-viewed items, and make sure that data is accurate, up to date, and (ideally) cached to speed up load times.
Create collections per team
Mark these collections as official, and keep them up to date. You can nest unofficial collections to separate one-off explorations and works in progress from the vetted, diehard artifacts.
Set up dashboard subscriptions
For the most popular dashboards, or the dashboards that you want people to look at, you can set up dashboard subscriptions. You can even customize filters for different groups, so teams (or customers) get the data relevant to them.
Go nuts
There are probably a bunch of little instance optimizations you can make based on insights from your usage analytics. If you’re savvy with code, you could write a script against Metabase’s API to run heavy queries and cache them early in the morning before everyone gets in, dramatically speeding up dashboard loading time.
Check out our docs on Usage analytics.
You might also enjoy
All posts
 Aug 03, 2023 in Analytics & BI
Advice for building and scaling an effective and happy data team
If you don't understand data roles enough to scope job descriptions or workload, get ready for burnout, turnover, and the death of company-wide data culture. Our data team offers some advice on how to build a healthy data team.
The Metabase Team
‧
8 min read