Costs: the money going out
To get anything done, you’ll need to spend money.

And you’ll want to track and categorize these expenses so that you can sense-check some key metrics about your startup, mainly:
- Gross margin - your revenue left after you subtract the costs of goods sold (COGS).
- The percentage of revenue that you spend on:
- Sales and Marketing (S&M).
- Product and Engineering (P&E).
- General and administration G&A.
We’ll go through each of these buckets throughout this section. But we’ll zoom out for a second and look at two fundamental dimensions to thinking about cost:
- Does the cost scale with revenue?
- What type of thing are you paying for?
Does the cost scale with revenue?
Some costs scale with revenue. That is, the percentage of your revenue that you spend on these costs hovers around a fixed percentage, regardless of how much revenue you’re raking in.
Cost of Goods Sold (COGS)
COGS are costs that scale along with the number of customers you have. These costs include things like:
- Customer support and/or success engineering.
- Hosting and other infrastructure costs.
- Payment processing fees.
These costs are bundled together as the cost of goods sold, or COGS (pronounced ‘cogs’, not C-O-G-S). The term COGS is a throwback to companies who manufactured physical stuff and needed to account for the cost of materials.
Tracking COGS separately helps you forecast your cost as the percentage of your revenue. If you know that you’ll need to spend 20% of your revenue on COGS, you can assume you’ll continue to spend 20% going forward—even as revenue increases.
Gross margin
A related term to COGS is gross margin, which is the revenue left over after you’ve subtracted the COGS. So, concretely:
Gross Margin = ( Revenue (all of the money coming in) - cost of goods sold (COGS) ) / Revenue
For a SaaS company, a gross margin of ~80% of your total revenue is considered good.
Categorizing operating expenses
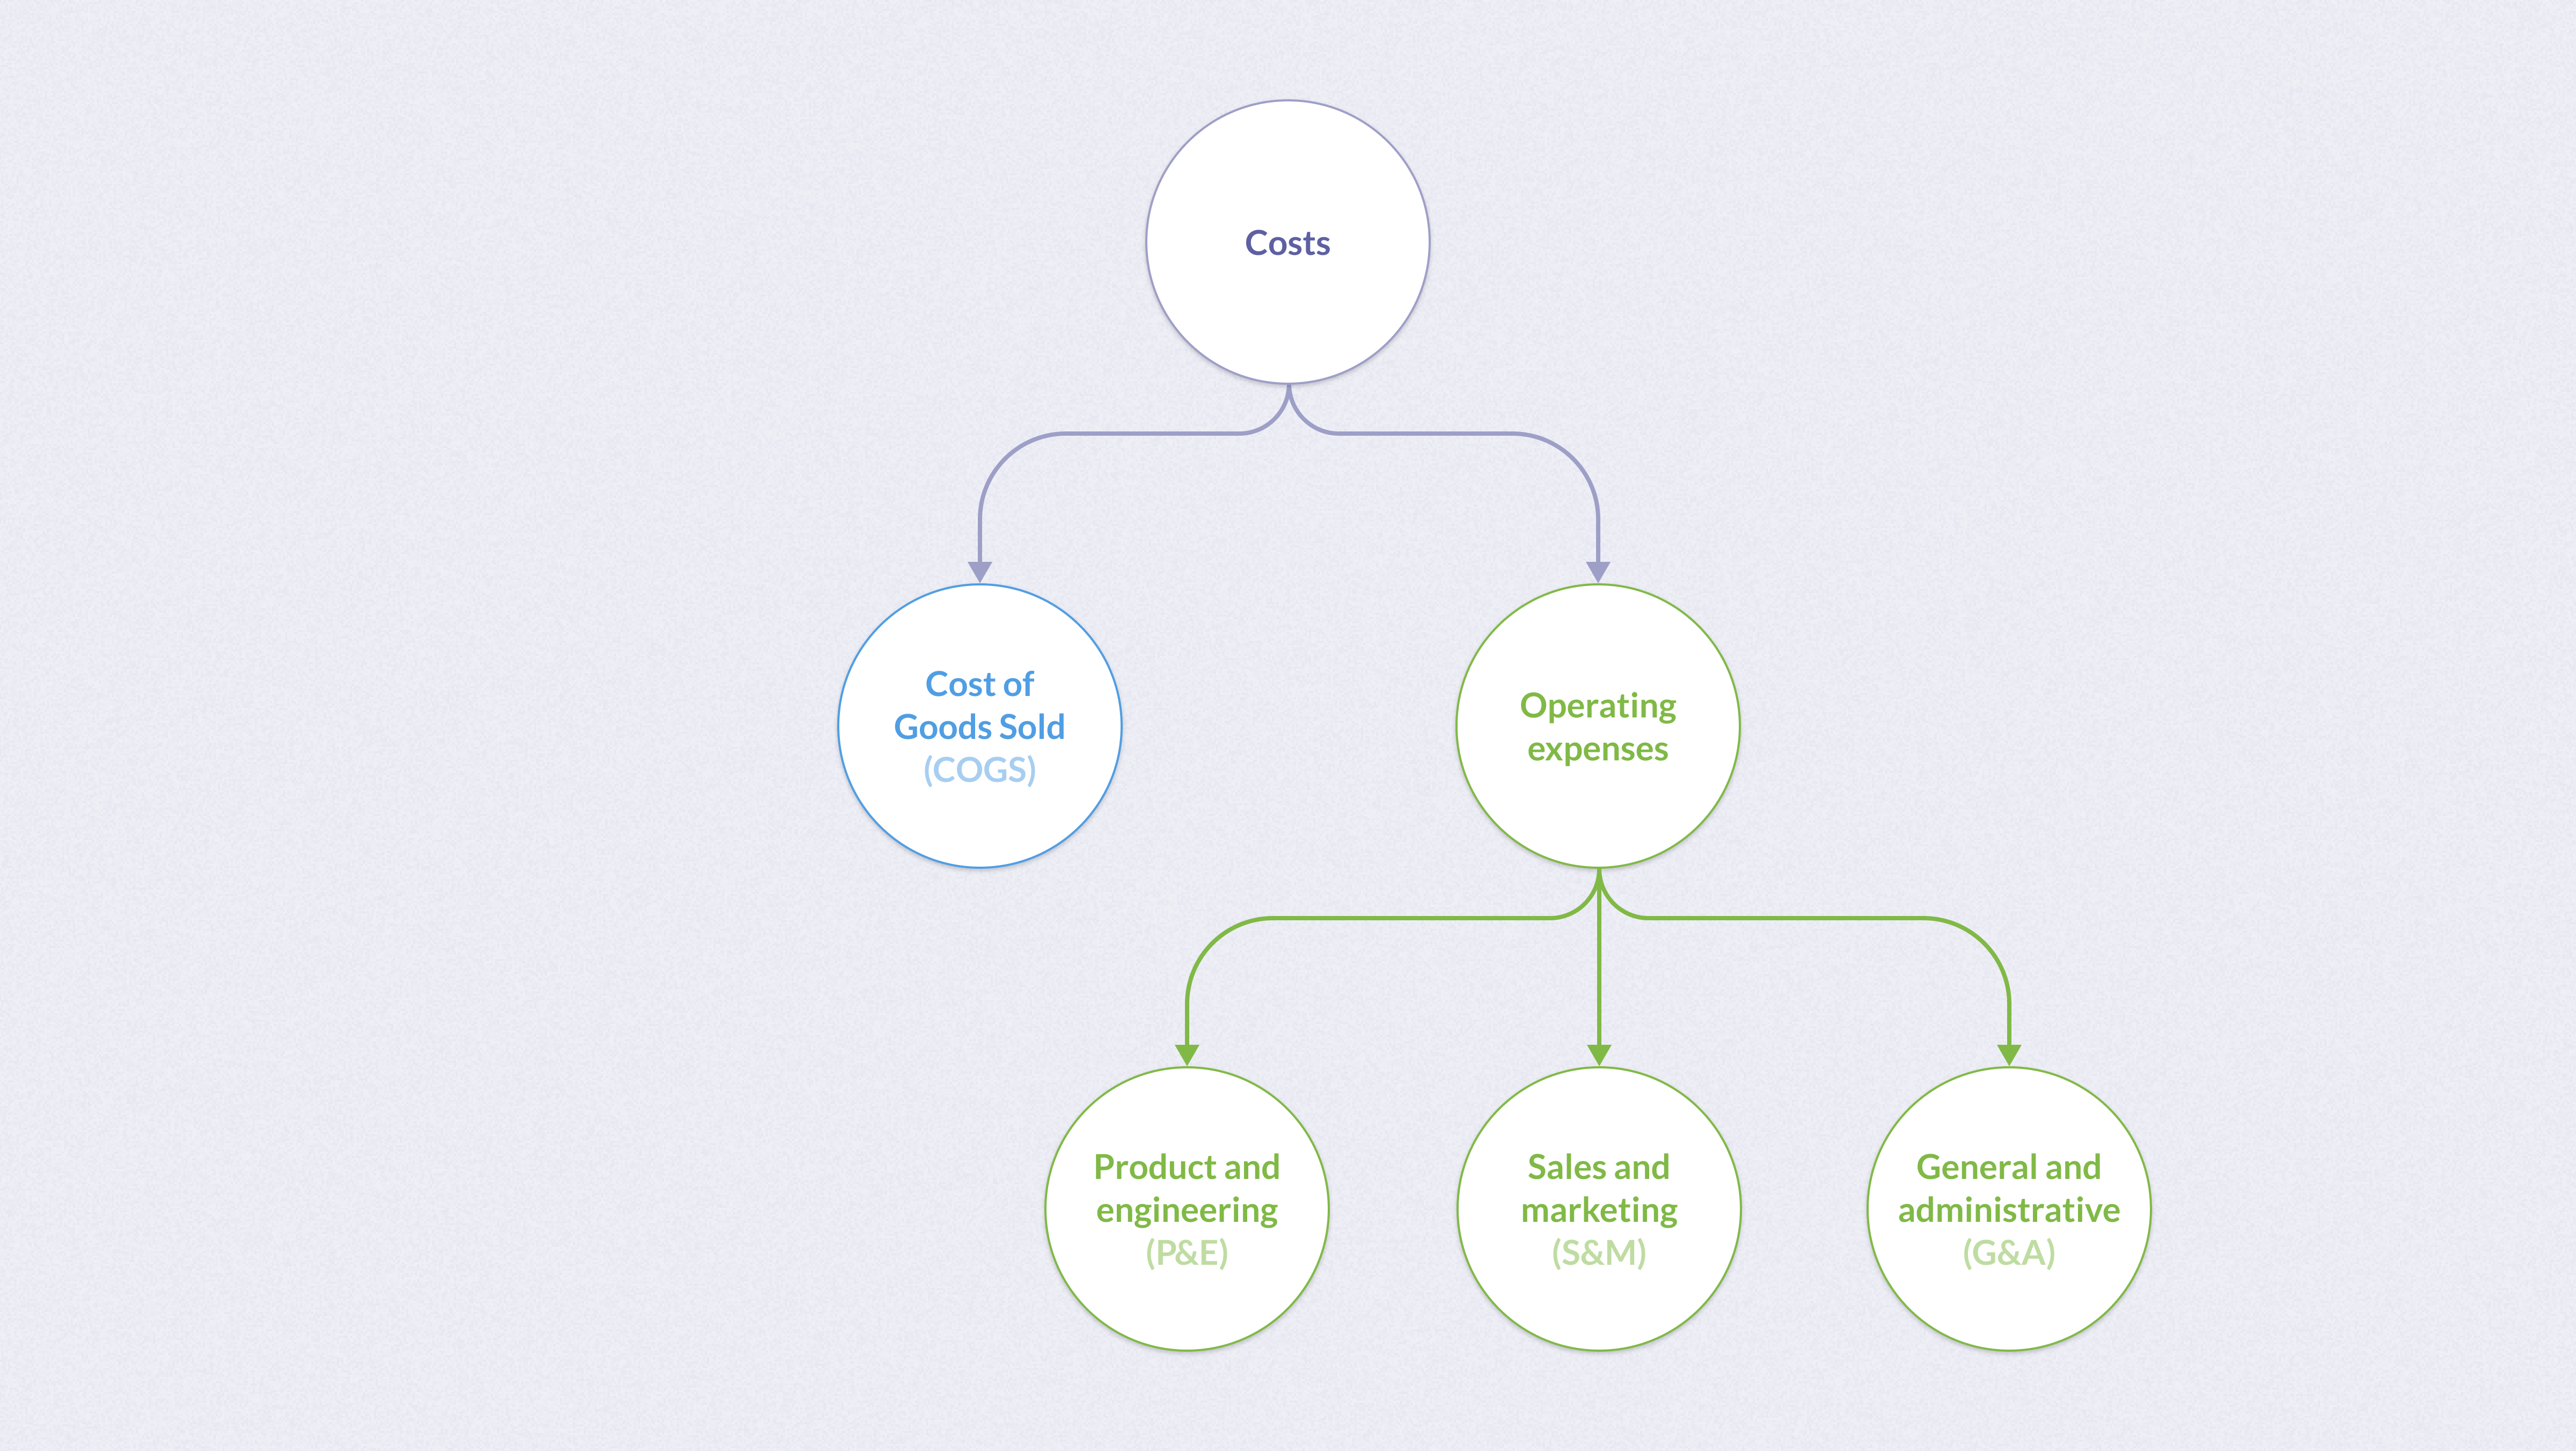
All other costs (that is, all costs that aren’t COGS) don’t necessarily scale with revenue. These costs are referred to as operating expenses.
For a SaaS company, operating expenses are usually grouped into three buckets:
- Product and engineering (P&E). The costs associated with maintaining your product, and investing money to improve it. Sometimes P&E is referred to as research and development, or R&D. Again, these terms are throwbacks to companies doing research in actual labs to come up with new products to sell.
- Sales and marketing (S&M). The money you spend to attract prospects (people who might be interested in your service) and to convert them to new customers (people who pay you money).
- General and administrative (G&A). Also known as “keeping the lights on.” G&A includes all costs that don’t fit into COGS, P&E, or S&M. Basically it’s everything that isn’t directly involved in the building or selling of your product. G&A includes costs related to the CEO, finance, human resources, and operations teams, as well as any rent or lease payments for office space.
These categories are not the only ways to classify your costs. You may want to subdivide further. For example, you could separate sales from marketing costs, or separate product and engineering costs. But the above three buckets are helpful to think about your operating expenses at these aggregated levels. You can also benchmark the percentages you spend in these areas against other startups to figure out if what you’re doing is sensible.
Operating profit
Anything left over from your revenue once you’ve subtracted all of your operating expenses is called your operating profit.
Other expenses
Okay, well, there are a few more expenses:
You usually deduct these after working out your operating profit. That way you can see how much money your core business makes before you account for interest payments and taxes.
Note that these expenses don’t fall into the General and Administrative bucket, because G&A only includes operating expenses.
Interest and financing costs
If you have any sort of debt, then you’ll pay interest on that debt. Depending on how you’re financing your company, interest payments may just be a small expense (e.g., some credit card interest). But if you’ve taken on large loans to finance your company, these payments might be a significant cost.
Taxes
Many investor-funded startups are not (yet) profitable. And since they’re not making money, they pay minimal income taxes. In this case, you generally can exclude taxes from your financial forecasting.
For profitable companies, however, income tax rates depend on your location and tax jurisdiction. Generally speaking, you would calculate and report your profit both before and after taxes. If you do have to account for tax expense in your financial forecasts, you would generally forecast your pretax profit as usual. Once you have that number, you can estimate your tax expense by multiplying your effective tax rate by your pretax profit.
Which costs go where?
To bucket your costs into either COGS, S&M, P&E or G&A, you generally look at the cost based on the type of thing you’re paying for, then decide which bucket to allocate that cost.
Payroll
A large share of software startups’ costs will go to paying people their salaries, which you’ll break down into COGS, S&M, P&E or G&A, depending on who works in which departments.
Payroll can get a bit lumpy, though. Raw salaries are predictable, but you may have to deal with commissions, bonuses, payroll taxes, benefits, payroll processing fees, and other costs associated with the people at your company.
One big tip here is to work with your accountant to make sure that they’re correctly assigning people to the appropriate category, rather than trying to calculate the numbers directly yourself. That way, when you get around to forecasting, you can pull in your salary costs directly from the financial reports from your accountant and see the breakdown by category.
Paid ads, conference sponsorship, and other things to get prospects’ attention
Paid marketing can be a big expense for SaaS companies who rely on paid marketing to acquire customers. These costs (predictably) go to the Sales and Marketing (S&M) bucket.
Software
Most SaaS companies will subscribe to other SaaS products to run their businesses (e.g., customer relationship management software (CRM) to track customers, or a marketing platform to send marketing emails, or analytics software to view your data (we’ve heard good things about Metabase, FWIW). Depending on how expensive the software is, you can decide whether to take the time to allocate software to who’s using it (P&E, COGs, or S&M) or simply consider all paid software as a General and Administrative (G&A) expense.
Consultants fees
Most startups will have some external consultants who they’ll need to pay, like accountants and lawyers. If these costs are small, you can lump them all under G&A. If the consultancy costs get larger, and you are spending money on specific areas, like hiring an external marketing agency, you may want to categorize the costs under S&M or P&E.
Laptops and physical equipment
In many traditional companies, paying for physical equipment can be a large expense. In accounting this is known as property plant and equipment or PPE.
Again, for a SaaS company, this expense should be small, and it can all be categorized as G&A. Startups will usually have minimal physical equipment (mostly laptops). Depending on the type of accounting you use, you may see this PPE come up as a depreciation expense. Accounting for depreciation is a method used to ‘spread out’ the costs of physical equipment over several years, given that they have a long lifespan.
Bringing this together and to calculate your profit
Once you’ve organized your costs, you can subtract them from your revenue to calculate your profit. You’ll usually organize your financial statements in a way that mirrors the financial statements you get from your accountant.
Revenue
| COGS | |
| Gross profit | = revenue - COGS |
| Gross margin, % | = gross profit / revenue |
| Sales & marketing expense | |
| Product & engineering expense | |
| General & administrative expense | |
| Operating expenses | = Sum (S&M, P&E, G&A expenses) |
| Operating income (EBIT)* | = Gross profit - operating income |
| Interest expense | |
| Income before taxes | = Operating income - interest expense |
| Income tax expense | |
| Net income | = Income before taxes - tax expense |
*Technically, operating income and earnings before interest and taxes (EBIT) are slightly different, but we’re using them interchangeably here.
Why have three different measures of profit?
In accounting financial statements you’ll often find several different measures of profit. For example, our accounting financial statement includes:
- operating income/EBIT
- income before taxes
- net income
For many venture-backed, early-stage startups, these three measures of profit will be similar. Because you’re not profitable, your income taxes are minimal. And you probably don’t (yet) have a lot of debt that would create a big interest expense.
So which is your actual profit?
Well, the profit metric you focus on depends on what you’re using the metric for. Many investors will look at operating income or EBIT, because it is a good measure of how profitable your ‘operation’ is (that is, how profitable your business is), especially when comparing different companies, as the measure excludes high tax or interest rates that would complicate the comparison.
That said, net income is the closest to the money that will actually end up in your pocket.
Are you spending enough on sales and marketing? Or too much?
The common way to work this out is to look at your customer acquisition cost and compare it with the revenue you get from a customer.
Customer acquisition cost (CAC)
CAC is the total cost of acquiring a single customer (it’s pronounced ‘cack’ rather than ‘C-A-C’). You calculate CAC by adding all of your Sales and Marketing (S&M) expenses in a month and dividing those expenses by the number of new customers you added:
Total S&M expenses in a given month / New customers in a month
Some companies will create their own definitions of what goes in the numerator. For example, if you have high onboarding costs for your customers, you might want to lump those onboarding costs in with the S&M expenses.
The ratio of LTV to CAC
The ratio of your customer lifetime value (LTV) to your customer acquisition cost (CAC) should be at least three to one.
One method of determining if you are spending too much on sales and marketing is looking at the ratio of customer lifetime value LTV to CAC. The LTV:CAC ratio give you a sense of how many dollars you get back in revenue for every dollar you spend on sales and marketing. Most blogs will recommend a ratio of at least 3:1. That is, you should get three dollars in revenue for every one dollar you spend acquiring a customer.
Low LTV:CAC ratios suggest that you’re spending too much on S&M. If you have an LTV:CAC of 1:1, then for every $ you spend acquiring a customer you only get $1 back in revenue. That means all of your revenue is paying for your S&M team, and there is nothing left to pay for your engineers and product managers, let alone your finance team, office rent, etc. Even at a ratio of 2:1, roughly 50% of your revenue will go on S&M expenses, which doesn’t leave much room for your other expenses and (eventually) a profit margin.
Higher LTV:CAC ratios are generally better, but at some level a high LTV:CAC ratio suggests that you could afford to spend more on S&M, which could accelerate your growth.
Calculating how long it takes to pay back your customer acquisition cost (CAC payback)
Another way to look at your CAC levels is to calculate how many months it takes for the revenue of a typical subscriber to repay the money you spent acquiring them. This is known as CAC payback. It’s calculated as follows:
CAC payback = S&M expense / New MRR
CAC payback is sometimes modified by multiplying the New MRR by gross margin.
Equivalently you can calculate this as:
CAC payback = Customer acquisition cost (CAC) / Average selling price (ASP)
How much should a company spend in each of these categories, relative to each other?
How much you spend on P&E, S&M, G&A, and COGS depends on the nature of your business. For example, Metabase doesn’t have a big sales team, and we don’t spend on paid ads, so our S&M spend as a percentage of our total costs is quite low. But we build a highly technical product, so our P&E spend is relatively high.
The percentages that you spend in each category can also vary as your company grows. For example, at the early stage of your company, you’ll tend to spend more on product and engineering as you build your product. As your company grows and your product matures, you may shift focus to attracting more customers, which will require spending more on sales and marketing.