‧
6 min read
Bootstrap your Analytics in 1 hour or Less
Tim Abraham
‧ 6 min read
Share this article
Data is well understood to be critical to any company’s success. Ironically, many startups tend to shy away from analytics — especially early on. I believe this partially stems from a myth that if you want to have analytics you should carve out around 25% of your engineering resources to fund it. To a founder with a vision, a 25% distraction from executing on that vision in exchange for ome visibility and insight is too expensive.
But setting up some basic analytics for your product isn’t nearly as difficult as you think! Certainly nowhere near 25% of engineering. While that may be true for mature companies with many large and complicated data pipelines, a small company can easily roll something up with minimal costs. To prove it, I’m going to show you how you can spend 1 hour setting up a system that should be adequate for the next 6 months of your company’s life.
First, let’s talk about what I mean by “having analytics”. I think the minimum requirements are
- Simple access to your key metrics for everyone in your company
- A nightly stats email or slack message going out to your team
- A few hosted dashboards to put up on monitors in the office
- A place where anyone in your company can explore data (regardless of technical acumen)
In other words, you need metrics and a way to spread them throughout your organization. Let’s begin with the metrics part:
Your Metrics are Already in your Database
Since pie is way more delicious than widgets, let’s imagine you’ve just started a pie delivery company. You decide that at a minimum, the success of your business will depend on
- Your ability to get potential pie consumers
- Your ability to sell pies to those consumers
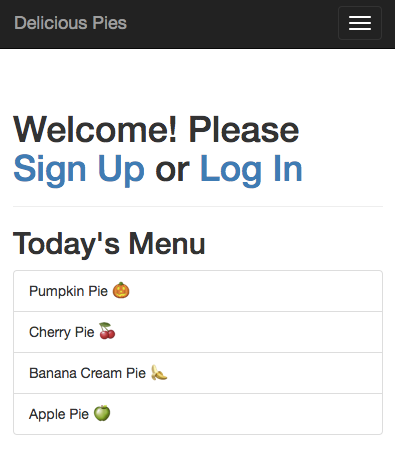
If you can reliably grow both 1 and 2 you won’t have too much else to worry about. You decide based on that to track
- New user registrations
- Pie sales
- Repeat usage
You know you can derive a few more interesting metrics just based off of user registration and pie sale data, but for now you’re cool with these big 3 high level metrics. Now how do you actually make these?
At this point a lot of people head to Google Analytics, Mixpanel, or some other 3rd party event analytics provider. While I love these products, and I love event analytics, I also think that this is part of the reason why early stage startups punt on analytics. To set these up the right way means engineering time spent on something orthogonal to developing your core product.
So before you make a case for the engineering team to spend a cycle instrumenting user signups and pie sales, consider this: these metrics are probably already in your application database. In other words, if you’re building a product to delivery pie to users and you don’t have a database table or collection to store your users or the pies they’ve ordered . . . well then a lack of analytics is not your biggest concern. Remember, a piece of software is basically made up of data and logic to operate on that data. Many don’t realize that data in your application can actually be used for analytics as well. So feel free to put your event analytics instrumentation in the backlog and let’s see how much we can get done with just your application database.
Now how do you get these metrics out?

Metabase: An analytics tool that works with your database
There are a lot of ways to fetch information from a database, but there is only one easiest way, and this post is about easy ways.
My favorite tool that I recommend for any company I advise is Metabase. Metabase is the fastest, easiest way to share data and analytics inside your company. It’s super simple to install or deploy, works with almost all databases, and best of all is open source and 100% free — so you should definitely test it out first before you go with some of the paid options out there.
Full disclosure: I work at expa, where Metabase was started, and I am an advisor to the company. I have also, in just the past year, advised 8 different technology startups on data and analytics and in each case have recommended Metabase for them. They all continue to use it.
Installation/Deployment
For a full guide on the deployment process, check out my video tutorial. Metabase’s documentation is pretty comprehensive, as well. If you’re a non-technical person, you may have to shoulder-tap an engineer, especially if your application database is in a VPC on AWS. On that note, it’s also a good idea to create a read replica of your application database and plug that into Metabase. That way you can ensure any heavy duty or hanging queries won’t affect your users.
Once you get Metabase deployed, sign up and add your database credentials. Next, invite your team members so they can get in on the fun.
Creating your metrics
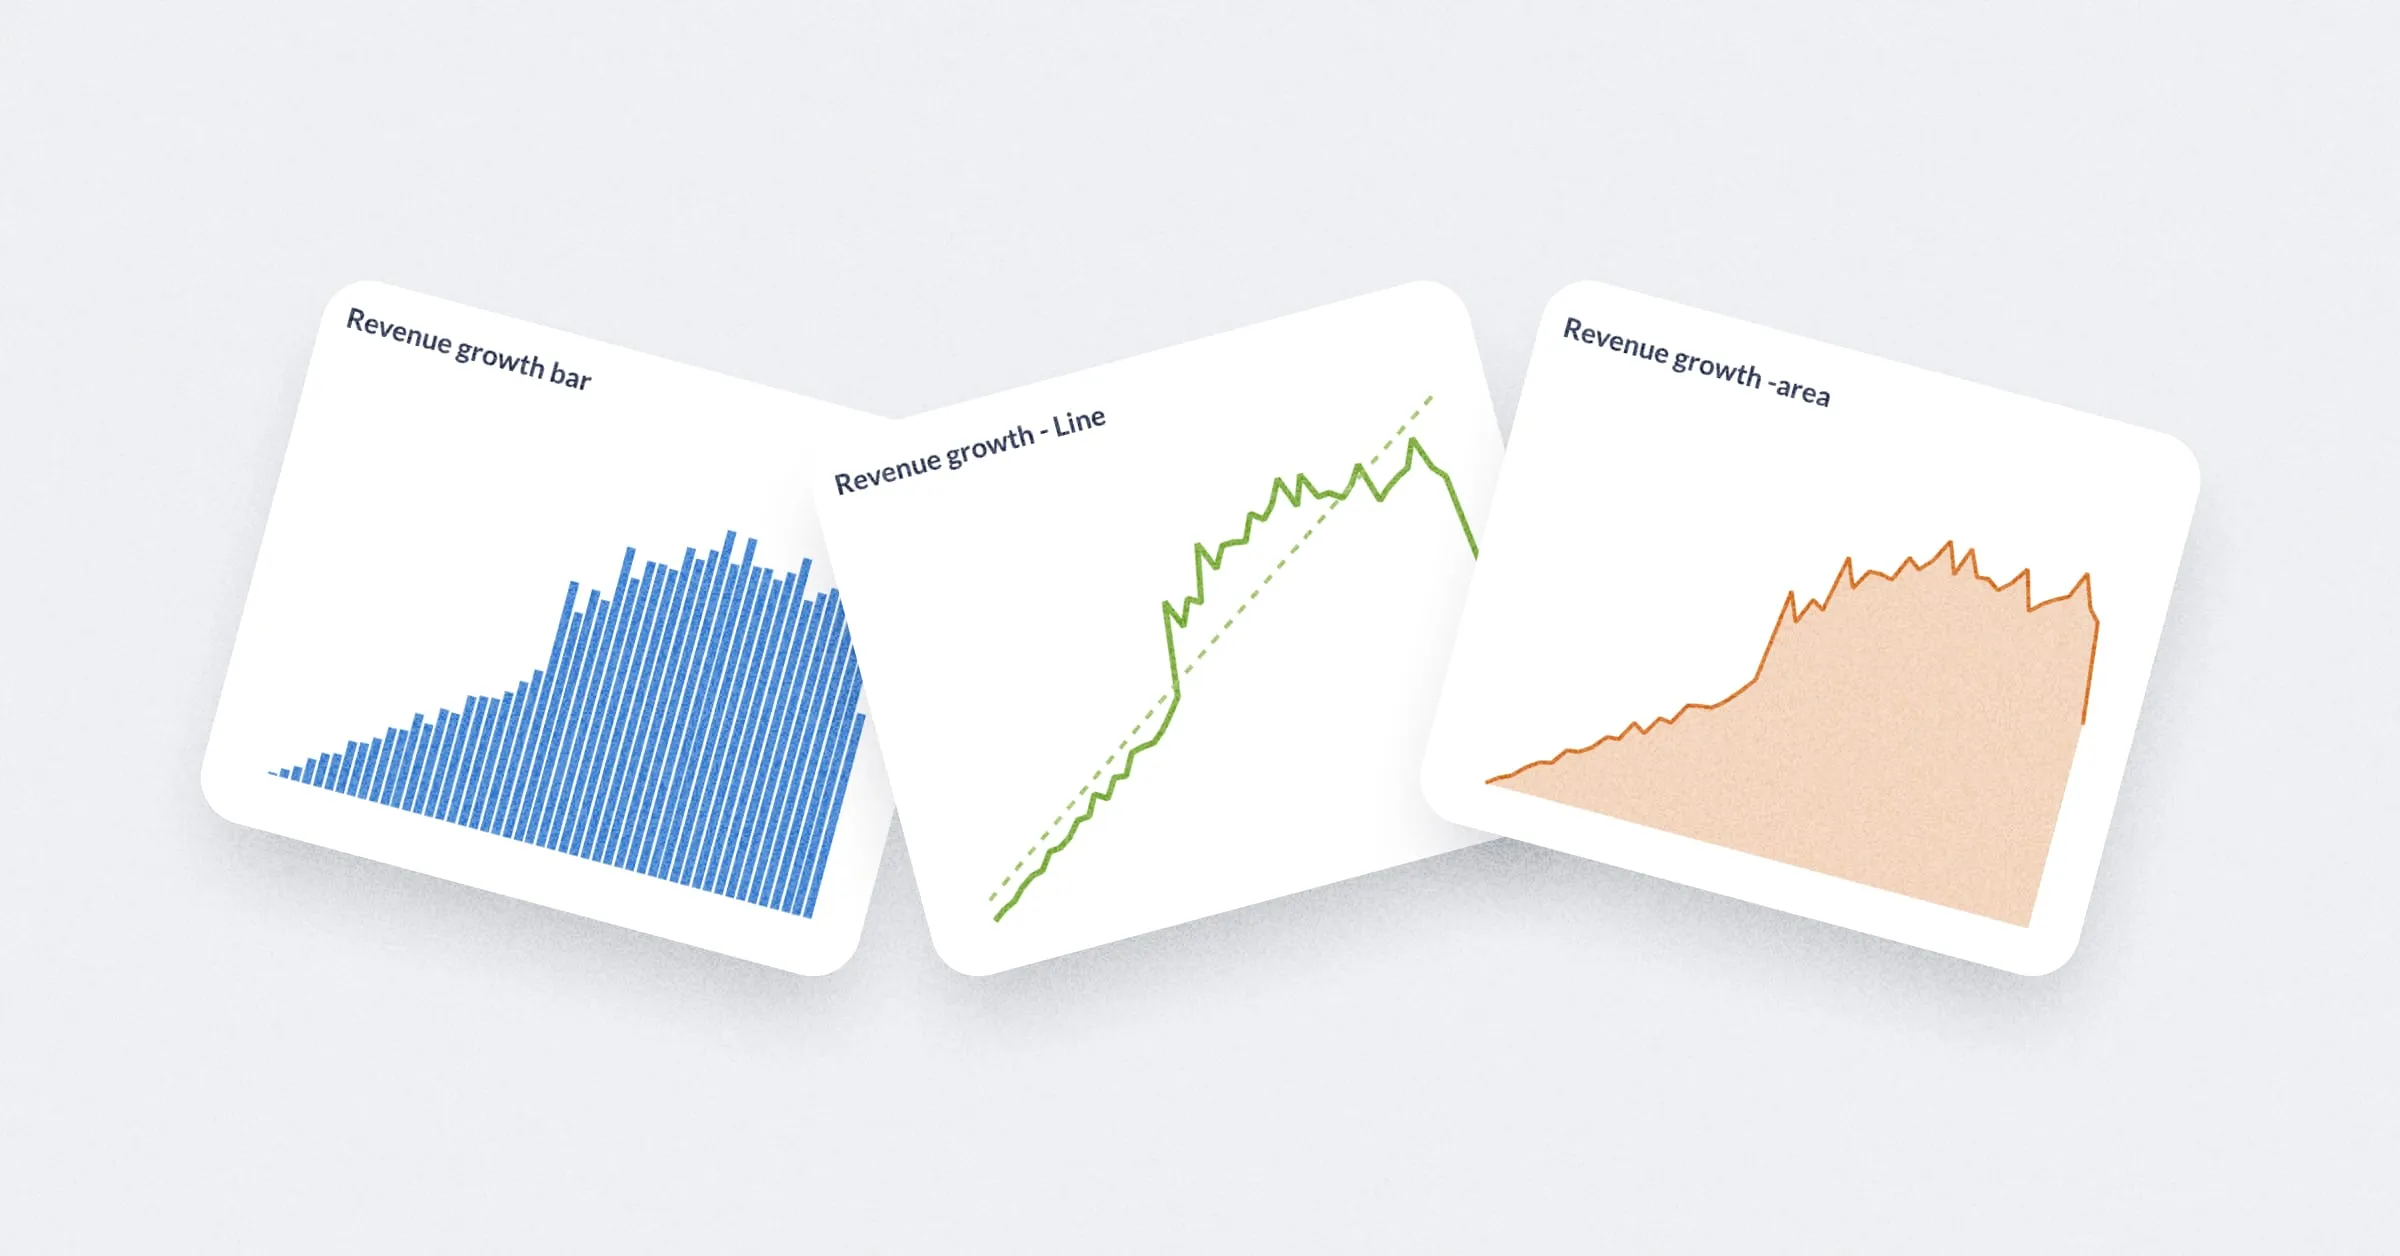
Believe it or not, the rest is pretty easy. The first thing you’ll want to do is build your metrics. In Metabase parlance, these are “Questions”. If you’re the pie business, and you have a reasonably organized schema, you should be able to get your key metrics with just a few clicks. No SQL is required, but of course if you like SQL that option is available.
So build your top metrics, and see if any other interesting ones pop into your mind. Although you can find hundreds of smart people who will tell you to never make a pie chart, I won’t hate on you for making a pie chart based on pie popularity. If metabase is the meta database, it’s only right to make your pie chart meta.
Finishing touches
Next you’ll want to setup a daily stats email. I don’t know what it is about them, but everyone loves daily stats emails. Metabase calls these “Pulses”, and even lets you use Slack if you’re too cool for email. Simply add the Questions you want to send out, pick a time and cadence (it doesn’t have to be daily but that tends to be the most helpful, IMO) and a list of recipients or slack channel and you’re done!
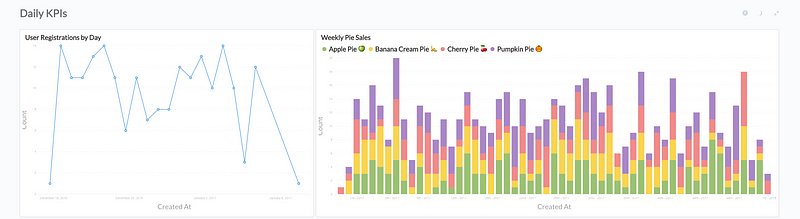
Lastly, everyone loves to see pretty dashboards up on the monitors in the office. Don’t keep them in suspense. Making a dashboard is also quite straightforward. Pick some Questions and organize them as best as your design sensibilities allow you. Load it up on an external monitor you’ve got up in the office, full-screen it, and you’re done!
Recap
You just set up a pretty solid analytics infrastructure for your startup in about an hour. Now your whole team can explore your application database, receive nightly emails, and view a company-wide dashboard. Even better, This setup should last you for quite some time — at least 6 months unless you start experiencing crazy growth (in which case, no complaining).
Ready to try it out? Skeptical of the 1 hour guarantee? Check out my YouTube tutorials, part 1 and part 2, where I walk you through everything you need to know.