Bring together charts and questions on live dashboards with interactive tools to let everyone get the info they need.
Get startedMake it easy and intuitive to learn more from data with a few clicks.
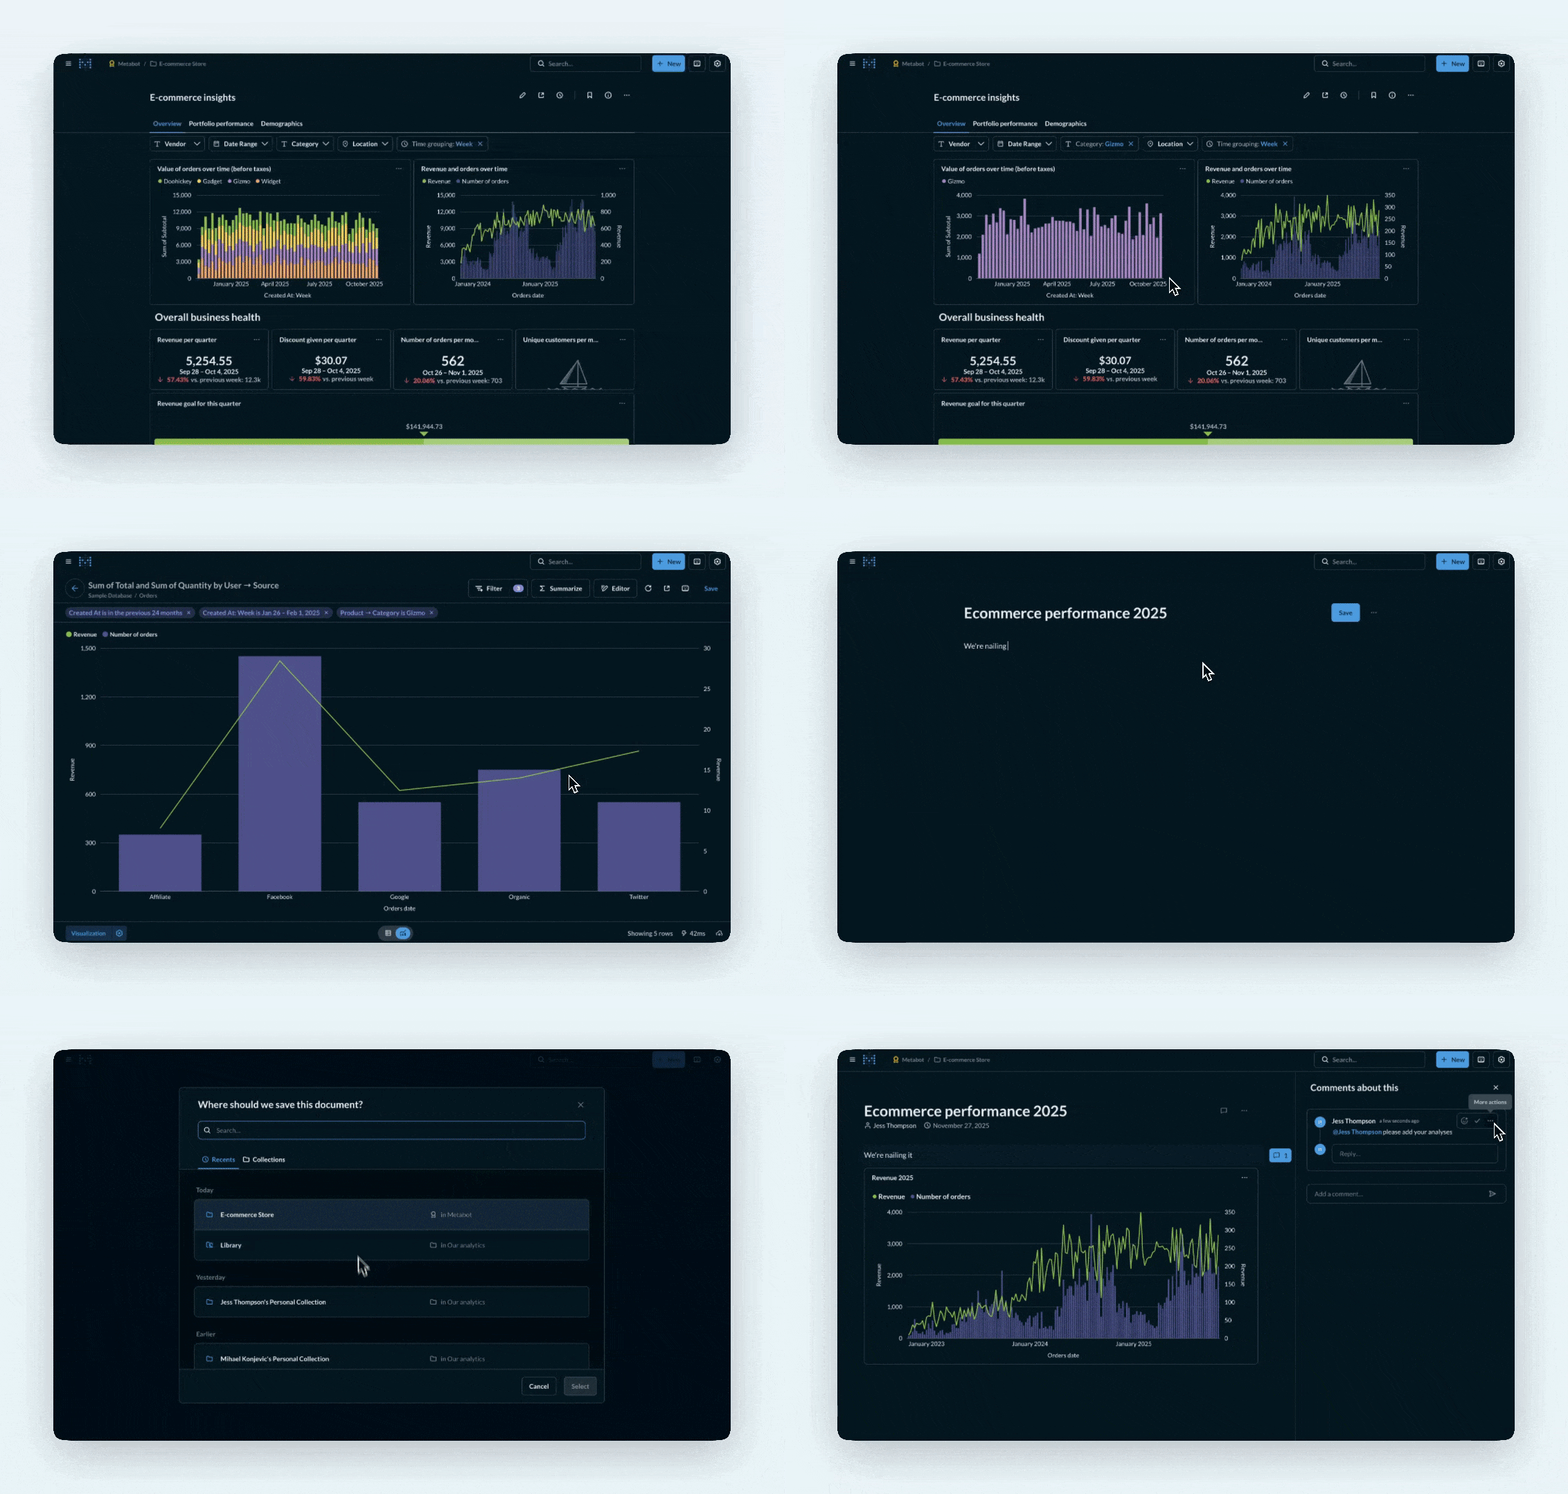
Add filter widgets to quickly tweak results on things like date ranges, categories, locations, and more.
Zoom in on selected areas of a chart; breakout on categories; and apply X-rays for auto-magic reports.
Show the drill-through menu, update filters, or send them to another dashboard, saved question, or URL.
Link to or embed dashboards. Set up email and Slack subscriptions, or alerts for when something changes. Or export dashboards to PDF for quick and easy reporting.
Cache answers to questions to keep load times low. You can even get specific about which questions, dashboards, and databases to cache on Metabase Pro and Enterprise.
Write back to your database from your dashboards with Actions buttons for basic CRUD actions, like logging a new request, or editing a customer profile.
Create a new question or visualization in Metabase using the query builder, or click into an existing question.
From the menu at the top-right, select Add to dashboard.
Select an existing dashboard to add your question to, or click Create a new dashboard.
You’ll now see your question added to your dashboard. You can save it as is (even a one-question-dashboard counts as a dashboard), or add more questions, filters, headings, text or links.
These steps can also be done in reverse, by clicking New > Dashboard and adding saved questions or creating new ones.
Analytics dashboards are ready to create and share straight out of the box on all plans.
Get started