‧
13 min read
What is embedded analytics?
Alex Yarosh
‧ 13 min read
Share this article
In plain terms, embedded analytics means you’re showing charts, metrics, or reports inside your product, rather than sending people off to a separate tool. It’s not new, but it’s becoming a must-have in SaaS and business apps. People expect their data to be there when they need it—ideally without asking anyone on your team for a custom report.
In this guide:
- A clearer look at what embedded analytics actually includes
- Why it matters (for both your users and your business)
- Common use cases
- How to build or buy your way into it
- What to look out for along the way
TL;DR: Embedded Analytics overview.
| Topic | Summary |
|---|---|
| What is embedded analytics? | Embedded analytics means integrating data visualizations, charts, and reports directly inside your product so users can analyze and act on data without leaving the app. It provides real-time, interactive analytics tightly coupled with the SaaS platform user experience. |
| Key features | Ranges from static dashboards with filters to fully interactive tools allowing users to drill down, build custom analyses, or ask data questions on demand. White-labeling ensures seamless integration with the app’s look and feel. |
| Embedded analytics benefits for users and business | Enables users to self-serve analytics for faster, better decisions right inside workflows—no need to wait for data teams. For businesses, it boosts customer engagement, reduces churn, differentiates products, creates new revenue streams, and streamlines dashboard management for scalability. |
| Use cases | Useful in SaaS where users need frequent data-driven decisions, e.g., healthcare patient outcomes, ecommerce sales and retention, fintech portfolio analysis, marketing campaign performance. Key themes: reduce ad hoc report requests, shorten time-to-value, feature adoption, customization at scale. |
| Differences from traditional BI | Embedded analytics delivers answers inside the product in real time, enabling users to self-serve without dependency on separate BI tools, which require data team involvement and slow down decision-making. |
| Choosing a solution | Evaluate time to value, integration mode, scalability, security features (row-level permissions, scoped filters), and pricing model (per user, query, or dashboard). Ideally, enable non-engineering teams to manage analytics content. |
| Summary | Embedded analytics is now a must-have in SaaS, providing users smart, in-app access to data and empowering both users and businesses. Proper planning around security, data governance, and scaling ensures a successful embedded analytics experience that drives retention, revenue, and engagement. |
Let’s get into it.
What is embedded analytics?
Say you’ve built a SaaS platform for managing marketing campaigns. Your customers are scheduling emails, tracking engagement, and managing segments. At some point, they will ask: are my campaigns working? They’ll want to see the data about the open rates, click-throughs, engagement trends, and make decisions based on that data.
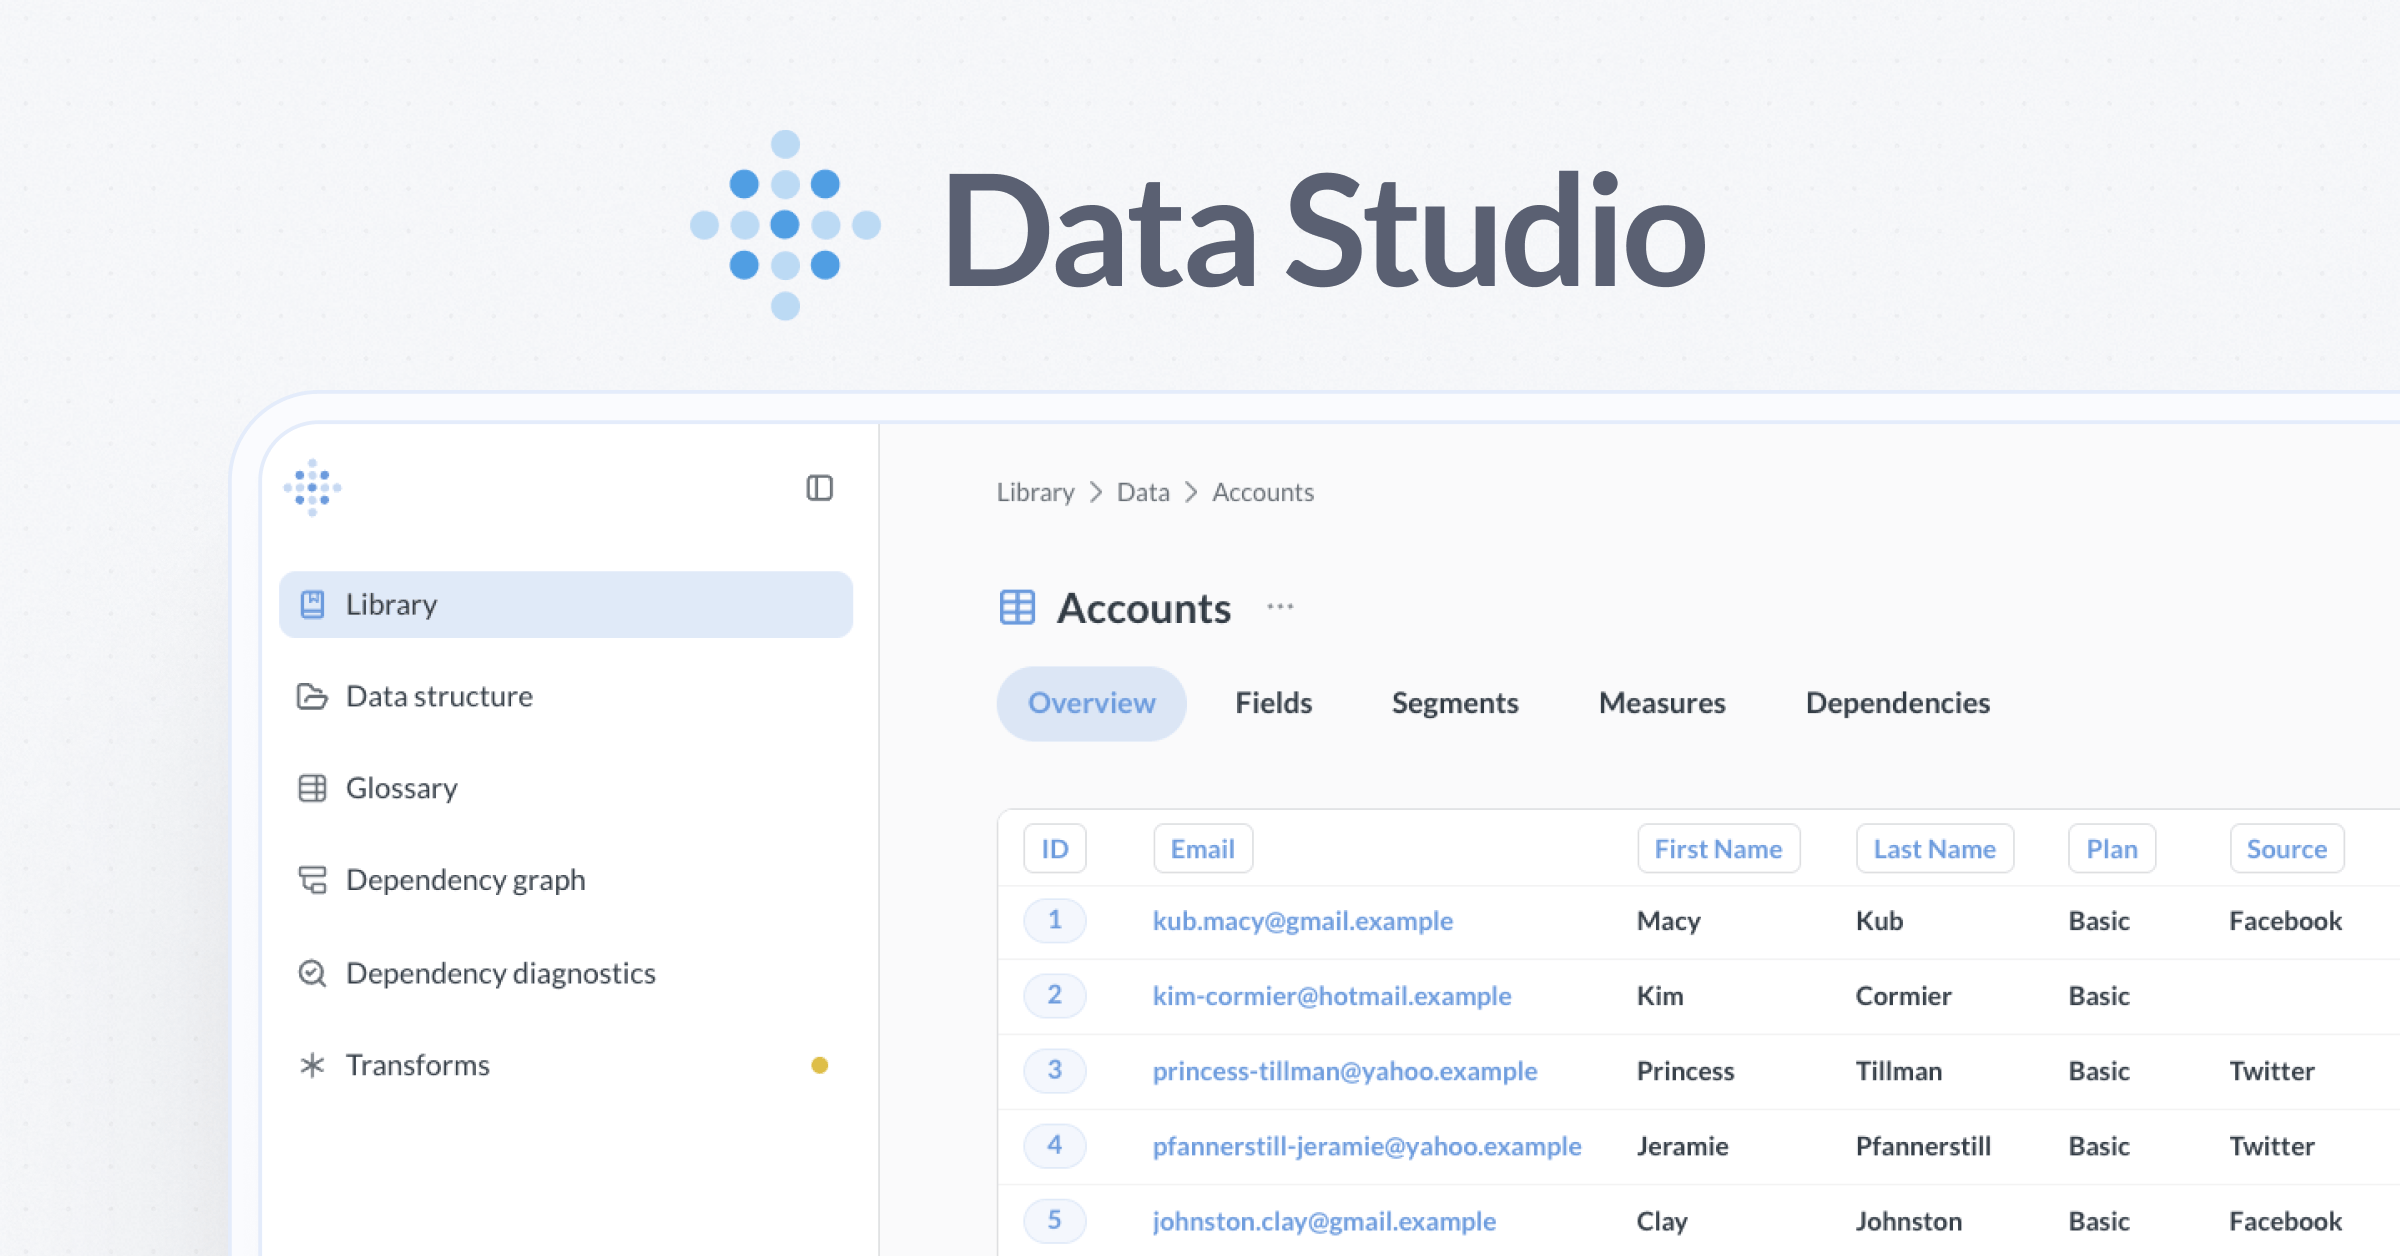
Embedded analytics means giving your customers their data - and the tools to explore it - directly inside your product.
Key features of embedded analytics
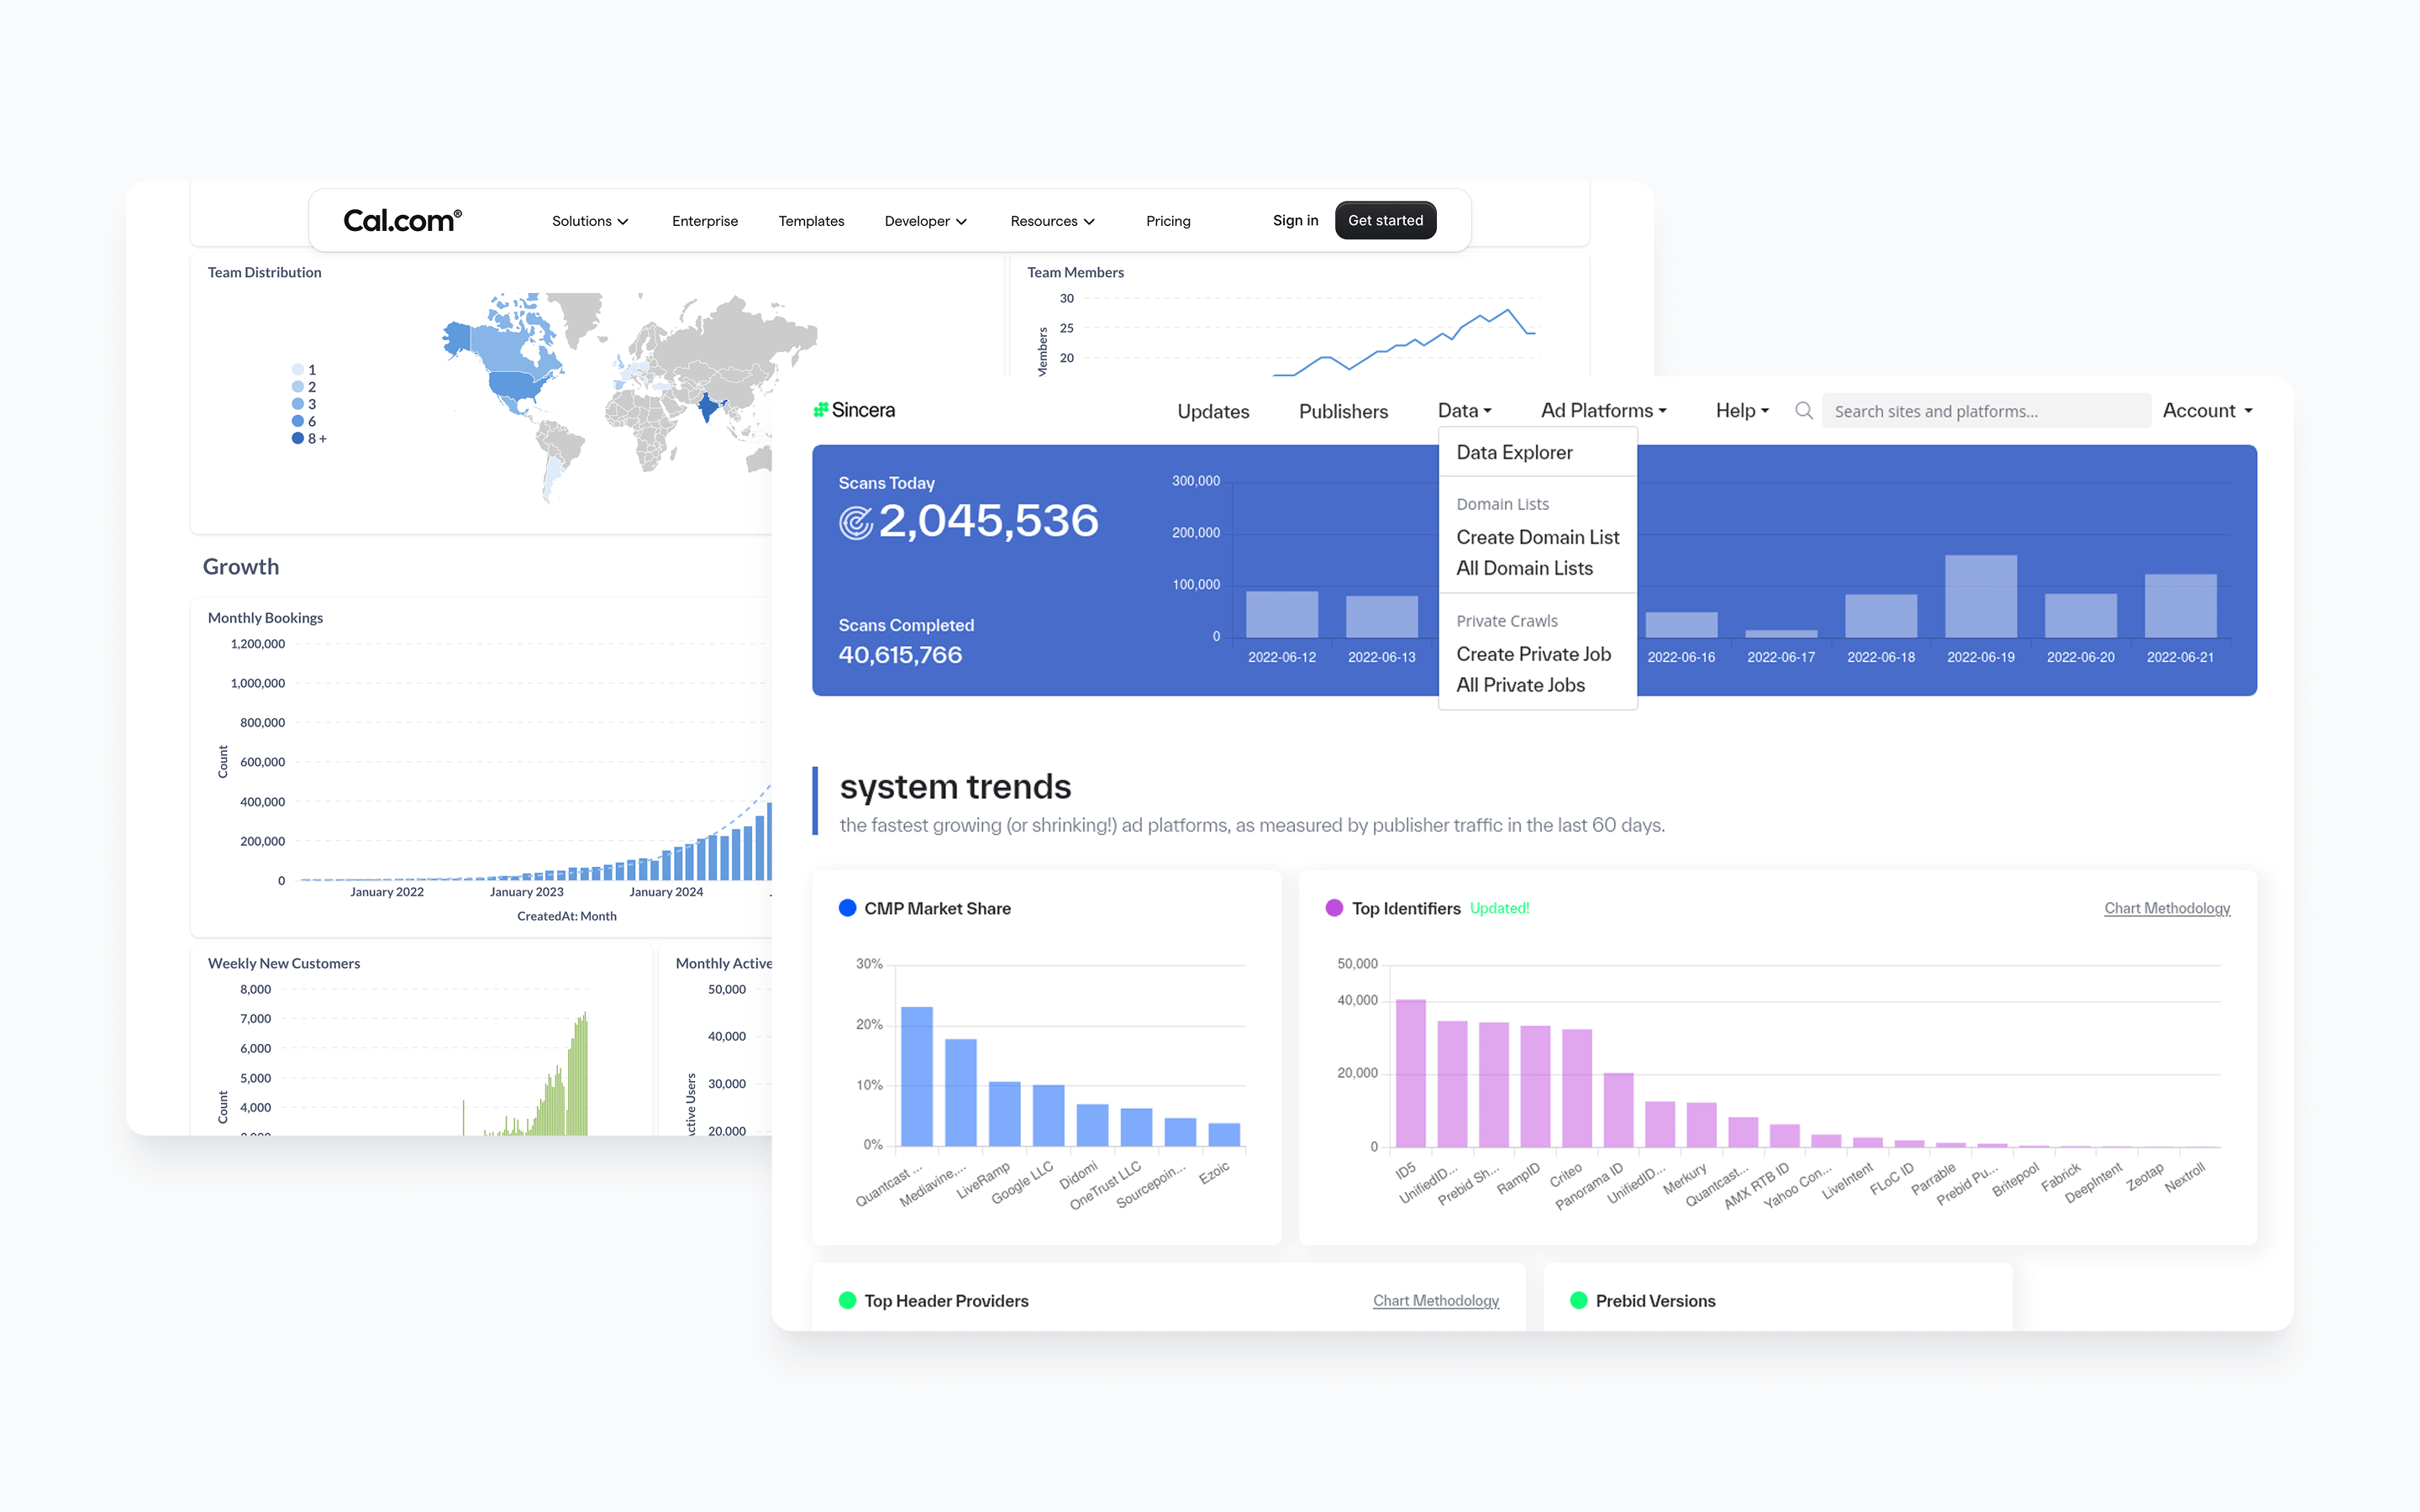
Embedded analytics let your users see their data right inside your product, and there’s a range of what that can mean in practice: from pre-defined static dashboards with some filters on top, to charts that let people drill down and explore, to interactive tools that allow people to ask their own questions and build their own analyses.
Interactivity is really the secret sauce here. If you enable people to explore their own data, it turns your analytics from a place that displays data into one that helps users work with their data: instead of showing a static metric like “CTR = 12%,” you’re enabling people to ask, “What did CTR look like last month? What about by campaign?”—and get the answer without leaving your app or asking for help.
And because you’re putting these tools inside your product, white-labeling is essential: your users shouldn’t ever know there’s a separate analytics tool under the hood. It should just feel like part of the app they’re already using, including fonts, colors, logos, maybe even interaction flow for a seamless experience.
What are the benefits of embedded analytics?
For your users
If your product is part of someone’s workflow, they’re probably making decisions with it. Without embedded analytics, your users rely on someone else in their org—usually an analyst or ops person—to pull numbers, build dashboards, or answer basic questions.
By embedding analytics into your product, you let users:
- Self-serve simple answers without asking someone else or learning SQL
- Make better decisions faster, because the data is right there when they need it
This shift empowers the end user, especially in tools where decisions happen quickly, like CRMs, support platforms, or E-commerce tools, so people go from “I wonder if this is working” to “Yes, and here’s why” without leaving your app.
For your business
- The deeper the integration of data, the more embedded (hah) your tool becomes in your users’ daily workflow, which leads to long-term engagement and lower churn.
- Embedded analytics can set your product apart from competitors, too: once users get used to having self-serve answers built in, they’re less likely to settle for tools that make them go elsewhere.
- Analytics are also a powerful way to generate revenue. You can use them as part of a premium offering, and make advanced reporting and custom dashboards a paid feature.
- Using an embedded analytics tool lets you move faster, scale more easily, and shift ownership of dashboards and metrics to non-engineering teams.
What are the use cases for embedded analytics?
Embedded analytics can show up anywhere your users need access to data, but it’s especially useful in SaaS products that sit close to business processes, and people rely on data to make frequent, day-to-day decisions.
Some examples:
- Healthcare platforms use embedded analytics to track patient outcomes or resource usage directly in their care portals.
- E-commerce platforms can surface insights like top-performing products, customer retention trends, or campaign performance directly in the vendor dashboard.
- Fintech apps give users live visibility into spend, risk exposure, or portfolio performance.
- Marketing SaaS platforms show channel ROI, audience engagement, or campaign lift.
The specific use cases can vary, but a few common themes show up across all of them:
- Reduce ad hoc data requests. If customers can explore their own data inside your product, they don’t need to reach out to your (or their) data team every time they want a report.
- Shorten time to value. If your product is supposed to improve something—like click-through rates, delivery times, or conversion—you want users to see that as soon as possible, and in-product analytics make that feedback loop immediate.
- Drive adoption of high-value features. Well-placed analytics can highlight what’s working, what’s underused, and prompt users to dig deeper into your product.
- Support more customers without custom builds. Embedded analytics makes it easy to provide each customer with their own scoped dashboards, without having to spin up individual reports. That’s especially useful in multi-tenant environments where you want to offer personalized insights at scale.
Learn how a digital learning platform implemented Metabase embedded analytics for educators and cut support requests by 87%.
What is the difference between embedded analytics and BI?
Embedded analytics is the alternative to traditional BI (that’s “business intelligence”) where if someone wants to ask a data question — say, what was the CTR on that one email — they have to go through a few steps: ask a data person to set up the integration; wait for the data person to pull the numbers and build a dashboard; go to a separate BI tool to see the results - all with a few (or a lot) back-and-forth along the way. It slows down decision-making and ties up the data team with one-off requests. And at the end of the day, it’s someone else’s dashboard in someone else’s tool.
Embedded analytics, on the other hand, enables your users to get the data they need right when they need it — inside your product. It’s your users answering their own questions, in your product, in real time.
How to implement embedded analytics?
To add embedded analytics to your product, you’ll need to first decide what users should be able to do with it. What questions do you expect users to ask? Do they just need visibility into usage? Do they want to slice performance by team or campaign? This helps scope both the UI and data complexity.
Embedded analytics approaches
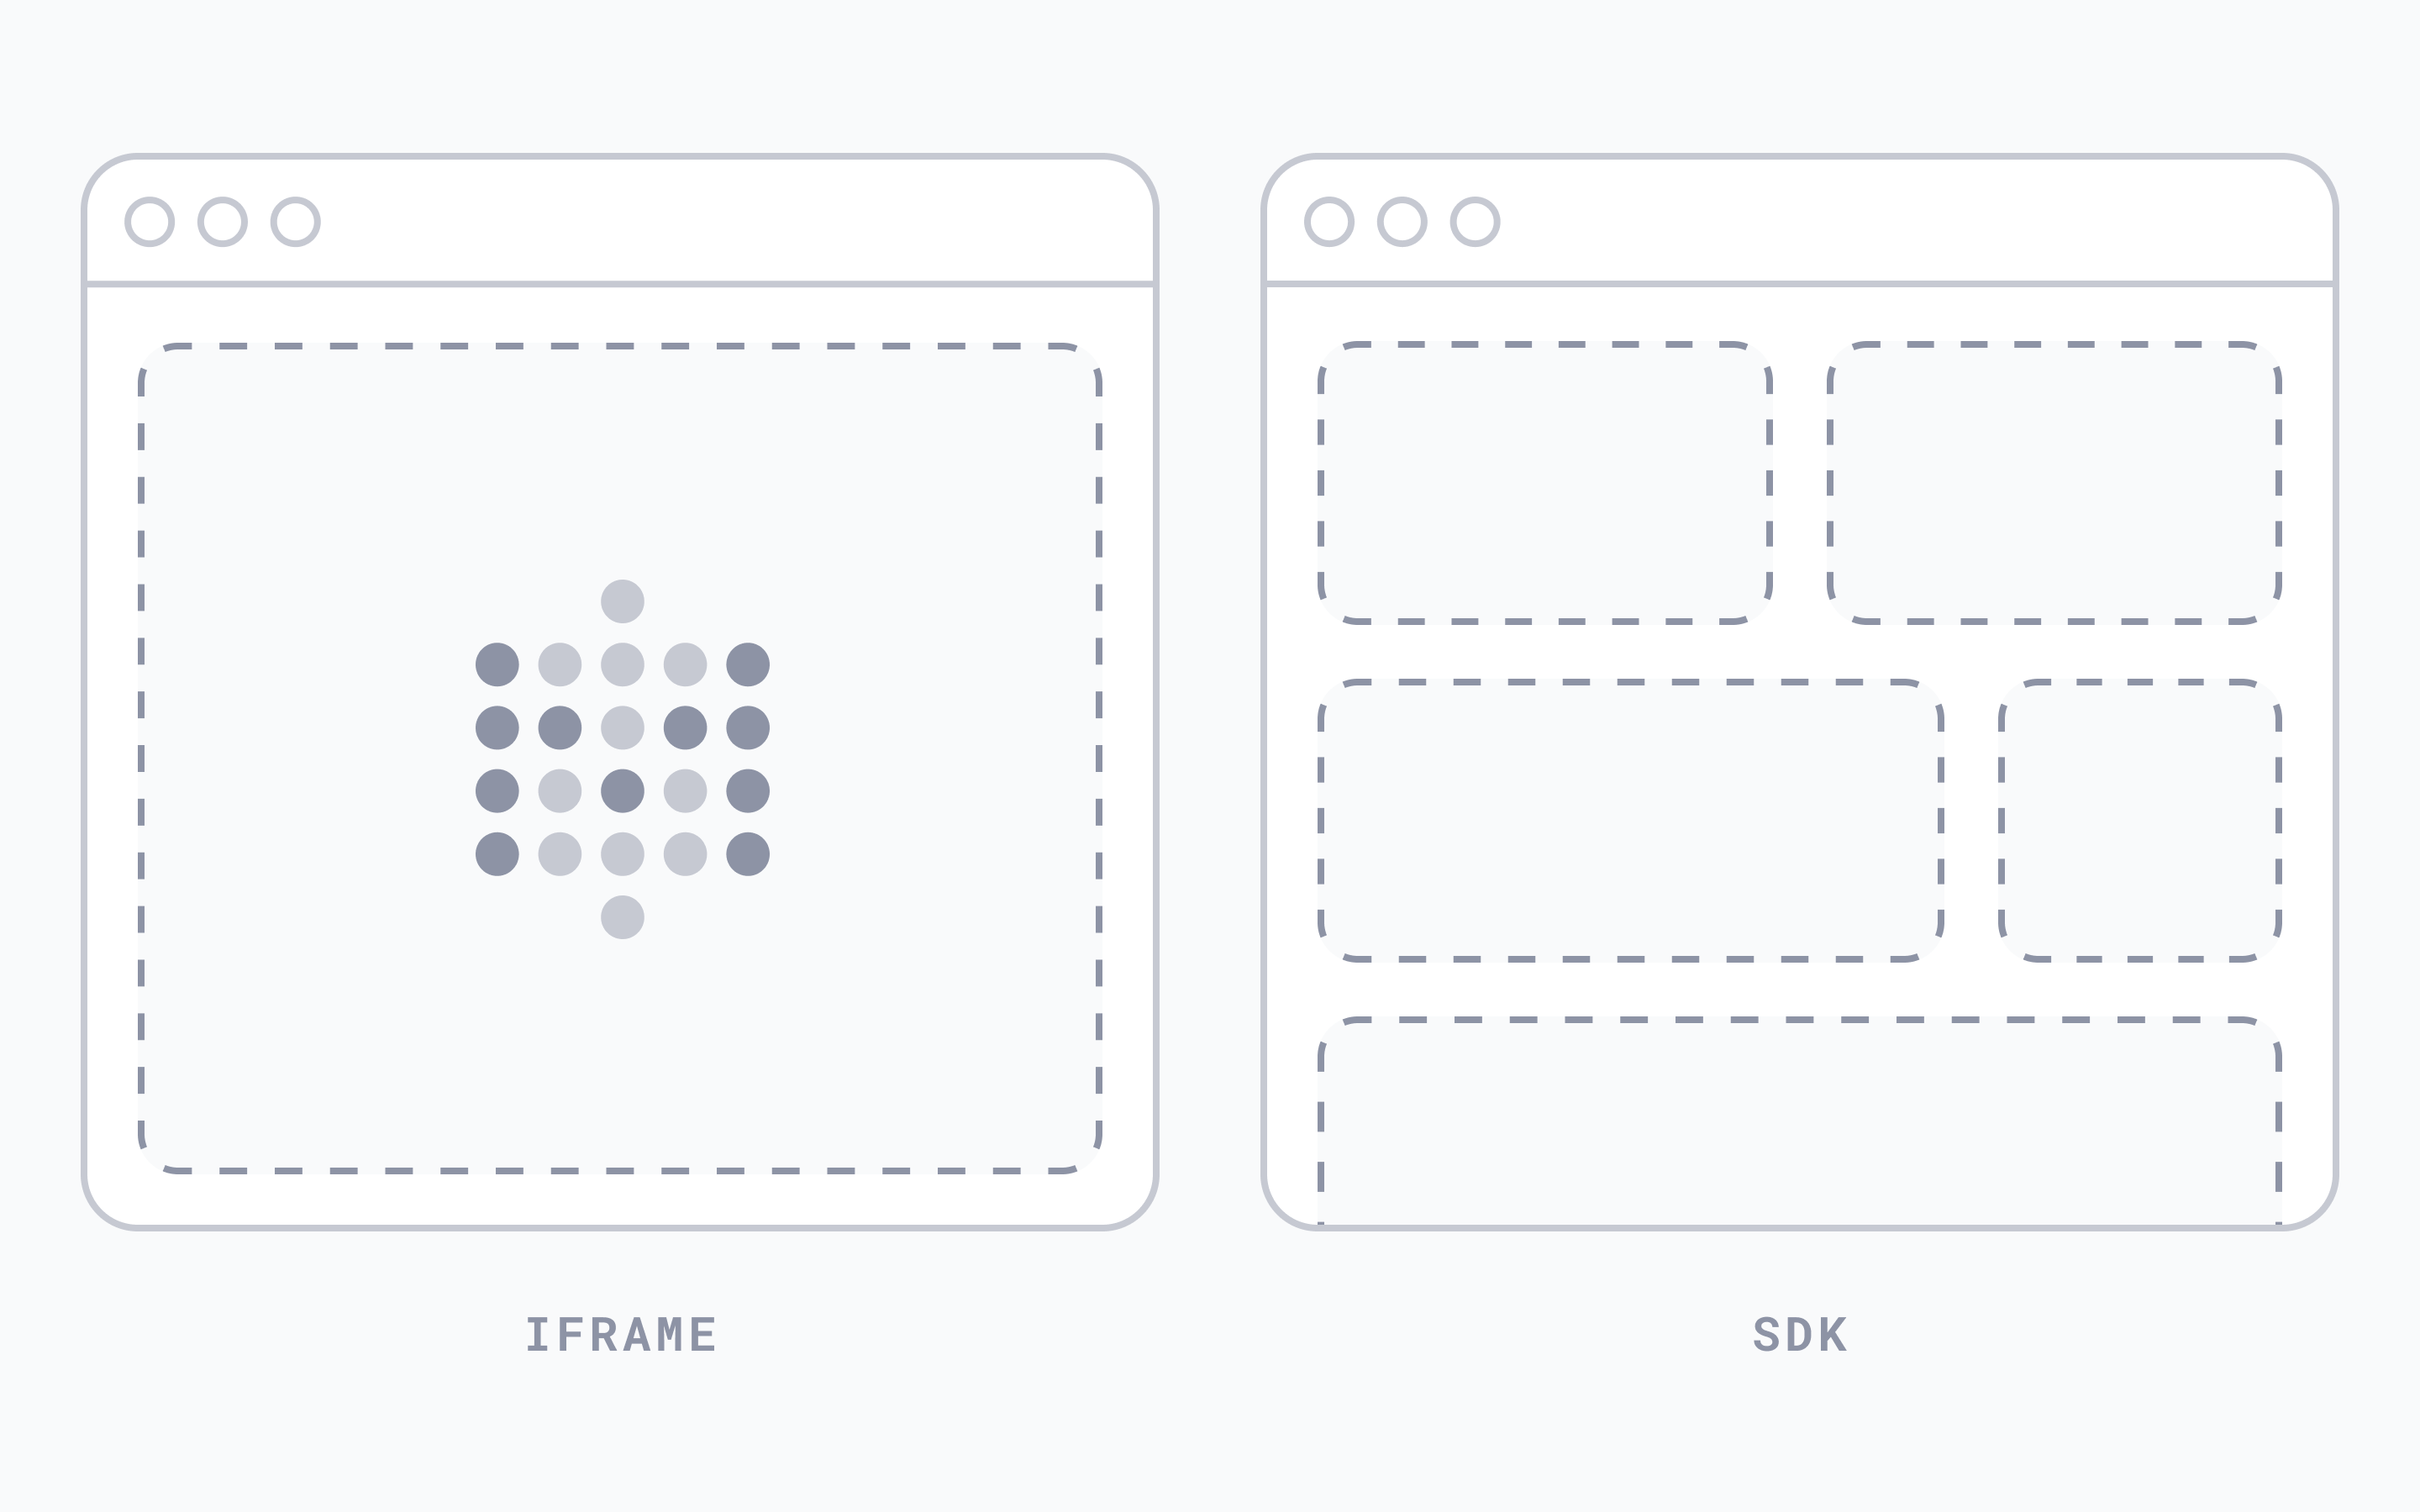
- Iframe: This is the least-effort path. You take an existing analytics product (like Metabase, Tableau, or Sisense) and just iframe it into your app like you would a YouTube video, with some styling added on top. It’s a (relatively) quick, (relatively) painless approach, so it makes a great starting point. The downside is that it doesn’t allow for advanced customization
- SDK: More flexible approach. With a JavaScript SDK or front-end components (like Metabase React SDK), you can pick and choose the exact individual components you want to embed.
- Build your own: The most customizable (and engineering-heavy) option. You query an analytics engine via API and build your own UI on top. Best suited for teams with strong frontend resources and very specific UX requirements.
Learn how an eCommerce platform went from from zero to a proof of concept for their in-app reporting in under 30 days with a single developer using the Metabase Embedded Analytics SDK.
Things to keep in mind
- Plan for security from the get-go: your users should only see to see “their” data, so you’ll need to set up permissions accordingly. Don’t put this off till the last moment-permissions are usually the messiest part of embedding.
- Ensure performance and reliability: when reporting is part of your app, users will blame you if something’s slow or broken, so make sure your embedded analytics solution can handle the load.
- Handle governance and maintenance: Once dashboards go into your product, they’re not just internal tools anymore. You’ll need a process for versioning, QA’ing changes, and making sure definitions stay consistent (“what is active user again?”). If you have a data team, loop them in early. If not, consider appointing a PM or tech lead as the source of truth.
Challenges of implementing embedded analytics
Embedded analytics is a great idea in theory, but in practice, there are some real-world hurdles you’ll probably run into:
Integration
Sure, technically you can drop an iframe into your app in an afternoon. But getting your data to show up in the first place (and getting the right data shows up for the right user) and making UX feel like part of your product takes a more effort. You’ll need to wire up authentication, set up user-level permissions, and tweak styling.
What helps: Start small. Pick one report to embed first, and treat it like a scoped feature rollout. Use that to prove out the integration pattern before scaling.
Security and compliance
You need to make sure users can’t access data they shouldn’t see, and that your system is logging, isolating, and scoping data correctly. Especially in industries like healthcare or finance, embedded analytics has to play nicely with the compliance frameworks that you’re working under.
What helps: Choose tools that support row-level security, scoped embeds, and audit logging out of the box.
Scalability
Even if only a fraction of your users use reporting, the load can spike if you let people explore data on their own. A few badly written queries can bring things down fast.
What helps: Model your data with an eye towards analytics: use pre-aggregated tables where you can, set sensible limits on filters and date ranges, and monitor performance early. You don’t want analytics to be the thing slowing down your app.
Vendor lock-in
Once you pick a vendor for embedded analytics, it’ll be hard to switch, especially if you’re using more advanced embedding approaches like SDKs, so you’ll want to minimize the risk that you’ll need to rebuild everything from scratch in the future.
What helps: Go with a product that’s stable, well-documented, and actively maintained.
How to choose an embedded analytics solution?
If you’re not building everything yourself (and most teams shouldn’t), you’ll want to evaluate platforms built for embedded use cases. Here’s what to look for when evaluating your choices:
- Time to value. You’ll want to assess how easy it is to go from data → chart → embedded view in your app. Look for a solution that lets you move fast at first, but won’t box you in as your needs grow.
- Integration. Choose between iframe embedding, SDK, or more custom builds based on your customization needs and your in-house engineering expertise.
- Scalability. Today you might just want to show a dashboard or two. But what about next quarter, when sales asks for custom reporting for each customer? Does the tool support growth, both in data volume and user base?
- Security. Make sure the solution supports row-level permissions, user-specific filtering, and interactive exploration—ideally without you rewriting everything from scratch. Bonus points if your non-engineering team (like product ops or data) can manage the content directly.
- Pricing. Some vendors charge by viewer, some by query volume, some by number of dashboards. Depending on your user base and usage patterns, things can get expensive fast. Be especially careful with usage-based pricing if you’re planning to allow interactive exploration. A few power users can rack up costs quickly.
Conclusion
Metabase Embedded Analytics offers solutions for all use cases, whether you need a basic dashboard in your product before lunchtime, or fully customized and deeply integrated analytics in your app. Start with basic static embedding for free, or start a free trial for white-labeled interactive analytics.