‧
4 min read
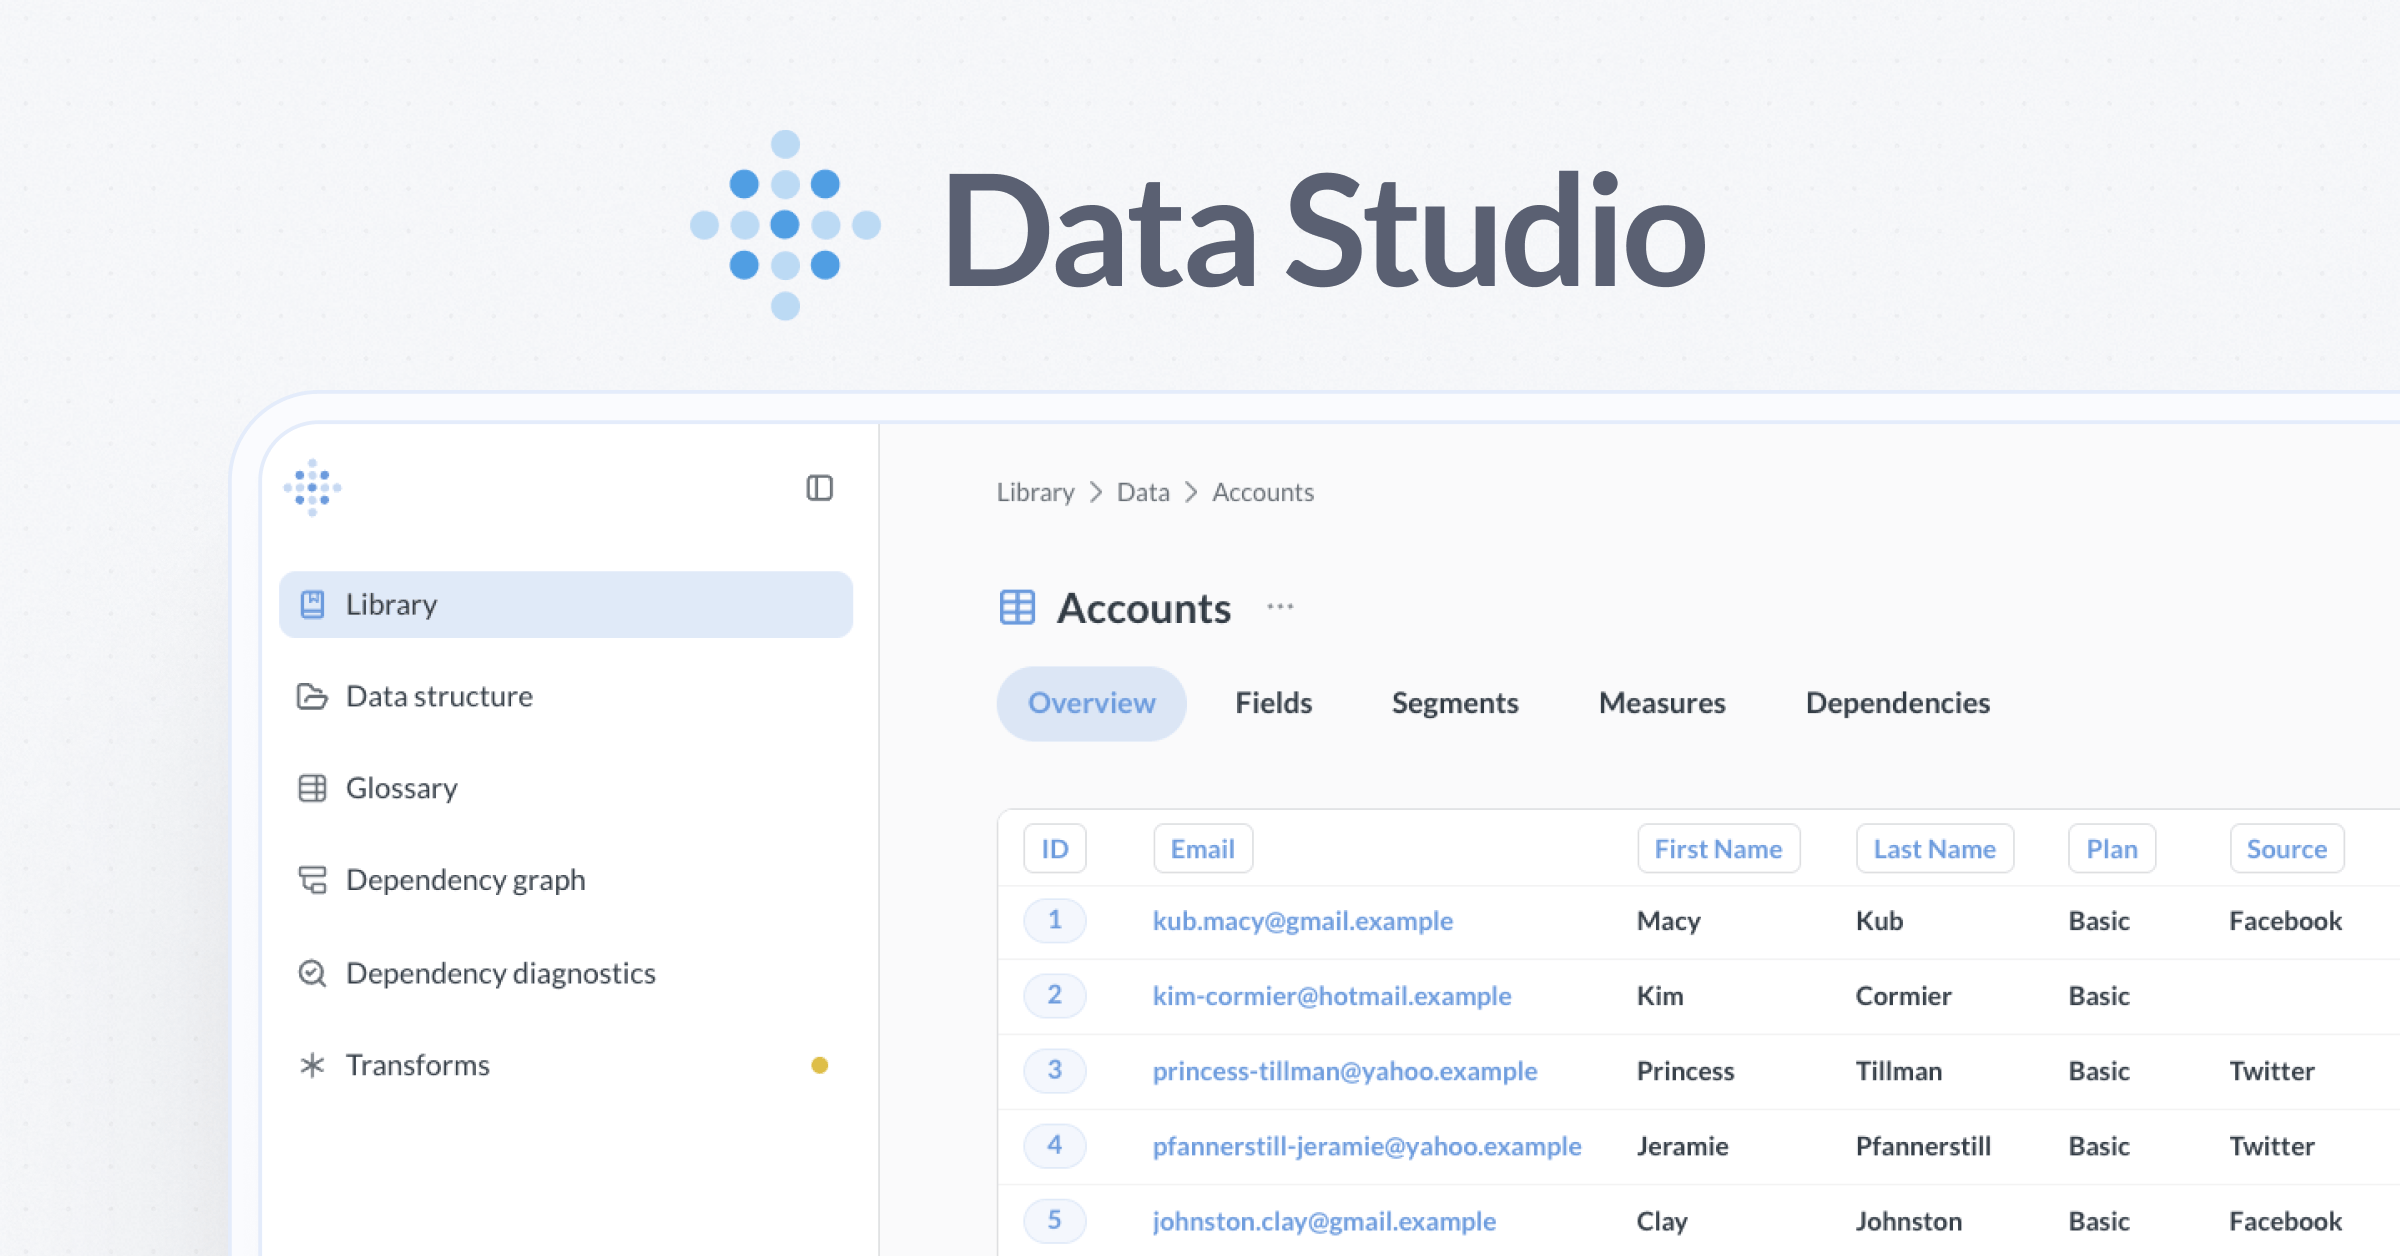
How to build sales dashboards that sales teams actually use
Margaret Rimek
‧ 4 min read
Share this article
Most sales dashboards get ignored.
They’re built to look good in a QBR, not to help someone close a deal. Reps say they want dashboards-but what they really want is answers: who to call, what’s stuck, and how close they are to quota.
The truth is, a lot of sales dashboards are built by people who’ve never sold a thing. The result: performance metrics no one checks, charts no one trusts, and tools no one opens.
If you want a dashboard that gets used, start simple, build fast, and listen hard. Then iterate. Because usage beats requirements every time.
Check out a live Sales Team Dashboard built in Metabase.
Why most sales dashboards get ignored
Sales dashboards often end up as decoration: nice to look at, but ignored by the team. Here’s why:
- They report, not support: Good for QBRs, useless for day-to-day work
- Vanity metrics everywhere: Total pipeline, but no clue what’s actually moving
- They go stale: Data exports, no real-time updates
- They aren’t explorable: Reps can’t dig into their own numbers
How to build a sales dashboard team will actually use
Here’s what actually works:
- Start with real questions: What’s slowing us down? Where are deals stalling? Who needs help?
- Keep load time under 3 seconds: Speed is table stakes
- Prioritize action: If a chart doesn’t change behavior, drop it
- Build for self-service: Reps should answer their own questions without asking for help
Dashboards that help people do their job get used. Everything else is noise.
10 top metrics for a sales teams dashboard and how to calculate them
Begin with big-picture metrics to understand overall performance. Then drill down by rep or stage to spot what needs attention.
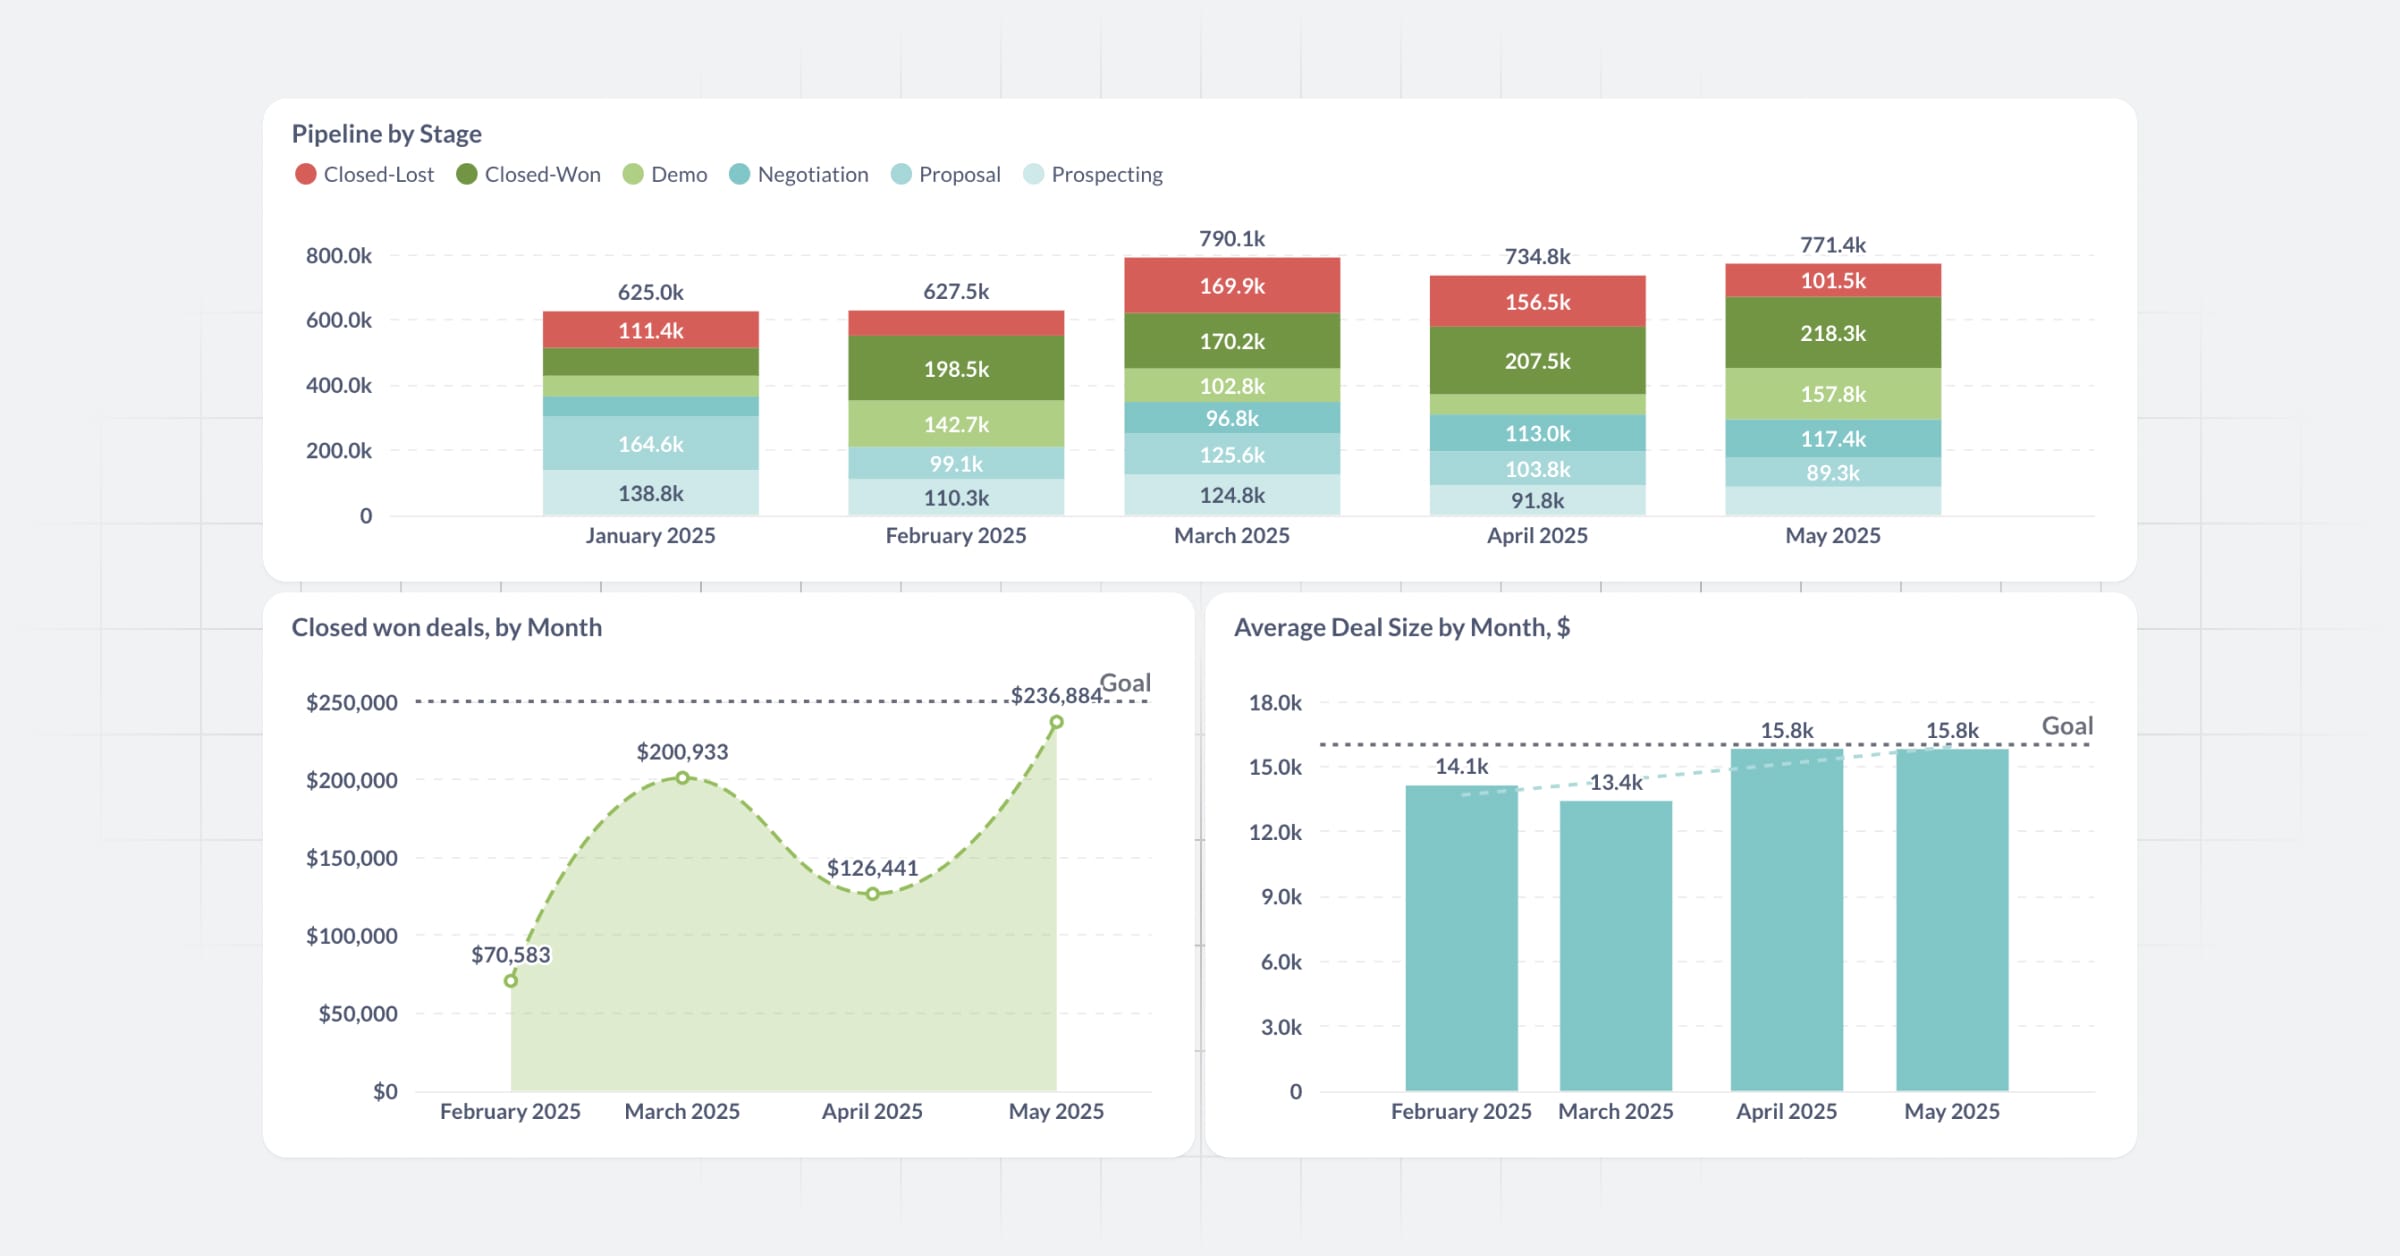
1. Pipeline by Stage
Why it matters: Shows where deals sit in the funnel and helps identify bottlenecks. In Metabase, you can drill into each stage to view the underlying deals.
How to build: Group deals by stage_name, count or sum deal_amount.
2. Closed-Won revenue
Why it matters: Tracks actual sales outcomes over time.
How to build: Filter stage = 'Closed-Won', group by closed_at month, sum deal_amount.
3. Opportunity win rate
Why it matters: Measures efficiency-how many opportunities convert into closed-won.
How to build: closed_won_count / (closed_won_count + closed_lost_count) grouped by month or rep.
4. Average Deal Size
Why it matters: Bigger deals can skew revenue-track trends and rep performance.
How to build: AVG(deal_amount) grouped by month or rep.
5. Sales cycle length
Why it matters: Helps identify delays in the funnel and forecast more accurately.
How to build: DATEDIFF(closed_at, created_at) averaged for closed-won deals.
6. Quota attainment by rep
Why it matters: Tracks individual performance vs. goal.
How to build: Join deal data with quota table, compare SUM(closed_won_amount) to target.
7. Pipeline contribution (by Source or Rep)
Why it matters: Know who or what channels are feeding your funnel.
How to build: Sum deal_amount grouped by source or rep.
8. Stage-to-stage conversion rates
Why it matters: See where deals drop off in the funnel.
How to build: Funnel chart showing count of deals at each stage transition over time.
9. Commission Forecast (Real-time)
Why it matters: This is the most viewed dashboard for many sales teams. It’s personal and drives action.
How to build: Multiply deal_amount * probability * commission_rate. Filter by rep and group by close month.
10. Next expected orders
Why it matters: Helps reps prioritize outreach by surfacing accounts likely to buy again soon.
How to build: Use expected_close_date to identify deals closing within the next 7-14 days. Optionally, base it on reorder history.
Helping your sales team adopt self-service analytics
If a dashboard requires a ticket to update, it won’t get used. Sales teams need tools they can adjust without help.
Metabase makes it easy to:
- Build without SQL using the Visual Query Builder
- Add filters for date, rep, and stage
- Click into charts to drill down to the raw data
- Set up alerts when metrics cross thresholds
Metabase helps you go from question to chart in minutes. Build once, share with the team, and let them explore.
Explore a real Sales Team Dashboard or get started with Metabase.