


X-rays
X-rays are a way to get automatic insights and explorations of your data.
Get automatic insights when clicking on a chart
One great way to explore your data in general in Metabase is to click on points of interest in charts and selecting Automatic insights.
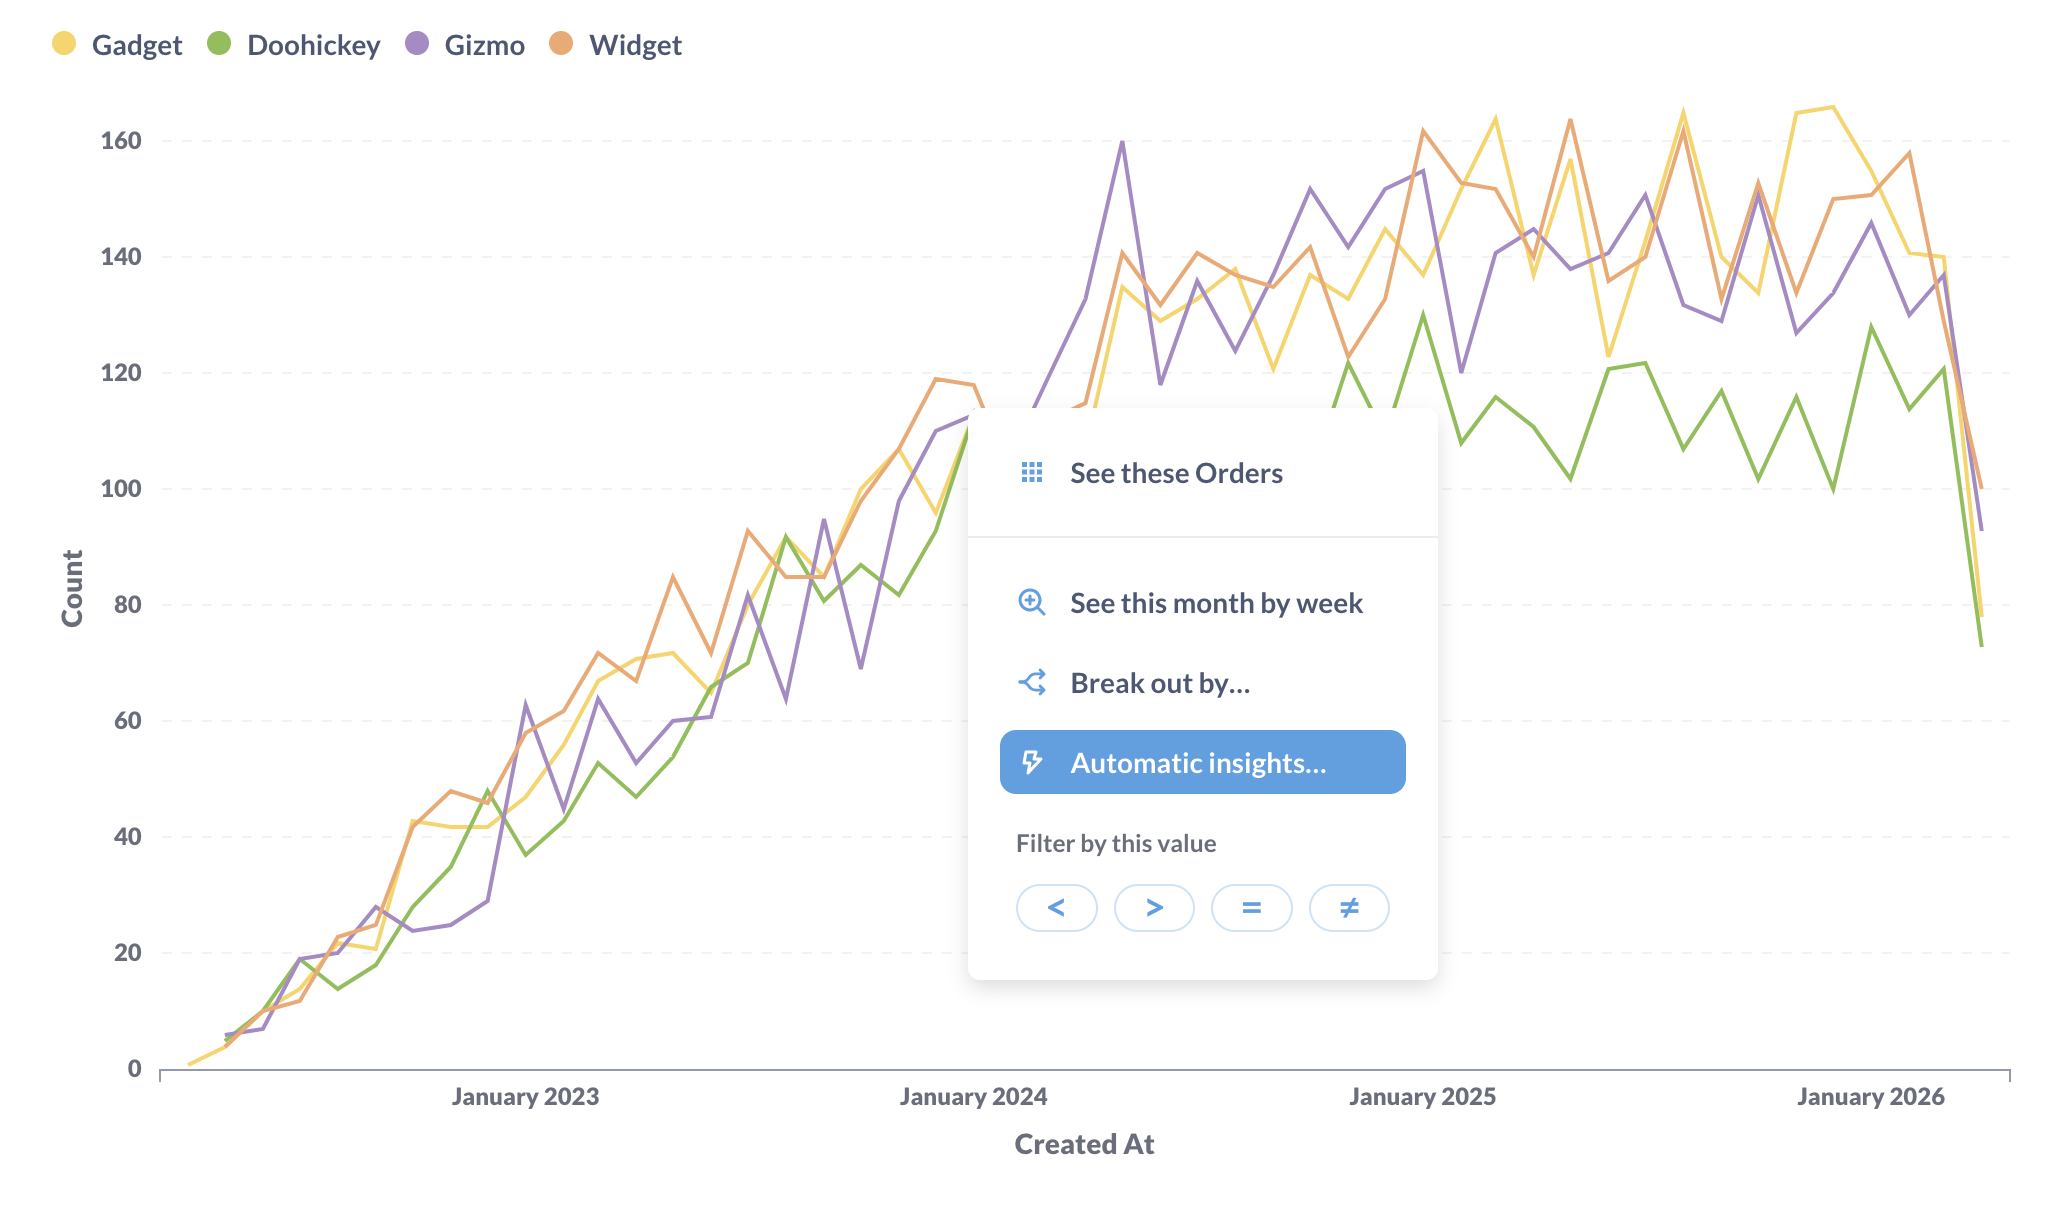
Metabase will give you some options:
- X-ray
- Compare to the rest
In both cases, Metabase will take a look at the fields in that table or model, and automatically generate charts that summarize the data based on the data types it finds.
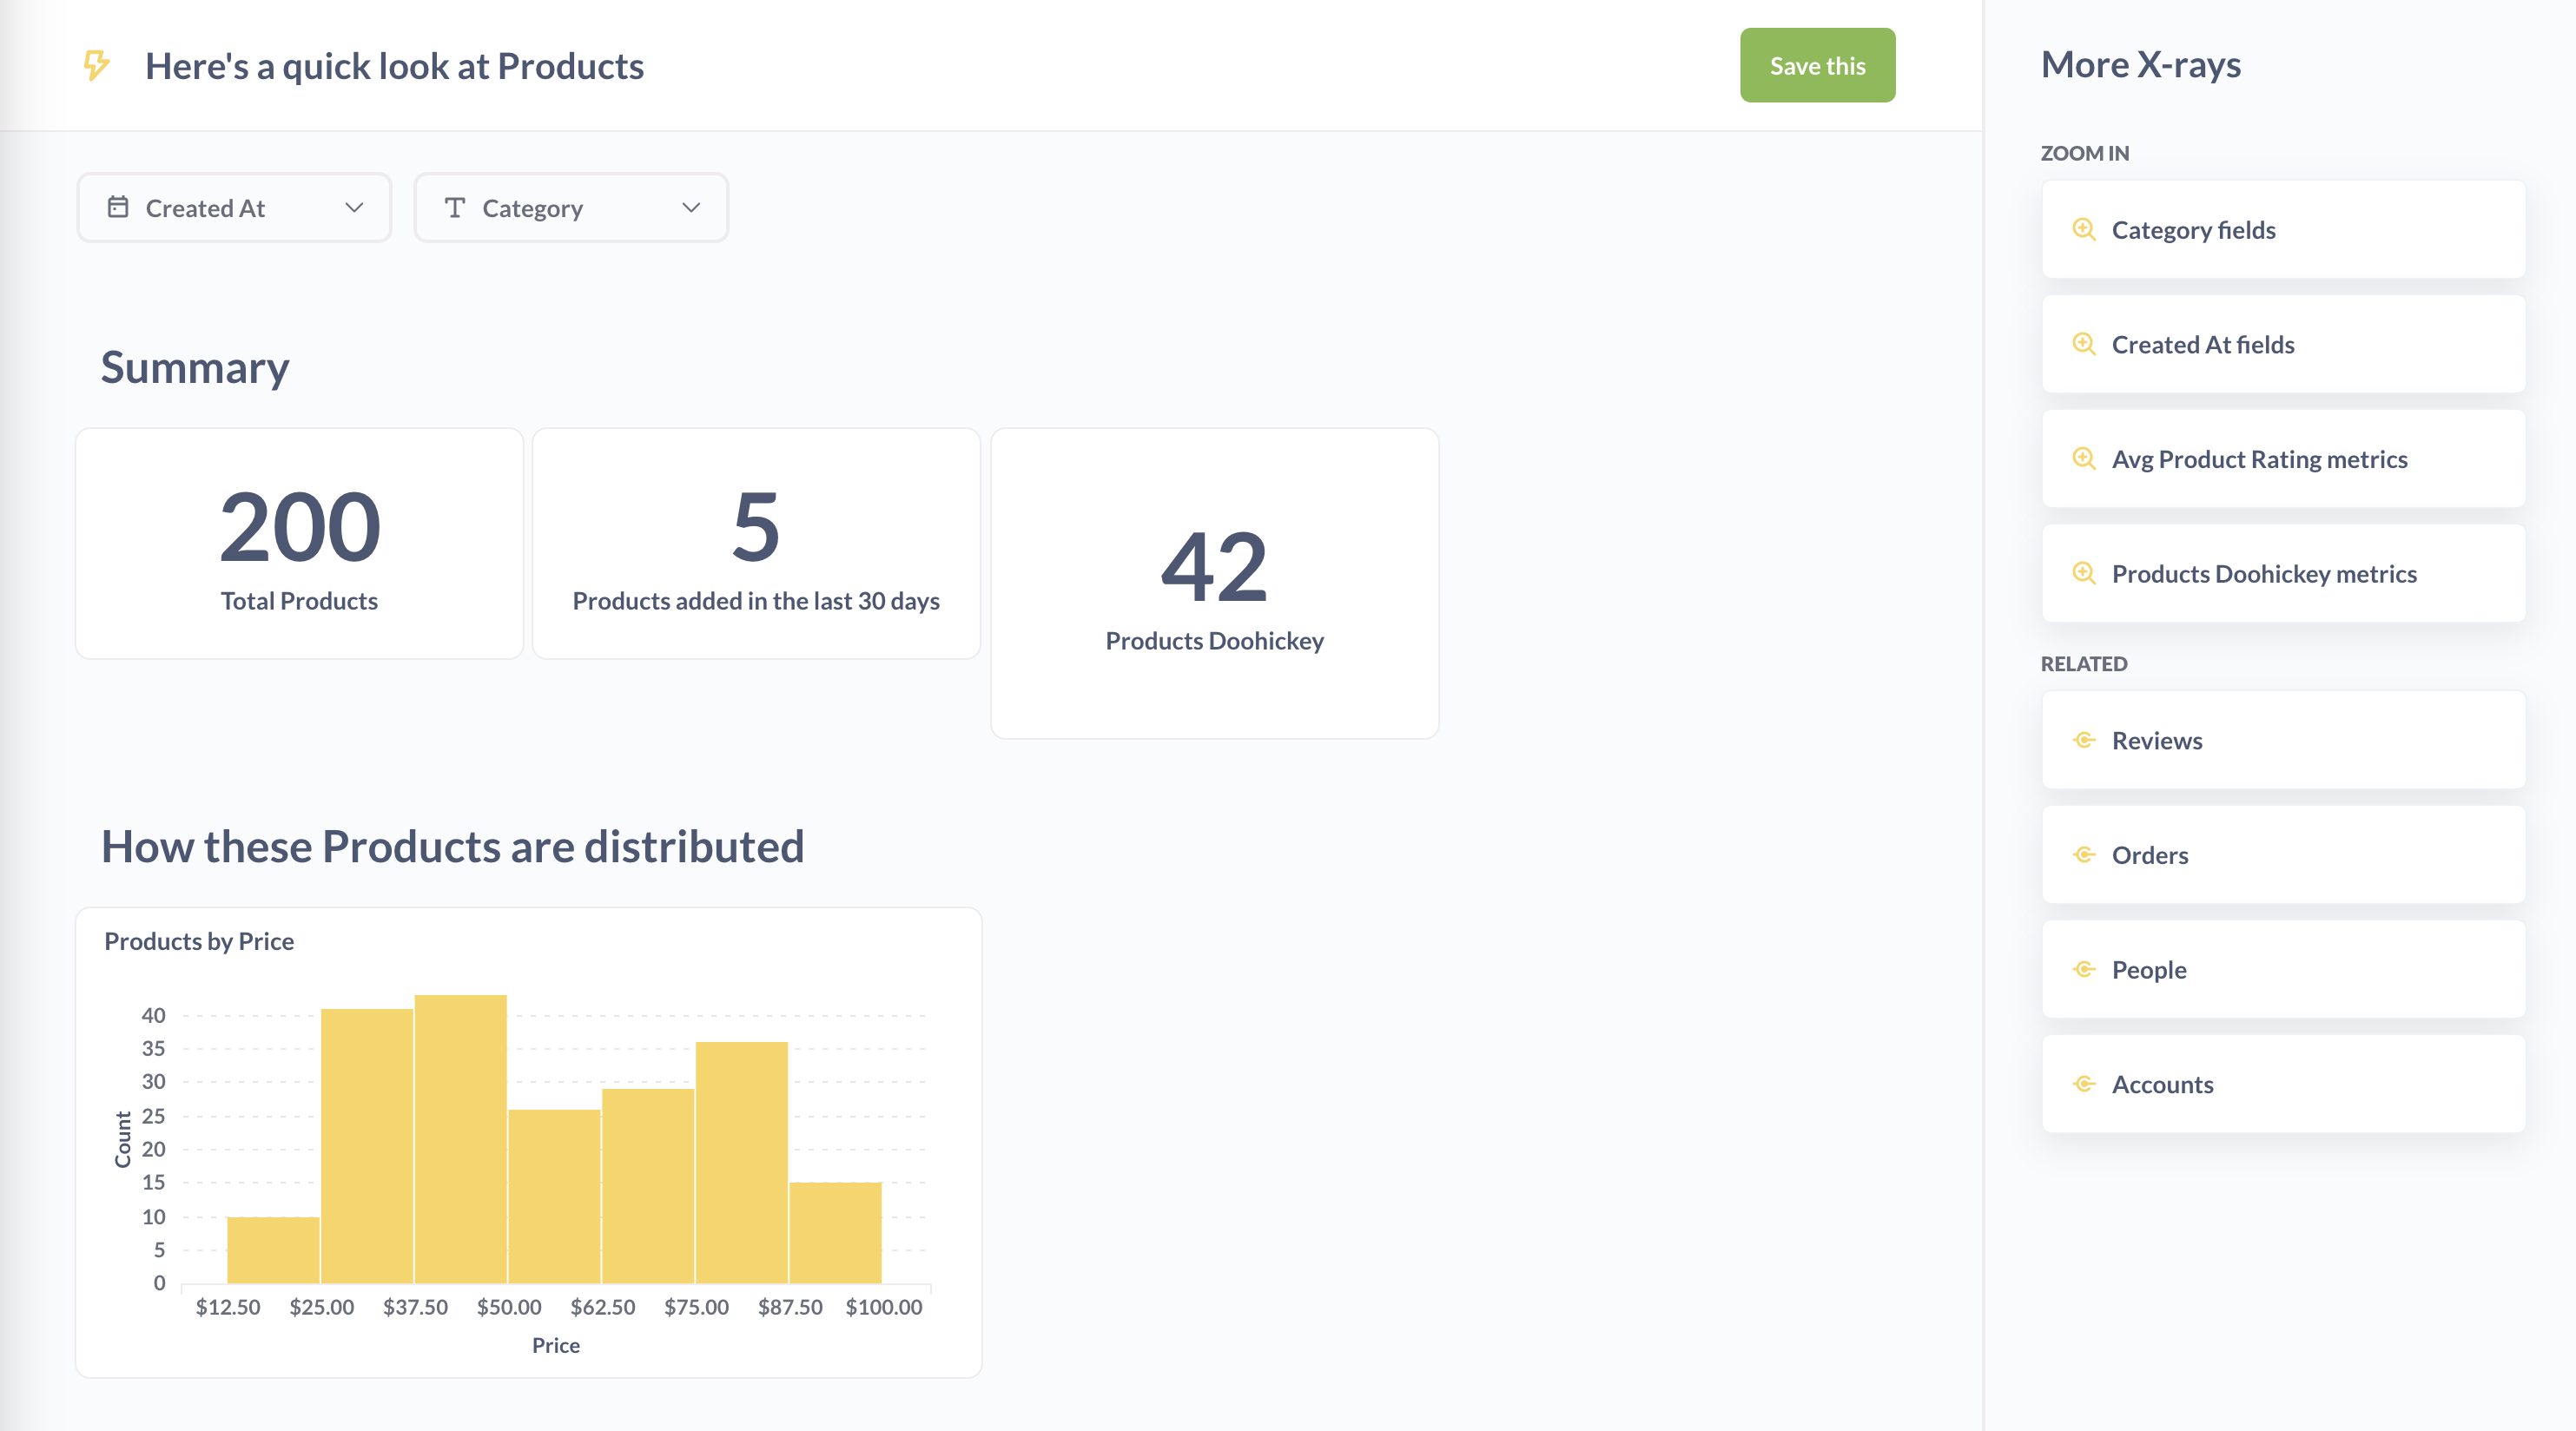
Here’s an example X-ray:
X-raying models and tables
Another great way to get to know your data is by X-raying your models and tables.
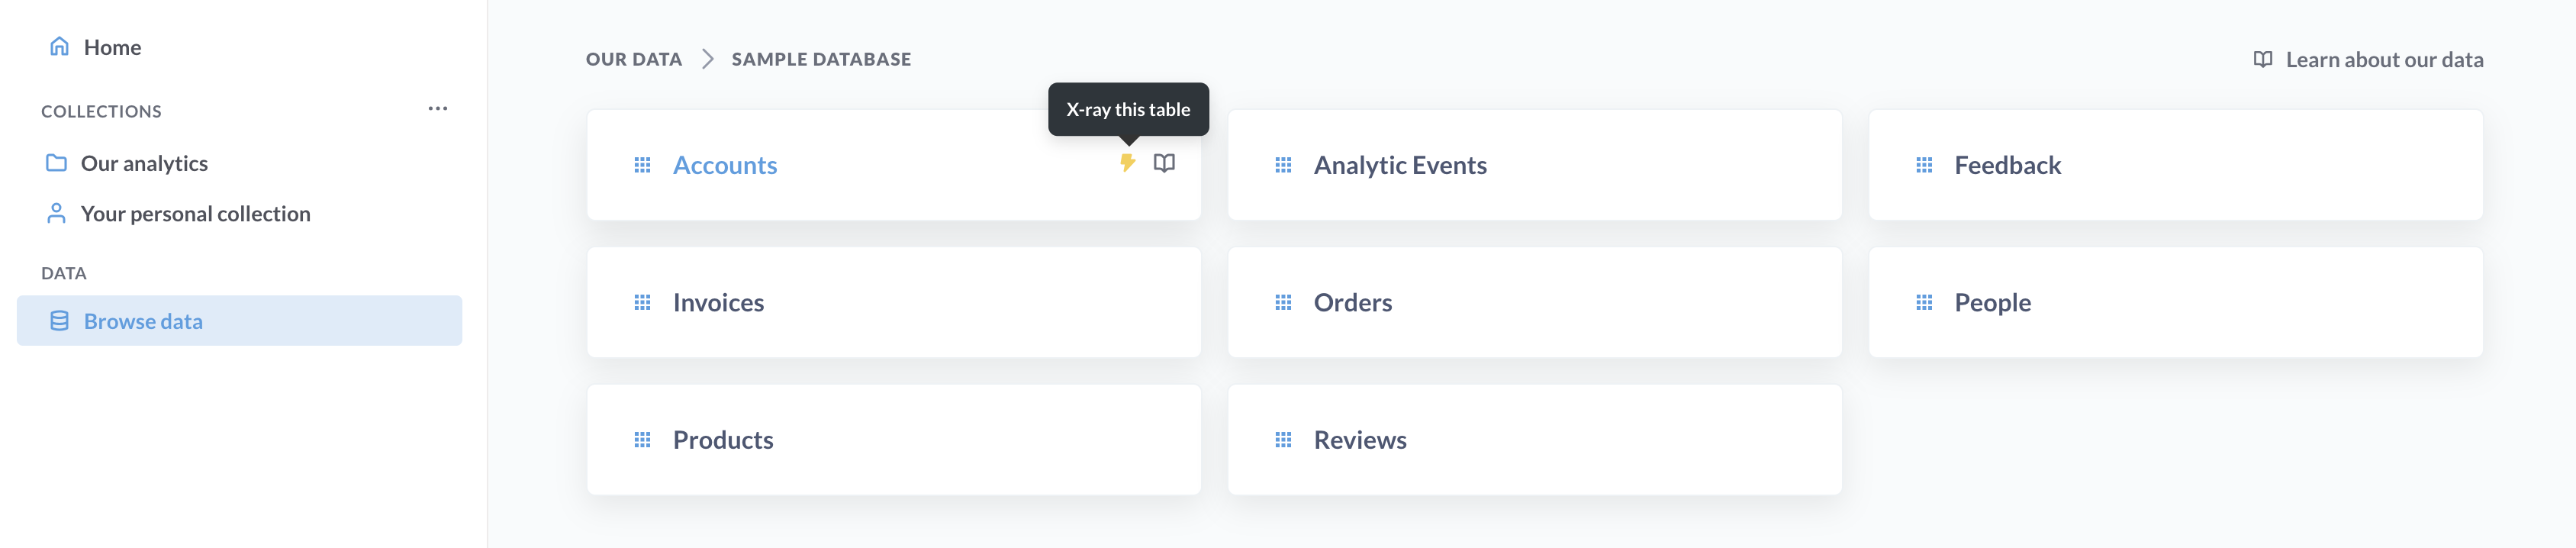
- Table X-rays: From the left nav, click on Browse Data, pick a database, hover over a table card, and click the lightning bolt icon to view an X-ray of the table.
- Model X-rays: Click on the ellipses for a model and select X-ray this.
X-rays in the data reference
You can also view an X-ray by browsing to a table and clicking on the lightning bolt icon. Click on the Browse Data button in the top navigation, select a database, and hover over a table to see the icon.
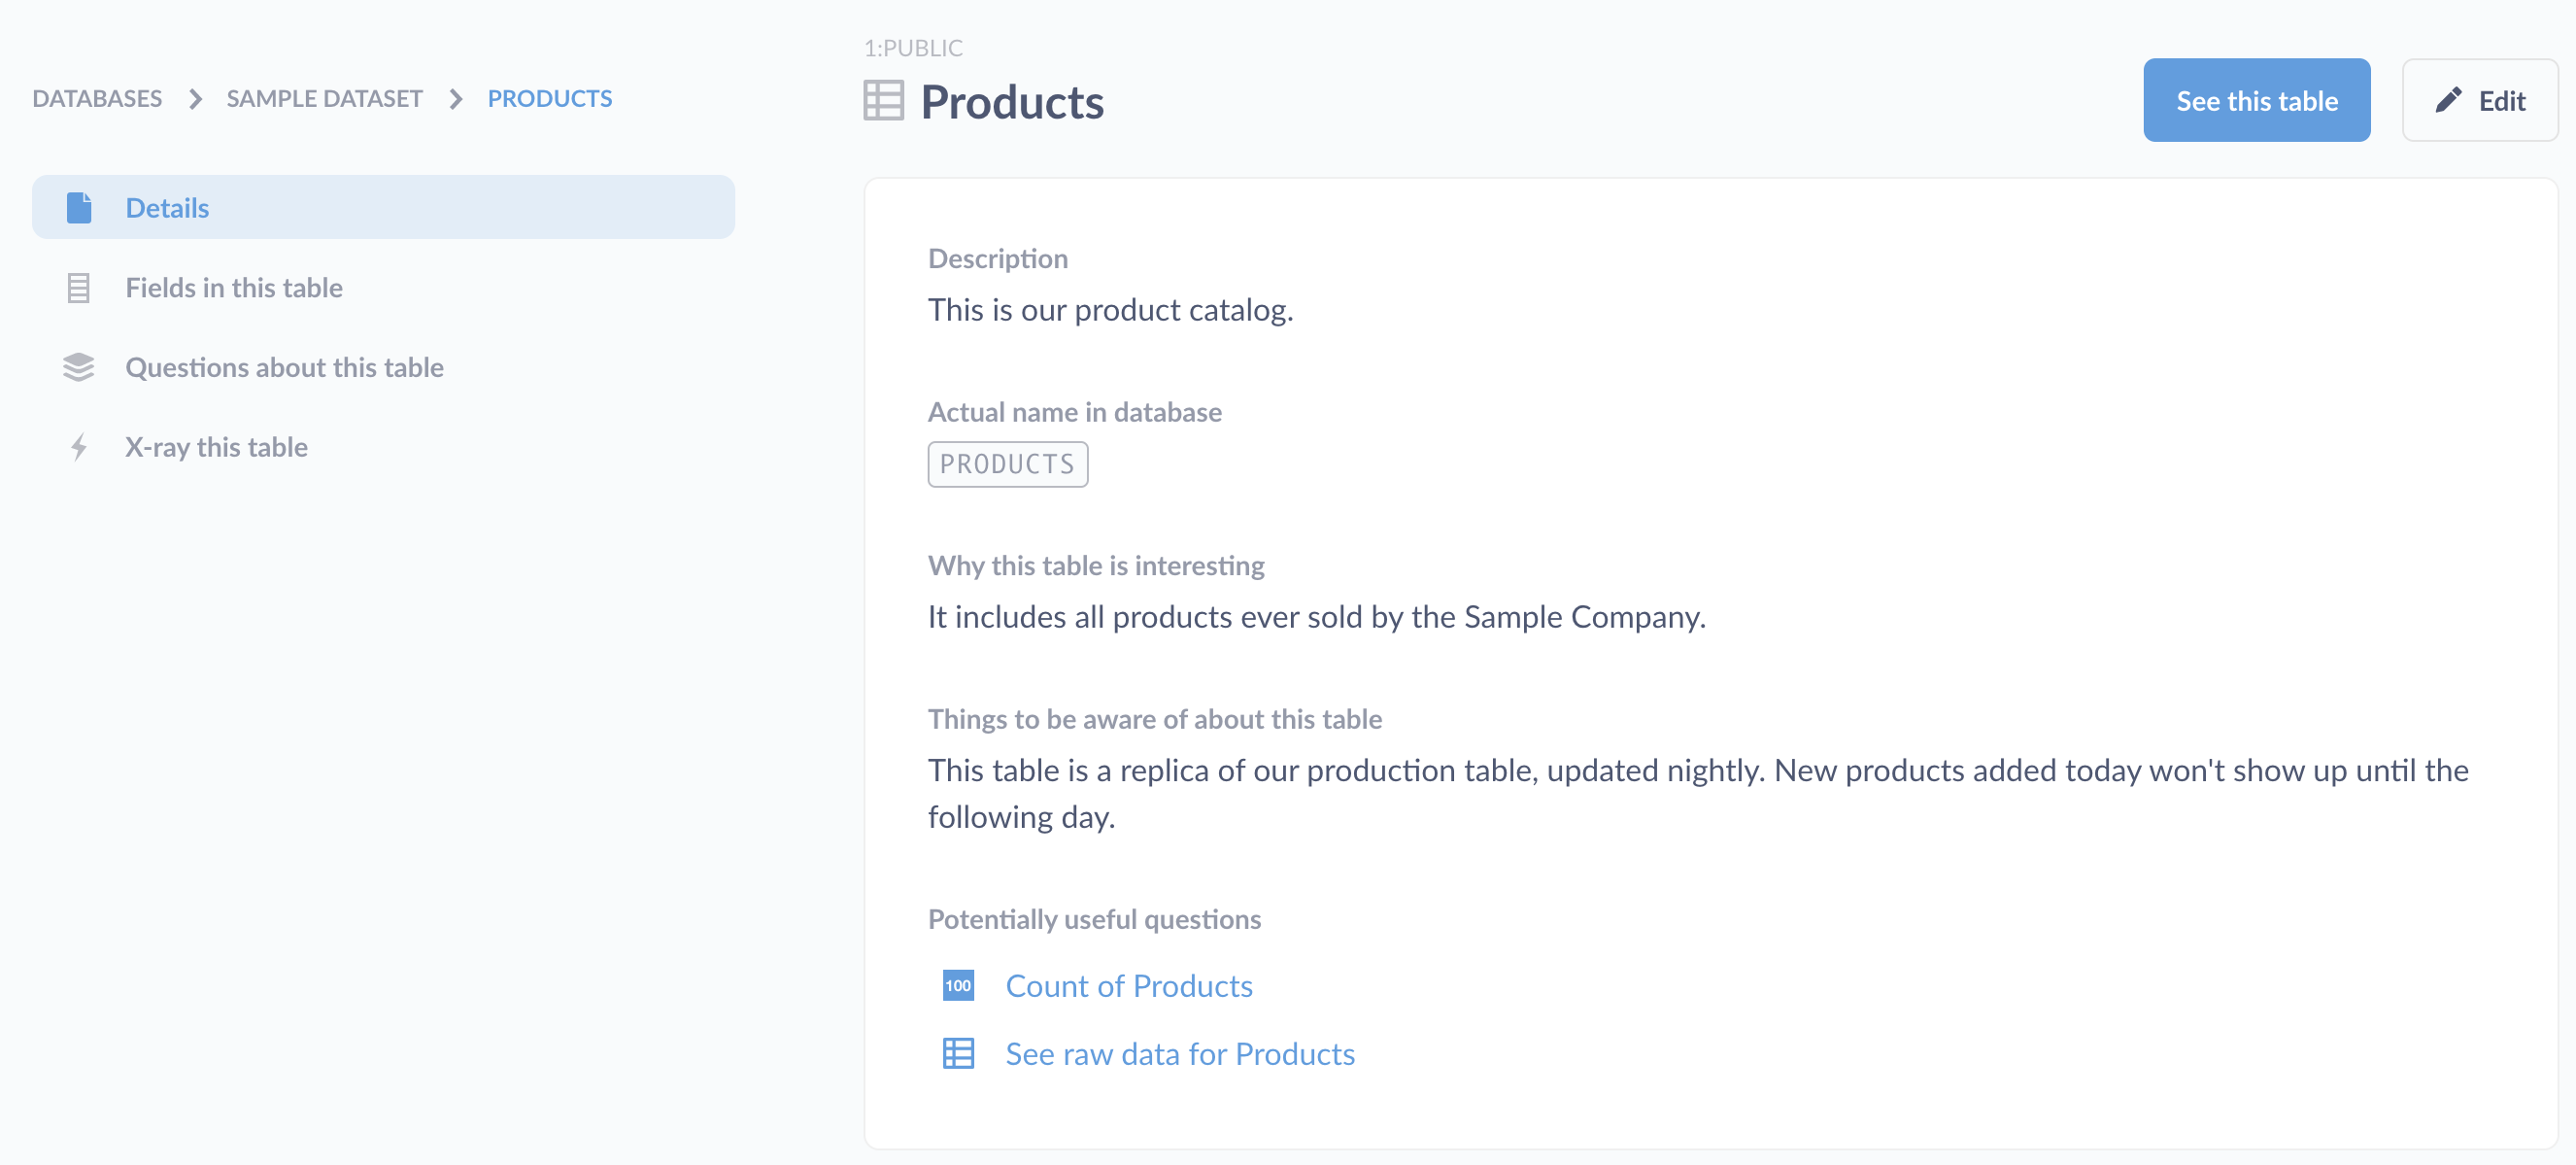
From the Browse Data page, you can also click on Learn about our data to view the Data Reference section. From here you can navigate through databases, tables, columns, metrics, or segments, and you can click on the X-ray link in the left sidebar to see an X-ray of the item you’re currently viewing.
Exploring newly added data sources
If you’re an administrator, when you first connect a database to Metabase, Metabot will offer to show you some automatic explorations of your newly connected data.
Browsing through suggested X-rays
Depending on the X-ray you’re currently viewing, you’ll see suggestions that will let you:
- Zoom out: view an X-ray of the table the current X-ray is based on.
- Zoom in: see a more detailed X-ray about a field or dimension of the current X-ray.
- Related: X-ray some related data, like a metric based on the current table, or a different table related to the current one.
Saving X-rays
If you come across an X-ray that’s particularly interesting, you can save its cards and filters as a dashboard by clicking the green Save this button. Metabase will create a new dashboard and save it to the Automatically generated dashboards collection (though you can move the dashboard to any collection you have curate access to).
Disabling X-rays
If for some reason X-rays aren’t a good fit for your team or your data, administrators can turn them off completely by clicking on the grid icon in the upper right and going to Admin > Settings > General and toggling the option to Enable X-ray features.
If you pin any dashboards in the “Our Analytics” collection, Metabase will hide the X-ray suggestions that appear on the homepage.
Admins can also manually remove these suggestions by clicking on the Customize button in the upper right and selecting a dashboard as your homepage. Changing the home page won’t disable the X-ray features in the rest of Metabase.
Read docs for other versions of Metabase.