


Observability with Prometheus
You can export metrics in Prometheus format from your Metabase.
Running Metabase and Prometheus locally
To give you an idea of how Metabase and Prometheus would work in your production environment, we’ll walk through how to set up Metabase and Prometheus locally.
Start up Metabase with MB_PROMETHEUS_SERVER_PORT
Download the latest Metabase JAR, and run Metabase using an environment variable to specify the Prometheus server port:
MB_PROMETHEUS_SERVER_PORT=9191 java --add-opens java.base/java.nio=ALL-UNNAMED -jar metabase.jar
The MB_PROMETHEUS_SERVER_PORT=9191 specifies which port (9191) Metabase will use to send data to Prometheus. To clarify the ports that will be involved here:
- Port
3000is the port Metabase uses to serve the Metabase app. You can set another port withMB_JETTY_PORT(e.g.,MB_JETTY_PORT=3001). - Port
9191(or whichever port you specified with theMB_PROMETHEUS_SERVER_PORTenvironment variable) is the port Prometheus uses to scrape metrics from Metabase. - Port
9090is the port Prometheus uses to serve the Prometheus application.
When you start Metabase, the Metabase logs will tell you that Metabase is starting the prometheus metrics collector and prometheus metrics web-server.
(truncated logs)
2022-09-01 17:47:38,808 INFO metabase.util :: Database setup took 3.4 s
2022-09-01 17:47:38,826 INFO metabase.core :: Setting up prometheus metrics
2022-09-01 17:47:38,827 INFO metabase.prometheus :: Starting prometheus metrics collector
2022-09-01 17:47:38,839 INFO metabase.prometheus :: Starting prometheus metrics web-server on port 9,191
(truncated logs)
You can view your locally running Metabase at http://localhost:3000.
Download and configure Prometheus
Download Prometheus, and extract the files.
Change into the Prometheus directory, add the following YAML file to configure your Prometheus:
Prometheus configuration file example
global:
  scrape_interval: 15s # By default, scrape targets every 15 seconds.

  # Attach these labels to any time series or alerts when communicating with
  # external systems (federation, remote storage, Alertmanager).
  external_labels:
    monitor: "codelab-monitor"

# A scrape configuration containing exactly one endpoint to scrape:
# Here it's Prometheus itself.
scrape_configs:
  # The job name is added as a label `job=<job_name>` to any timeseries scraped from this config.
  - job_name: "prometheus"

    # Override the global default and scrape targets from this job every 5 seconds.
    scrape_interval: 5s
    # use whatever port here that you set for MB_PROMETHEUS_SERVER_PORT
    static_configs:
      - targets: ["localhost:9191"]
You need to change the “target” to where Metabase is, for this particular example, Metabase resides in the same host where Prometheus is running (“localhost”).
Running Prometheus Locally
In a new terminal process in the Prometheus directory, run:
./prometheus --config.file=prometheus.yml
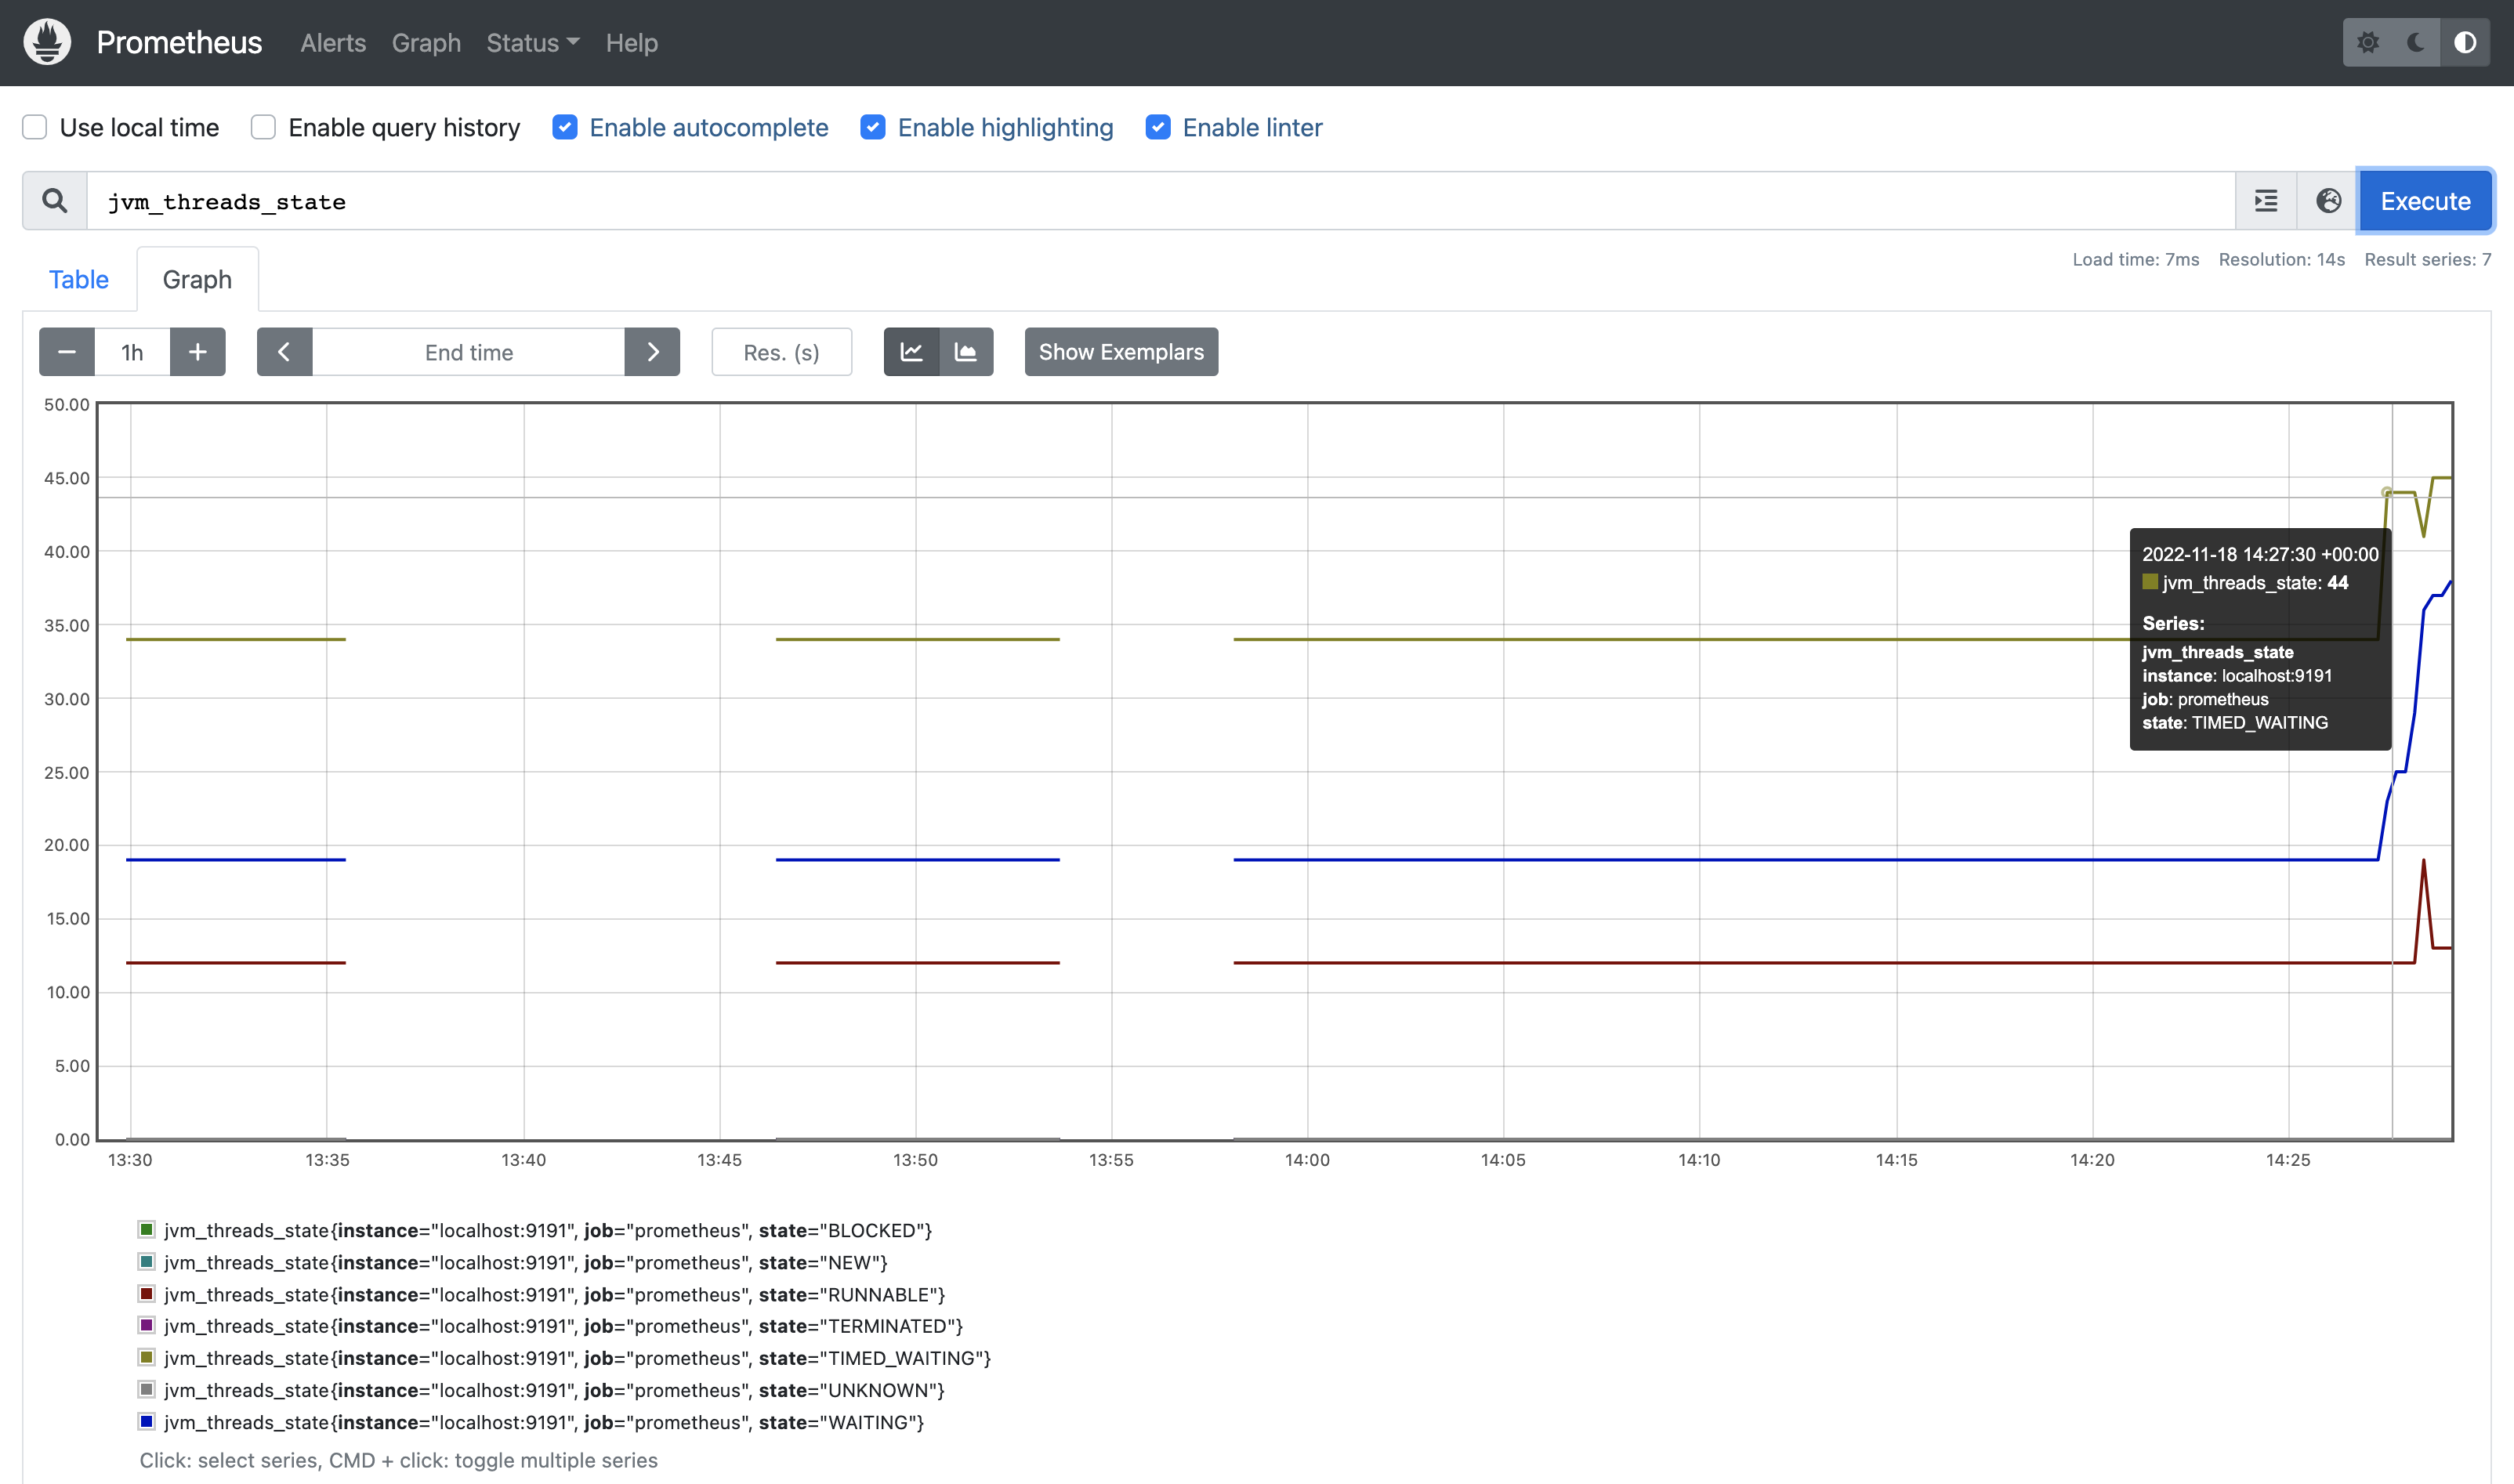
Then check http://localhost:9090. You should see the Prometheus app, and be able to search for various metrics emitted by Metabase.
Sample metrics output
Here is some sample output from Metabase:
'# HELP jvm_threads_current Current thread count of a JVM
'# TYPE jvm_threads_current gauge
jvm_threads_current 81.0
'# HELP jvm_threads_daemon Daemon thread count of a JVM
'# TYPE jvm_threads_daemon gauge
jvm_threads_daemon 36.0
'# HELP jvm_threads_peak Peak thread count of a JVM
'# TYPE jvm_threads_peak gauge
jvm_threads_peak 81.0
'# HELP jvm_threads_started_total Started thread count of a JVM
'# TYPE jvm_threads_started_total counter
jvm_threads_started_total 104.0
'# HELP jvm_threads_deadlocked Cycles of JVM-threads that are in deadlock waiting to acquire object monitors or ownable synchronizers
'# TYPE jvm_threads_deadlocked gauge
jvm_threads_deadlocked 0.0
Exported metrics
Metrics exported by Metabase include:
c3p0_max_pool_sizec3p0_min_pool_sizec3p0_num_busy_connectionsc3p0_num_connectionsc3p0_num_idle_connectionsc3p0_num_threads_awaiting_checkout_default_userjetty_async_dispatches_totaljetty_async_requests_totaljetty_async_requests_waitingjetty_async_requests_waiting_maxjetty_dispatched_activejetty_dispatched_active_maxjetty_dispatched_time_maxjetty_dispatched_time_seconds_totaljetty_dispatched_totaljetty_expires_totaljetty_request_time_max_secondsjetty_request_time_seconds_totaljetty_requests_activejetty_requests_active_maxjetty_requests_totaljetty_responses_bytes_totaljetty_responses_totaljetty_stats_secondsjvm_gc_collection_seconds_countjvm_gc_collection_seconds_sumjvm_memory_bytes_committedjvm_memory_bytes_initjvm_memory_bytes_maxjvm_memory_bytes_usedjvm_memory_objects_pending_finalizationjvm_memory_pool_bytes_committedjvm_memory_pool_bytes_initjvm_memory_pool_bytes_maxjvm_memory_pool_bytes_usedjvm_memory_pool_collection_committed_bytesjvm_memory_pool_collection_init_bytesjvm_memory_pool_collection_max_bytesjvm_memory_pool_collection_used_bytesjvm_threads_currentjvm_threads_daemonjvm_threads_deadlockedjvm_threads_deadlocked_monitorjvm_threads_peakjvm_threads_started_totaljvm_threads_stateprocess_cpu_seconds_totalprocess_max_fdsprocess_open_fdsprocess_start_time_secondsprocess_virtual_memory_bytesmetabase_email_messages_totalmetabase_email_messages_createdmetabase_email_message_errors_totalmetabase_email_message_errors_createdmetabase_security_center_last_sync_timestamp_secondsmetabase_security_center_vulnerable_advisories
Further reading
Read docs for other versions of Metabase.