Sharing and publishing data

Dashboards

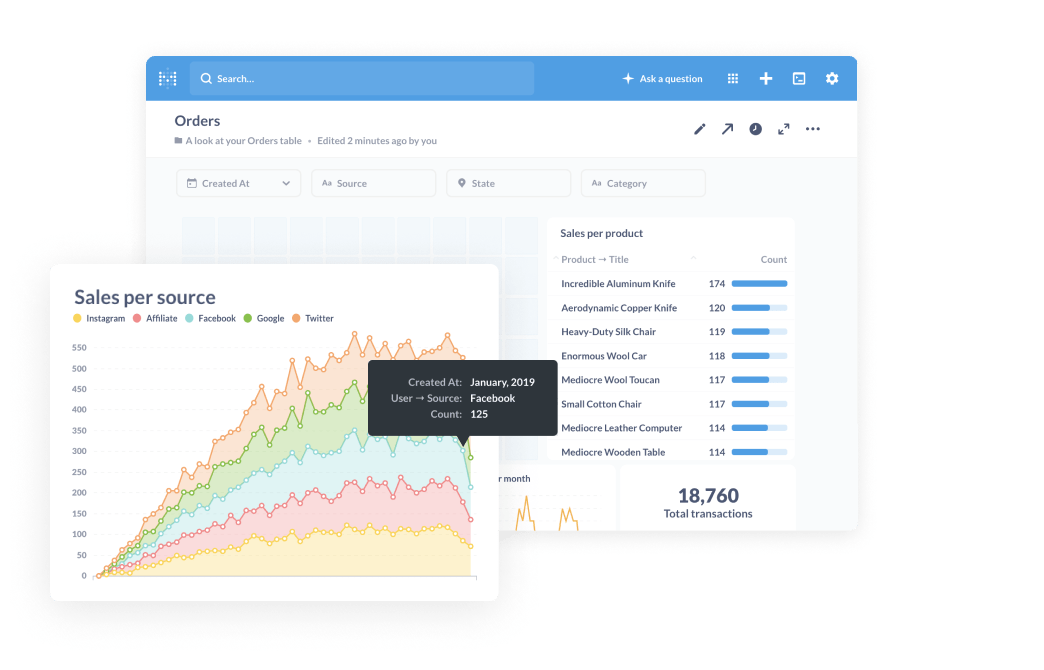
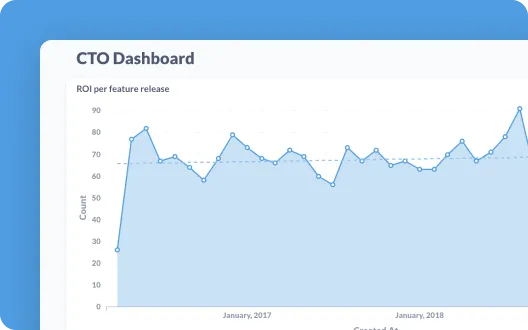
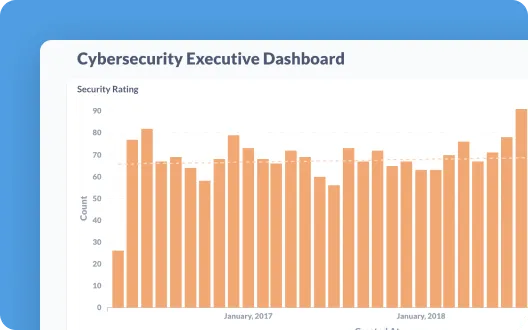
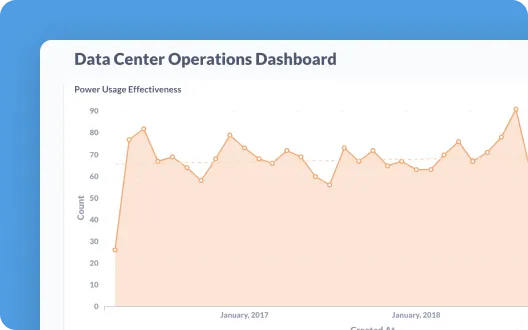
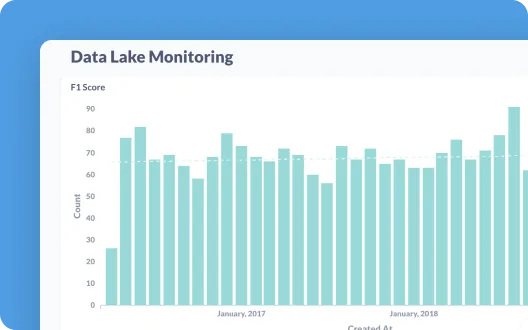
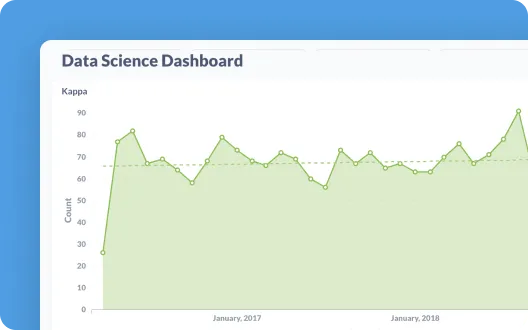
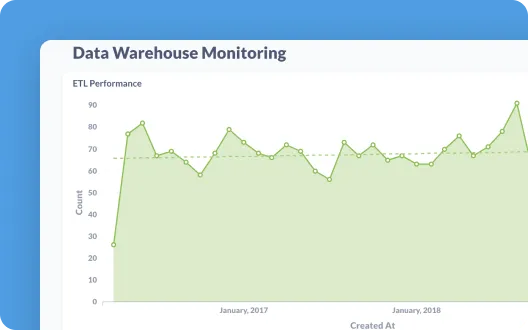
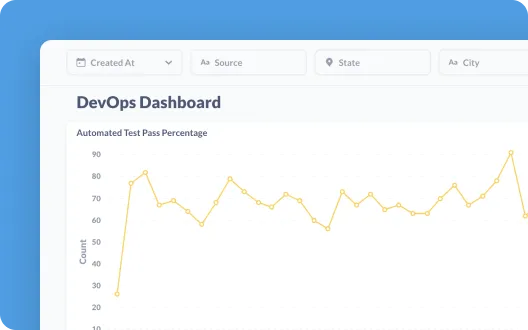
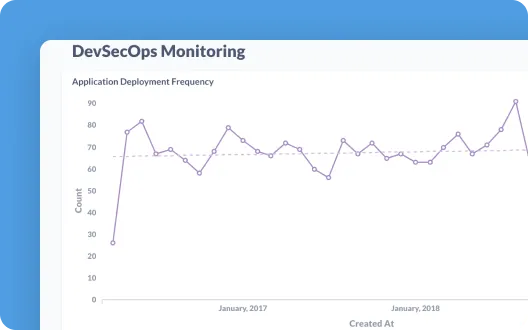
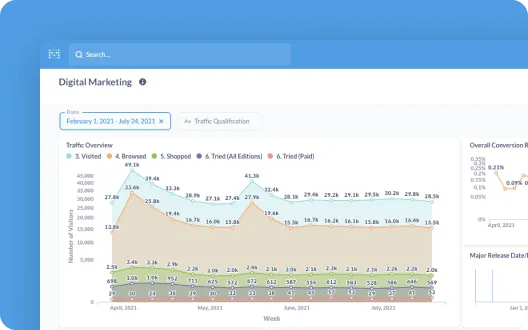
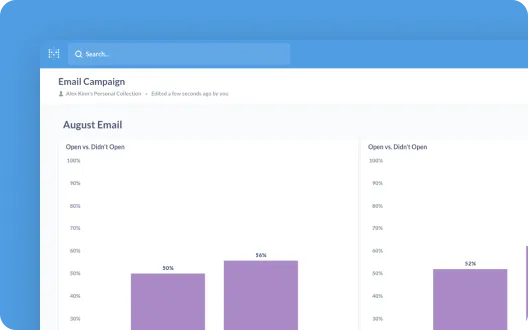
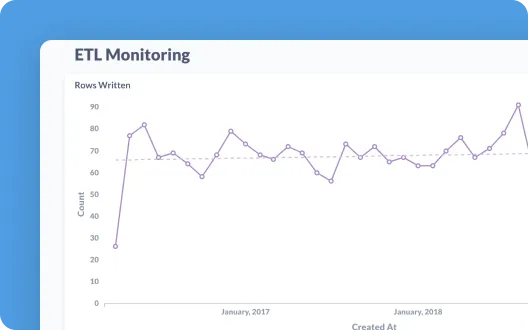
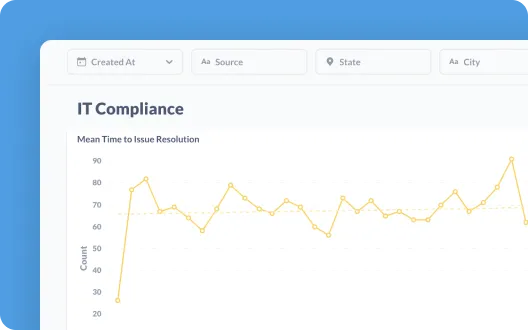
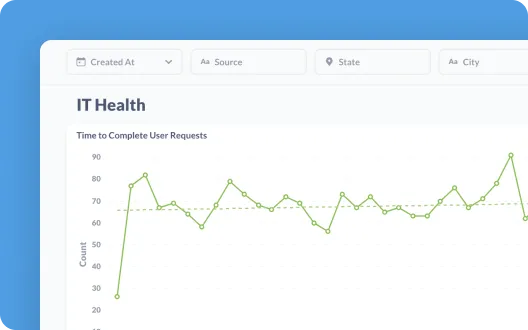
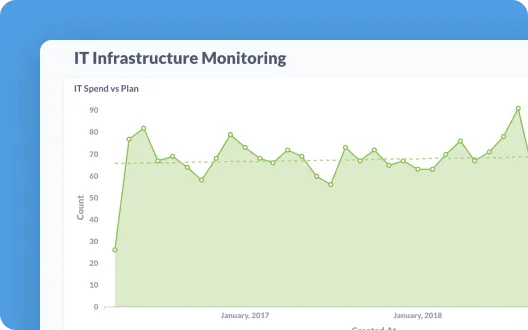
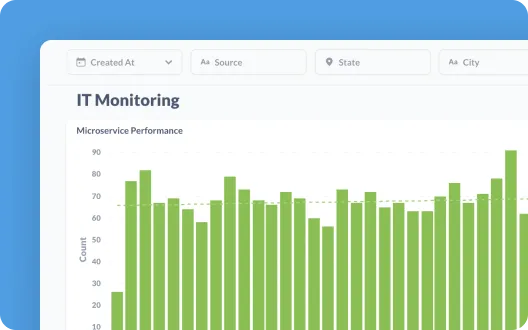
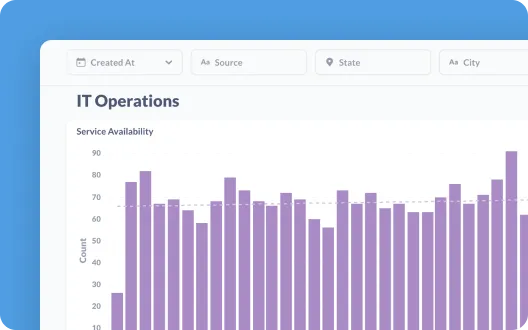
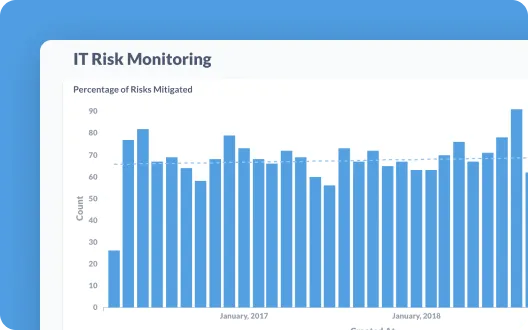
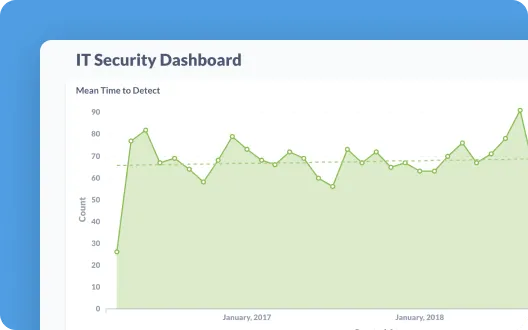
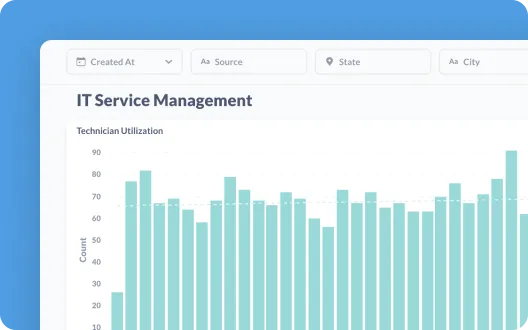
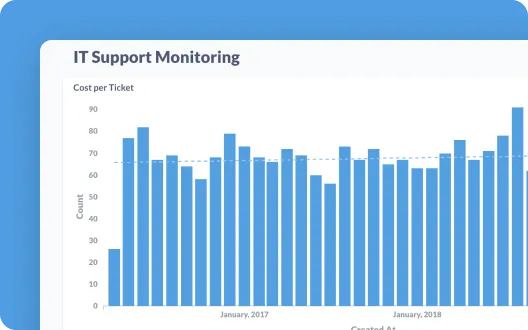
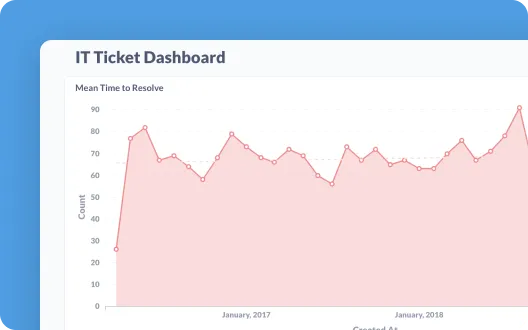
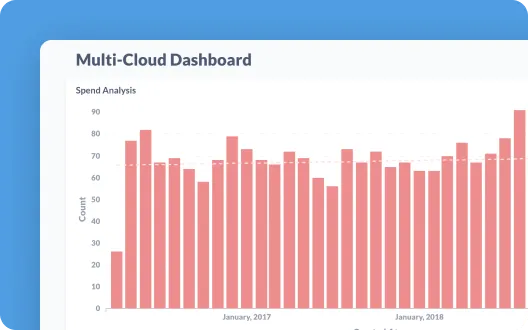
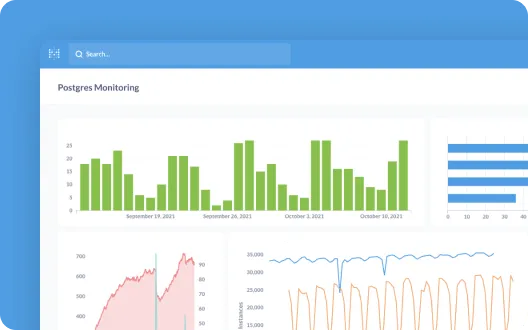
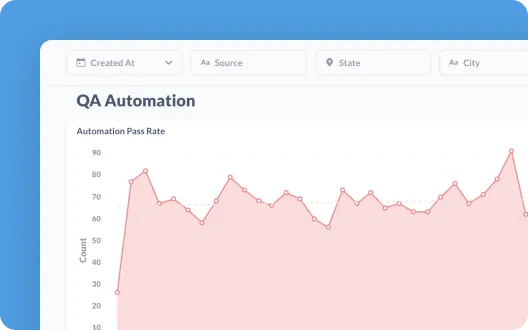
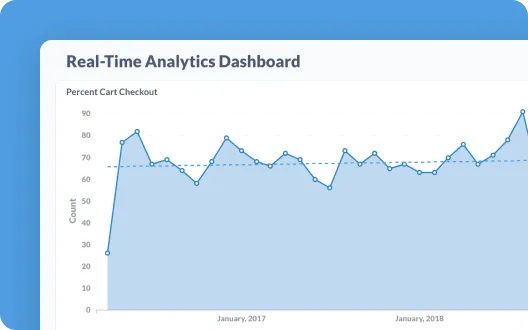
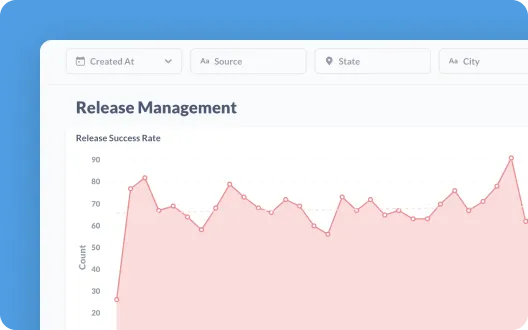
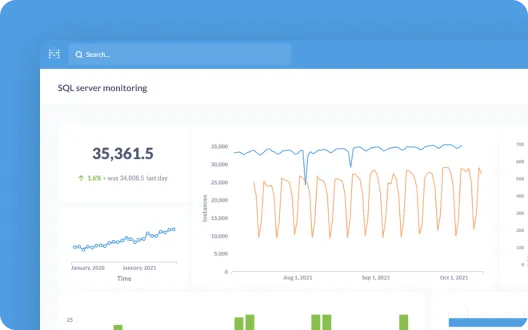
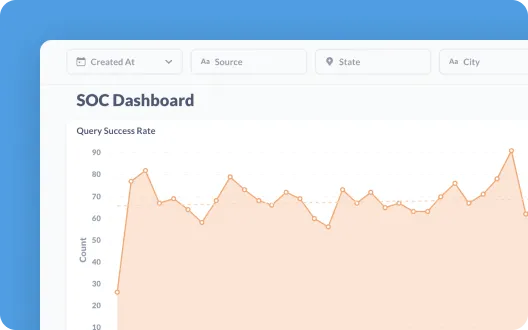
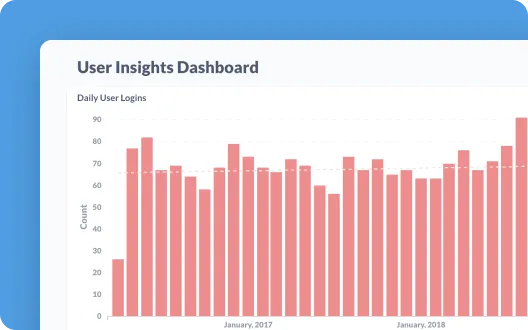
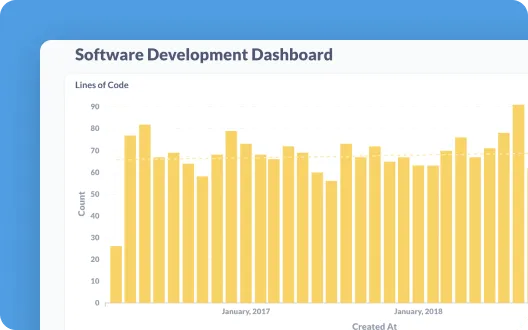
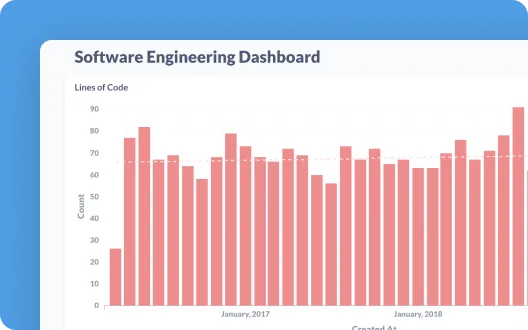
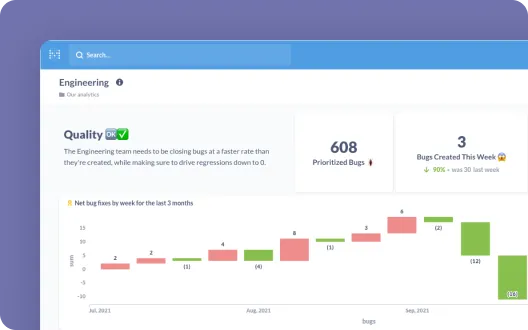
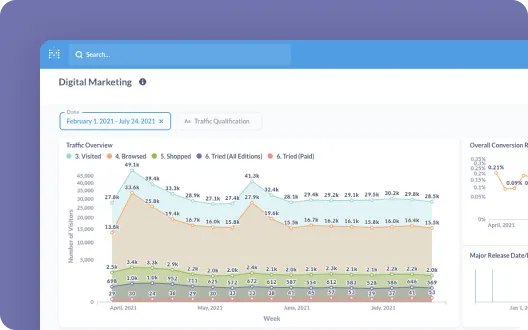
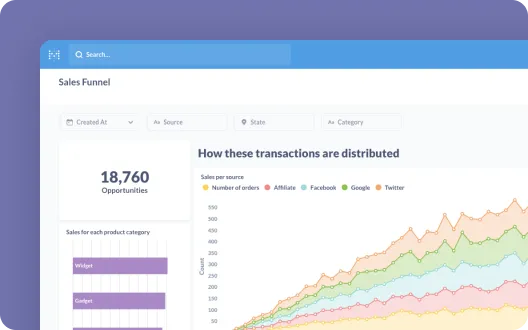
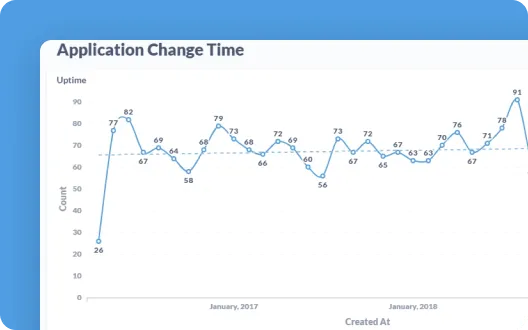
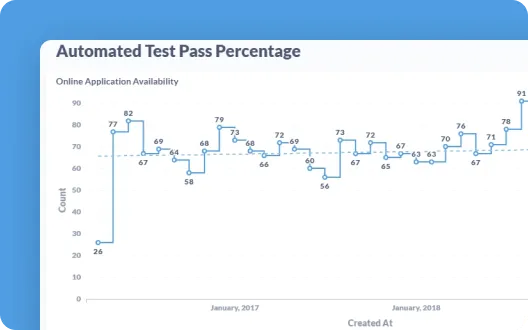
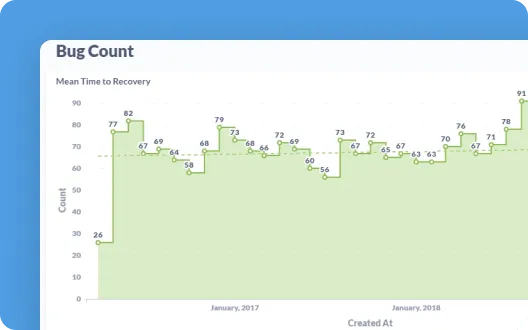
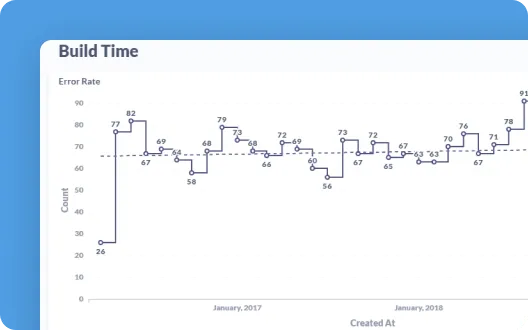
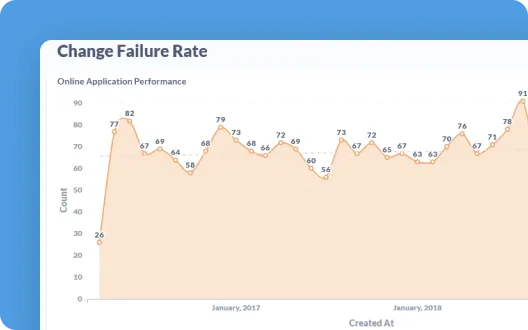
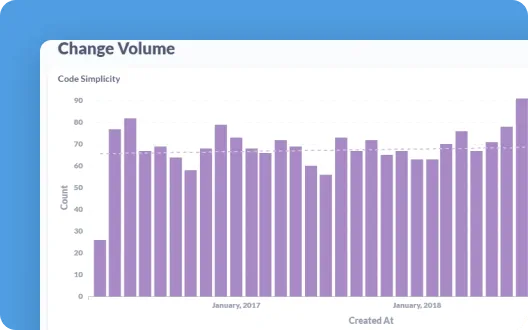
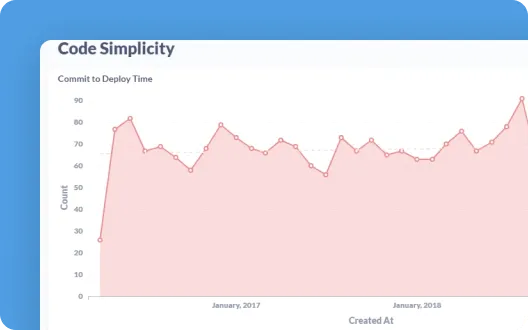
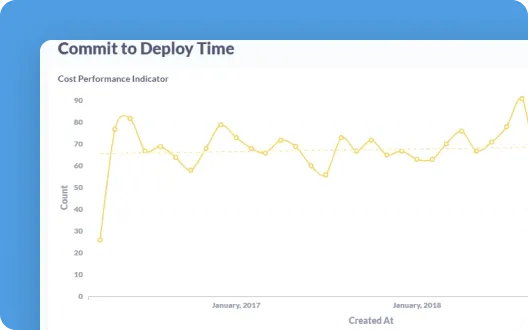
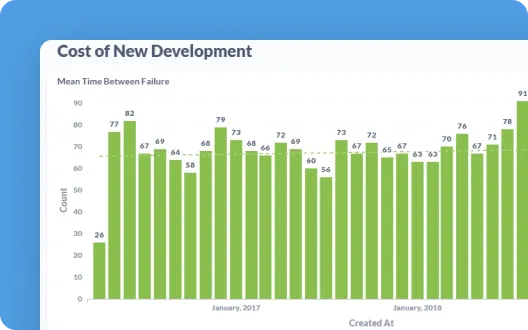
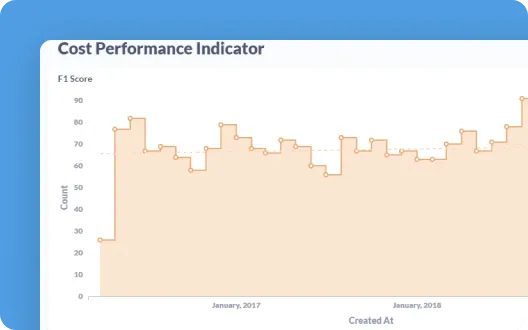
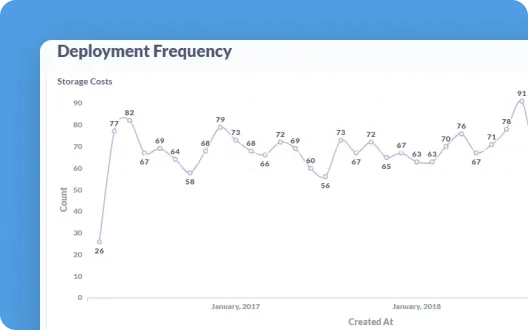
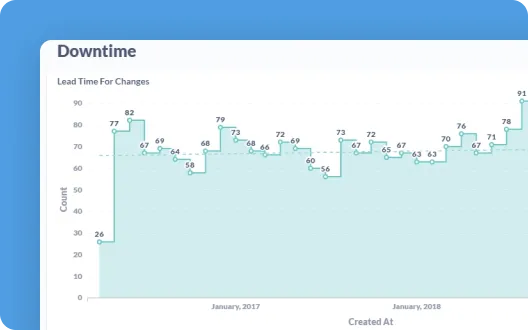
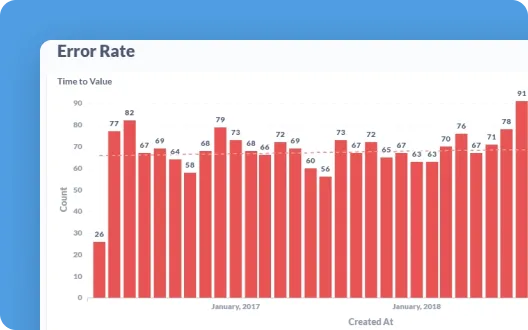
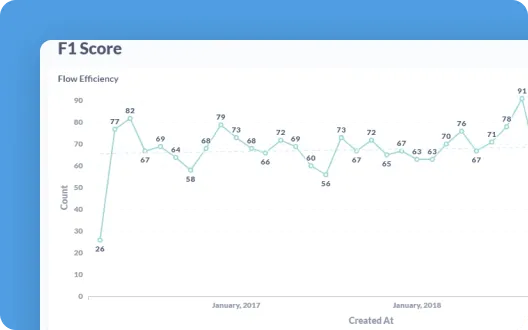
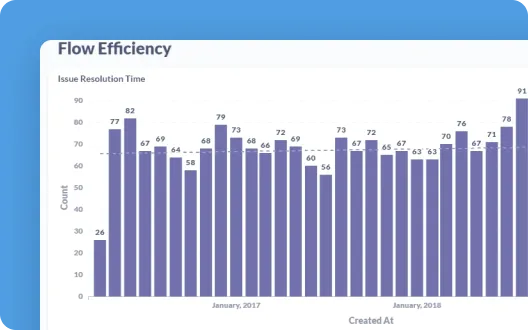
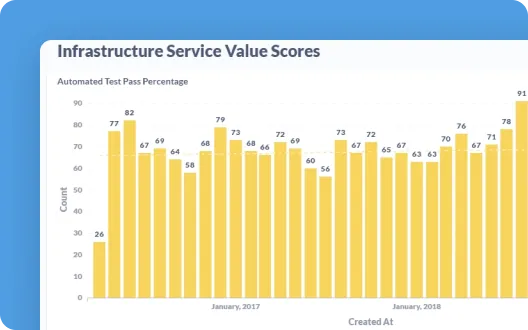
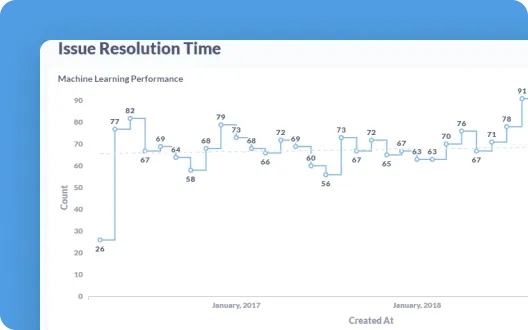
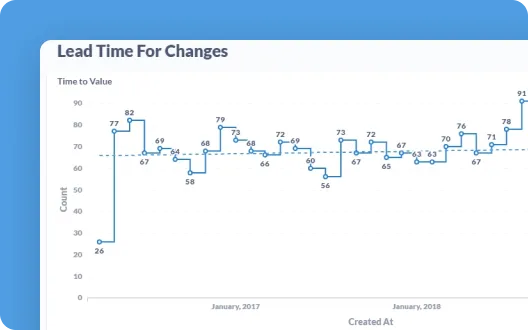
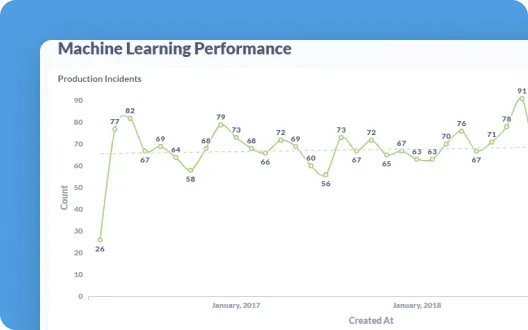
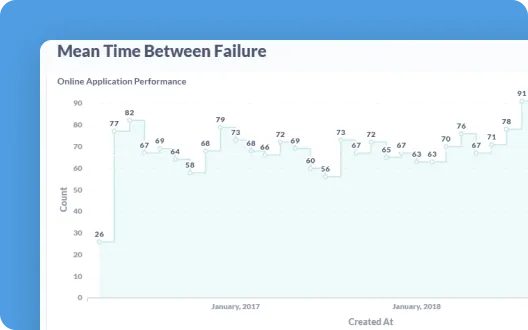
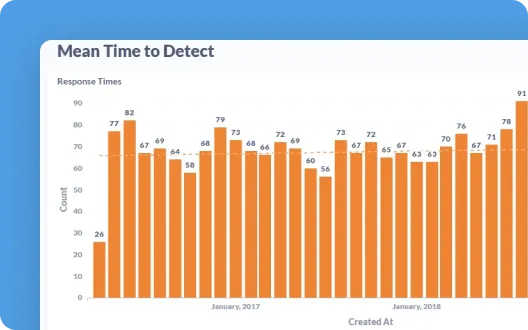
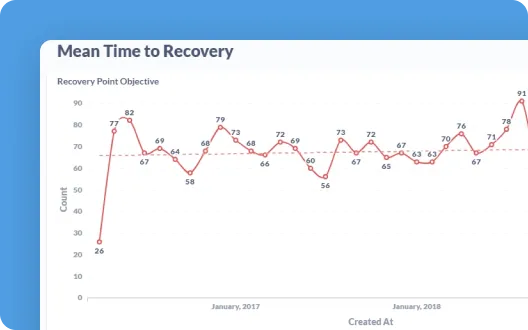
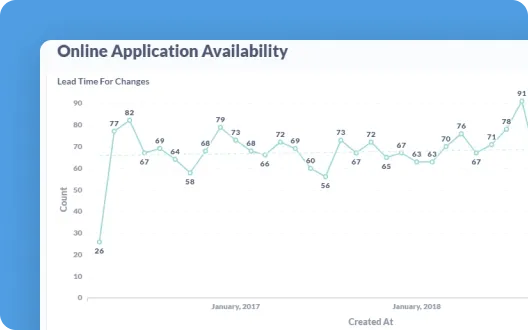
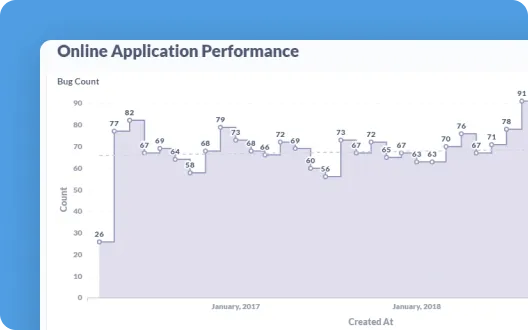
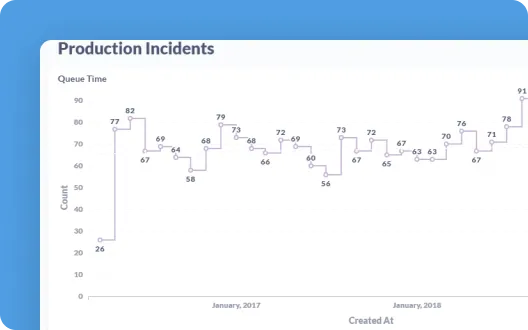
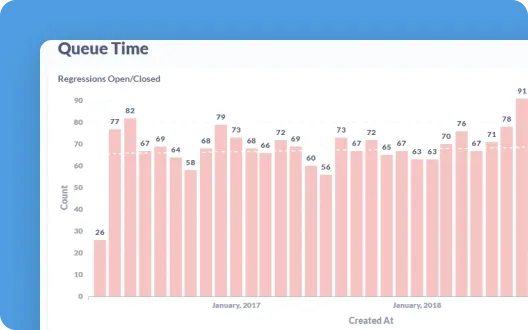
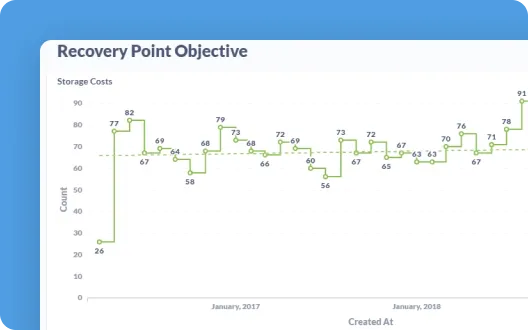
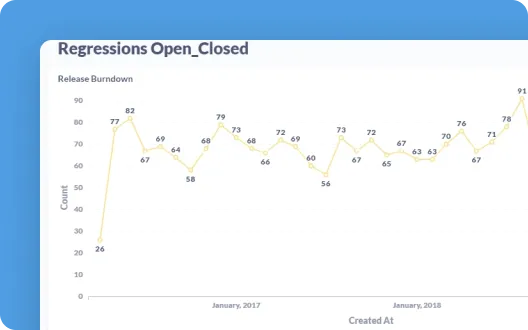
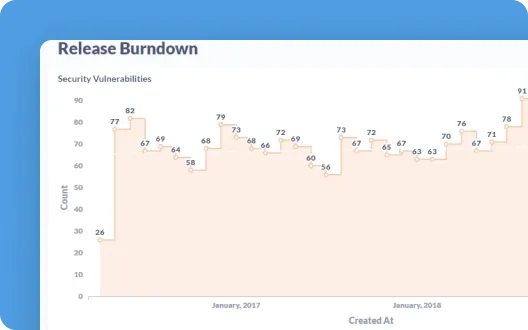
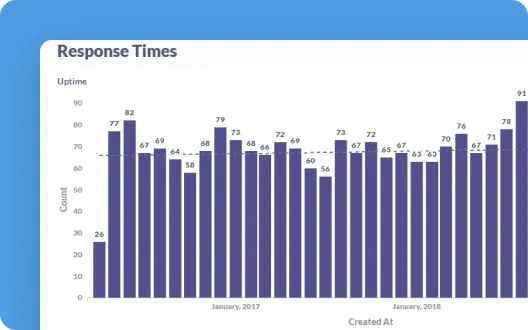
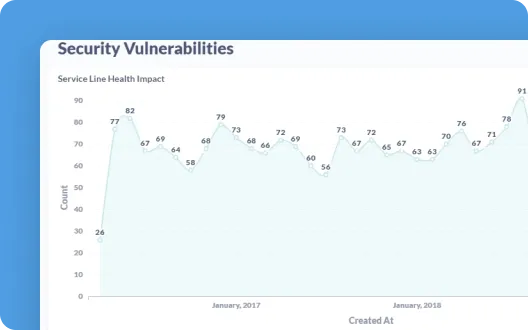
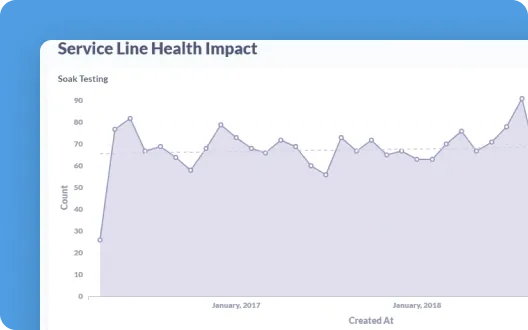
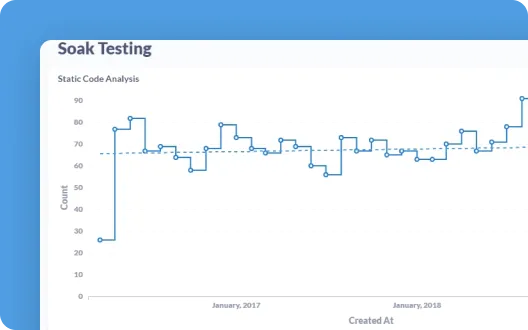
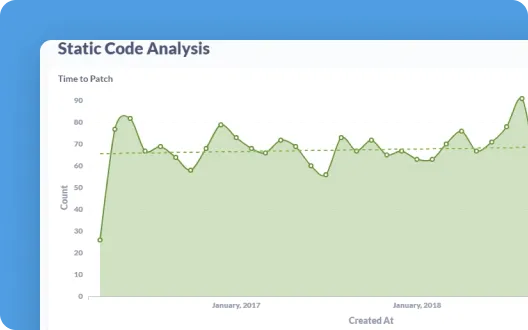
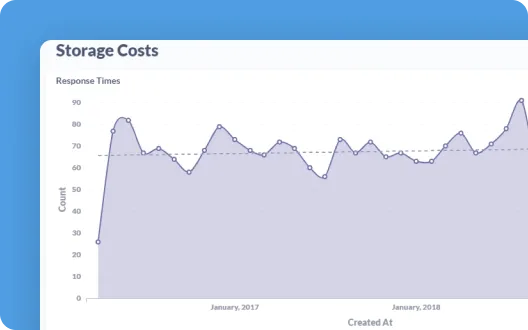
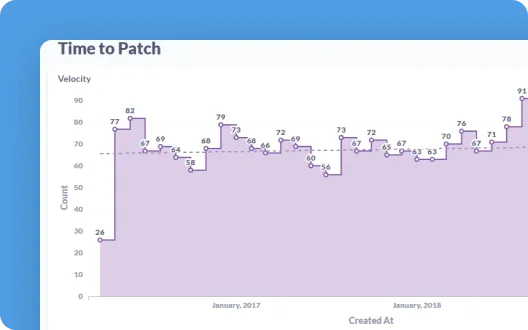
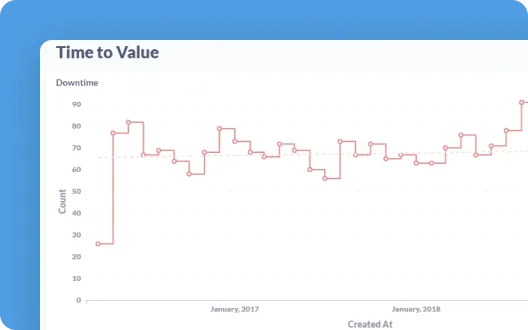
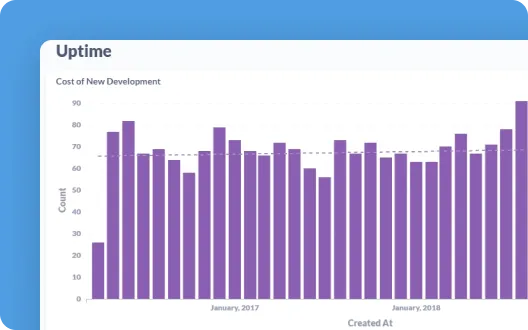
Dashboards make it easy to collect and publish live data in an interactive, explorable format.

Graph of sales per source

Explore example dashboards

Get started

application monitoring

Explore dashboard
Get started

AWS monitoring

Explore dashboard
Get started

Content Marketing

Explore dashboard
Get started

cybersecurity executive

Explore dashboard
Get started

Data Center Operations

Explore dashboard
Get started

Data Science

Explore dashboard
Get started

Data Warehouse

Explore dashboard
Get started

Digital Marketing

Explore dashboard
Get started

Email Marketing

Explore dashboard
Get started

ETL Monitoring

Explore dashboard
Get started

IT compliance

Explore dashboard
Get started

IT Infrastructure

Explore dashboard
Get started

IT monitoring

Explore dashboard
Get started

IT operations

Explore dashboard
Get started

IT Security

Explore dashboard
Get started

IT service management

Explore dashboard
Get started

IT Support

Explore dashboard
Get started

It Ticket Dashboard

Explore dashboard
Get started

Multi-Cloud

Explore dashboard
Get started

PostgreSQL

Explore dashboard
Get started

QA automation

Explore dashboard
Get started

Real Time Analytics

Explore dashboard
Get started

Release management

Explore dashboard
Get started

Sales activity

Explore dashboard
Get started

Sales forecasting

Explore dashboard
Get started

Sales Pipeline

Explore dashboard
Get started

SQL Server Monitoring

Explore dashboard
Get started

Software Development Dashboard

Explore dashboard
Get started

Software Engineering

Explore dashboard

Dashboards for teams

Get started

Engineering Teams

Explore dashboard
Get started

Marketing Teams

Explore dashboard
Get started

Sales Teams

Explore dashboard

Dashboards for measuring KPIs

Get started

Application Change Time

Explore dashboard
Get started

Automated Test Pass Percentage

Explore dashboard
Get started

Build Time

Explore dashboard
Get started

Change Failure Rate

Explore dashboard
Get started

Change Volume

Explore dashboard
Get started

Code Simplicity

Explore dashboard
Get started

Commit to Deploy Time

Explore dashboard
Get started

Cost of New Development

Explore dashboard
Get started

Cost Performance Indicator

Explore dashboard
Get started

Deployment Frequency

Explore dashboard
Get started

Error Rate

Explore dashboard
Get started

Flow Efficiency

Explore dashboard
Get started

Infrastructure Service Value Scores

Explore dashboard
Get started

Issue Resolution Time

Explore dashboard
Get started

Lead Time For Changes

Explore dashboard
Get started

Machine Learning Performance

Explore dashboard
Get started

Mean Time Between Failure

Explore dashboard
Get started

Mean Time to Detect

Explore dashboard
Get started

Mean Time to Recovery

Explore dashboard
Get started

Online Application Availability

Explore dashboard
Get started

Online Application Performance

Explore dashboard
Get started

Production Incidents

Explore dashboard
Get started

Queue Time

Explore dashboard
Get started

Recovery Point Objective

Explore dashboard
Get started

Regressions Open_Closed

Explore dashboard
Get started

Release Burndown

Explore dashboard
Get started

Response Times

Explore dashboard
Get started

Security Vulnerabilities

Explore dashboard
Get started

Service Line Health Impact

Explore dashboard
Get started

Soak Testing

Explore dashboard
Get started

Static Code Analysis

Explore dashboard
Get started

Storage Costs

Explore dashboard
Get started

Time to Patch

Explore dashboard
Get started

Time to Value

Explore dashboard

Get started with Metabase

  • Free, no-commitment trial
  • Easy for everyone—no SQL required
  • Up and running in 5 minutes