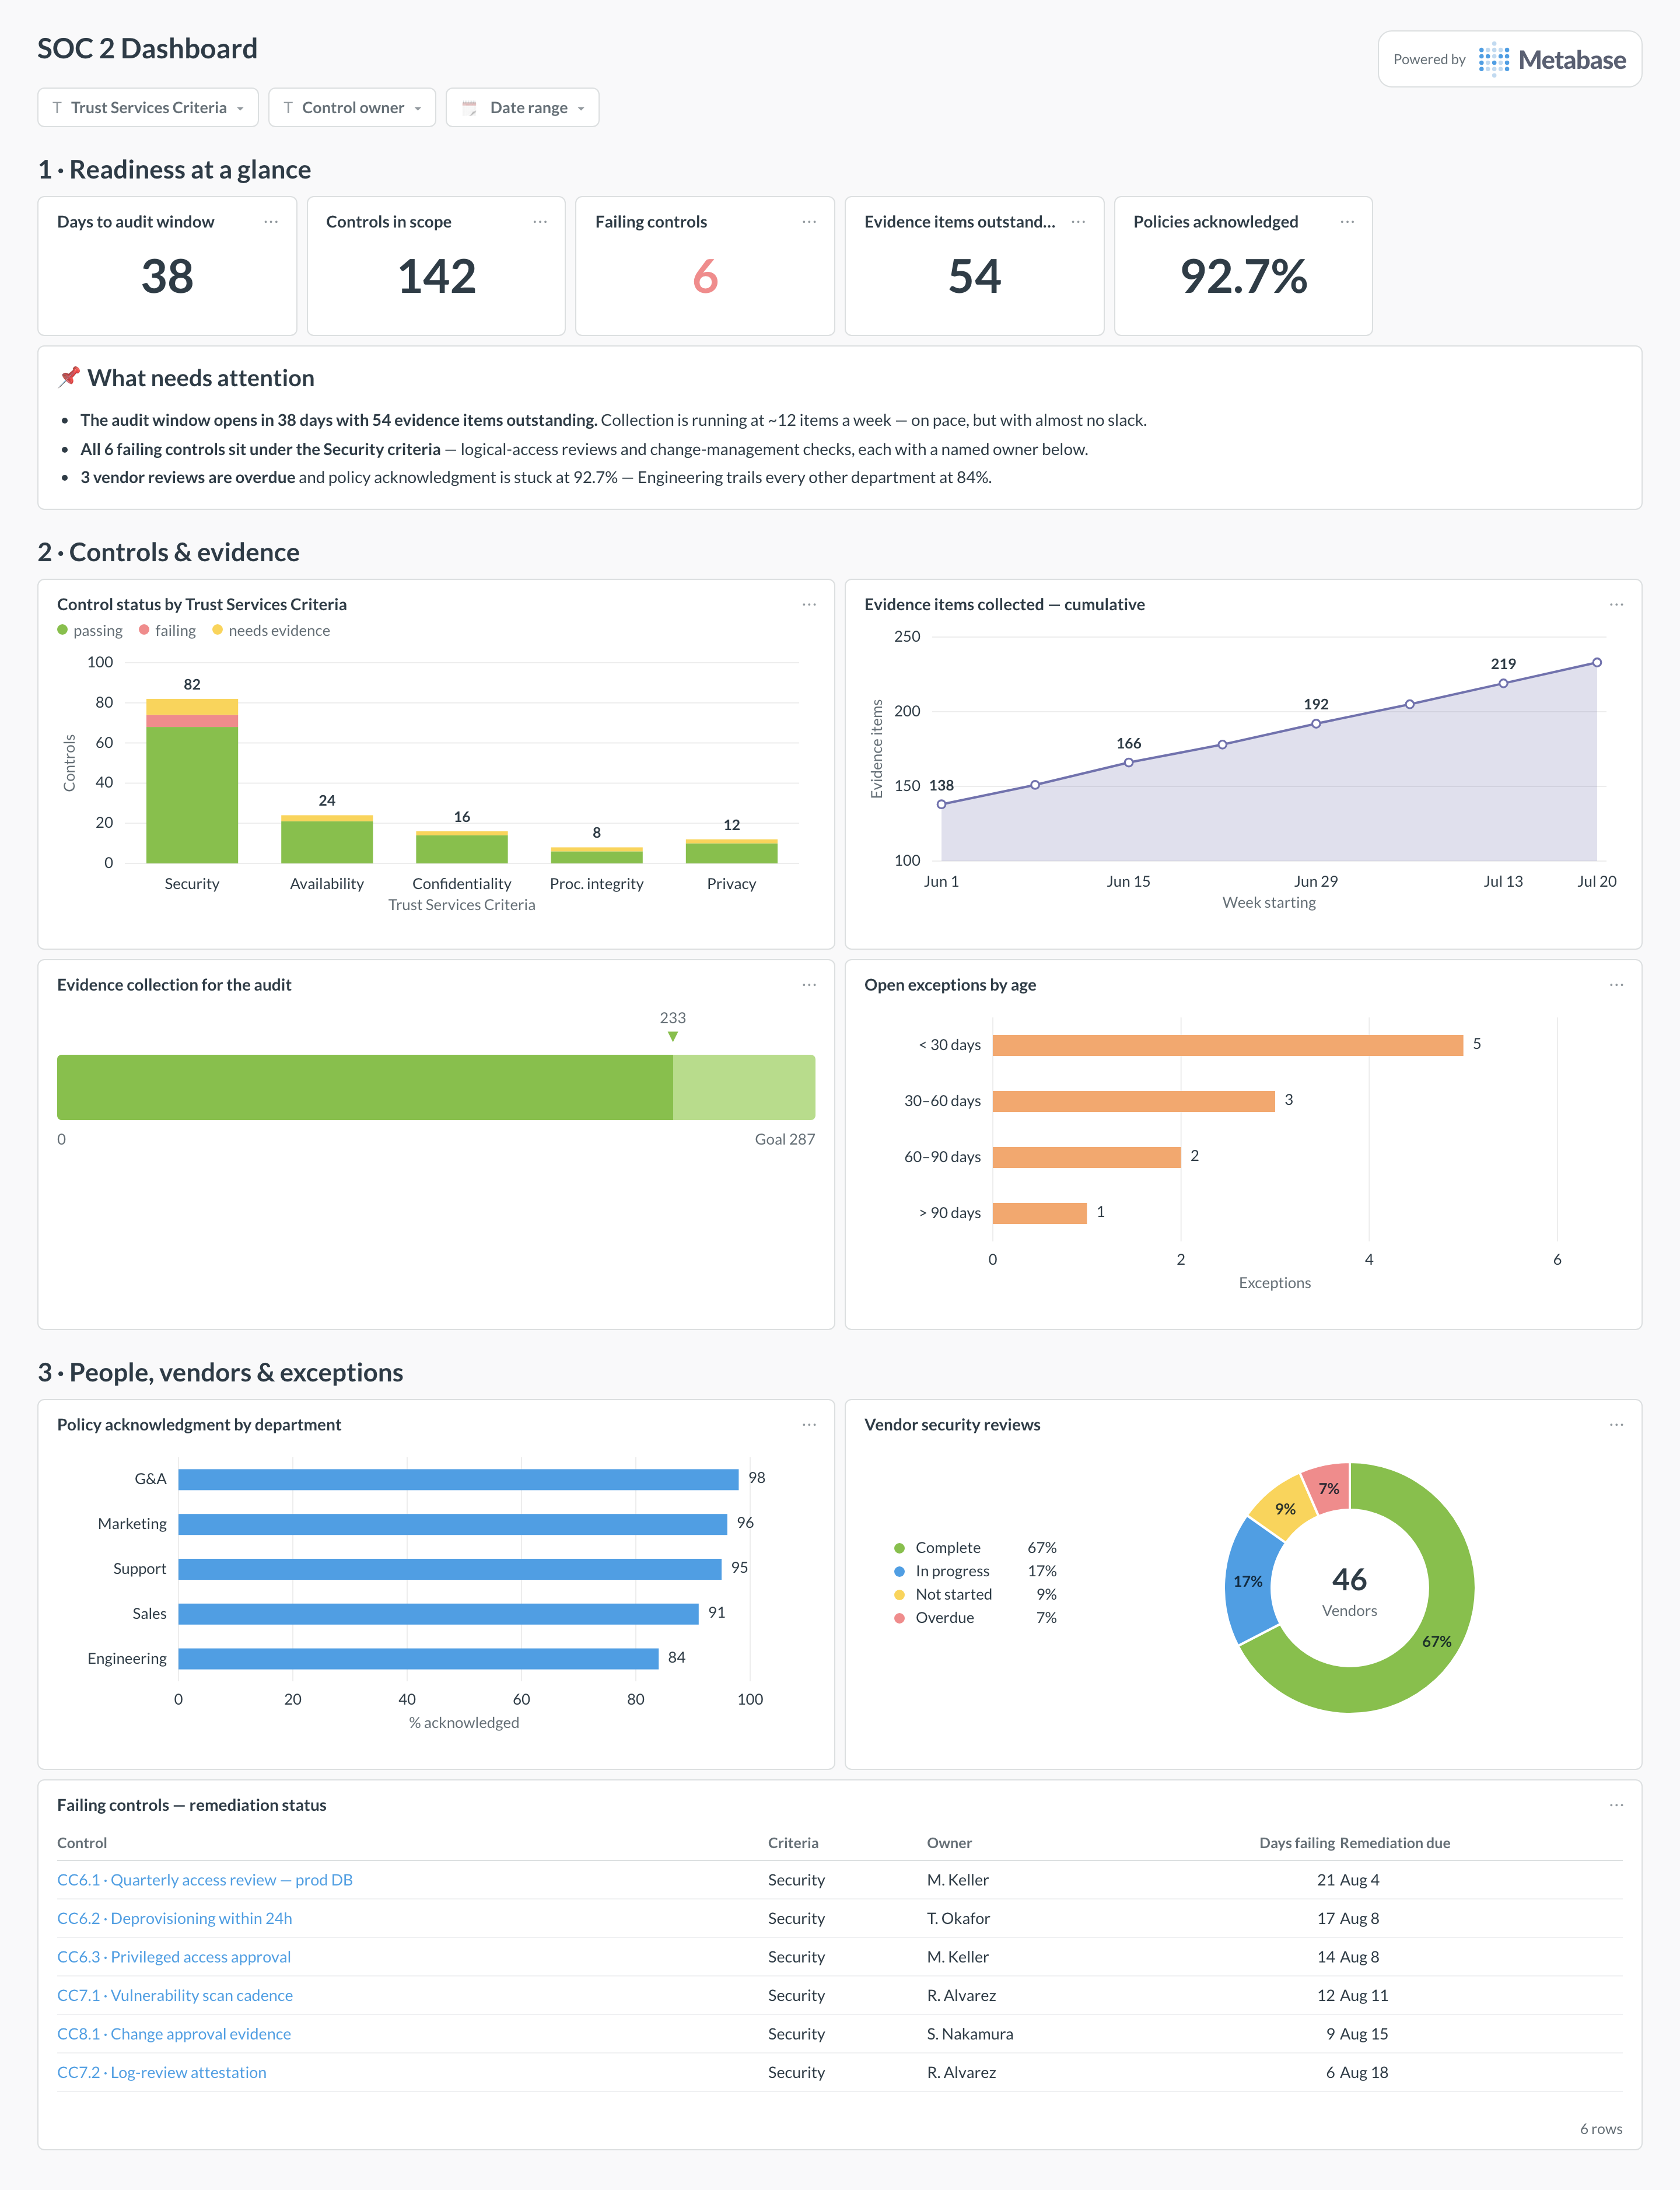
A SOC 2 dashboard tracks readiness for one specific audit: control status grouped by Trust Services Criteria, evidence collection racing the audit window, policy acknowledgment, vendor reviews, and exception aging. It's narrower and more time-boxed than the multi-framework compliance posture dashboard — this page is about walking into the audit window with nothing outstanding. Metabase builds it from your GRC platform's API or a controls table in the warehouse.
For: compliance leads, security engineers, and the executives sponsoring the audit. Grain: one row per control, evidence request, or policy acknowledgment. Refresh: daily — the countdown does the urgency for you.
What does a SOC 2 dashboard look like?
Here’s the layout this guide builds. The readiness row leads with the audit-window countdown and the outstanding-evidence count, because those two numbers set the tone for everything else; controls and evidence follow, grouped by Trust Services Criteria with the cumulative collection pace; the bottom section covers the human and third-party checks — policy acknowledgment, vendor reviews — and ends in the failing-controls table with owners and remediation dates.
An example SOC 2 dashboard in Metabase, built from GRC-platform data synced to a warehouse. Figures are illustrative.
Which cards belong on a SOC 2 dashboard?
The eight below cover what the audit will actually test: control operation, evidence across the period, the people and vendors in scope, and the gaps you already know about.
Days to audit window — the countdown that gives every other card a deadline (number)
Control status by Trust Services Criteria — passing, failing, needs evidence per criteria (stacked bar)
Evidence collection for the audit — items collected against the total required (progress)
Evidence items collected — cumulative — weekly pace toward the window (area)
Policy acknowledgment by department — % of staff acknowledged, worst last (row)
Vendor security reviews — complete, in progress, not started, overdue (donut)
Open exceptions by age — under 30 through over 90 days (row)
Failing controls — the remediation worklist with criteria, owner, and due date (table)
What data does the dashboard need?
A soc2_controls table — control, mapped criteria, owner, status — from your GRC platform’s API or maintained by hand.
evidence_requests with control_id, due_at, collected_at, and owner — the progress and pace cards both read from it.
An audit_periods table holding the observation window and window_opens_at, so the countdown is data, not a sticky note.
Policy acknowledgment records joined to HR headcount per department — the denominator matters as much as the numerator.
A vendor_reviews table with vendor, tier, due_at, and completed_at; plus an exceptions table with opened_at for aging.
How do you build it?
Sync control and evidence state from your GRC platform daily via its API — or maintain the tables directly in the warehouse if you run the program without one.
Anchor everything to the audit period: store the window dates once and derive the countdown, evidence due dates, and “in period” flags from that row.
Group controls by Trust Services Criteria for the stacked card, and keep a three-state status — passing, failing, needs evidence — so “green” can’t hide an un-evidenced control.
Chart evidence collection cumulatively against the required total; the slope against the countdown is the single most useful read on the page.
Add filters for criteria, control owner, and date range, and send the failing-controls table to owners weekly — with the countdown number in the subject line.
Example card SQL
Control status and outstanding evidence by Trust Services CriteriaPostgreSQL
SELECT
c.criteria,                          -- Security, Availability, …
COUNT(*)                                          AS controls_in_scope,
COUNT(*) FILTER (WHERE c.status = 'passing')      AS passing,
COUNT(*) FILTER (WHERE c.status = 'failing')      AS failing,
COUNT(*) FILTER (WHERE c.status = 'needs_evidence')
                                                  AS needs_evidence,
COUNT(e.evidence_id) FILTER (
  WHERE e.collected_at IS NULL
    AND e.due_at <= a.window_opens_at
)                                                 AS evidence_outstanding,
MIN(a.window_opens_at) - CURRENT_DATE             AS days_to_audit_window
FROM soc2_controls c
JOIN audit_periods a
ON a.audit_id = c.audit_id AND a.is_current
LEFT JOIN evidence_requests e
ON e.control_id = c.control_id AND e.audit_id = c.audit_id
GROUP BY c.criteria
ORDER BY controls_in_scope DESC;
How is a SOC 2 dashboard different from a compliance posture dashboard?
Scope and clock. A compliance posture dashboard is the always-on, multi-framework view — control pass rates across SOC 2, ISO, and HIPAA from your security platform's monitors. A SOC 2 dashboard is aimed at one audit: controls grouped by Trust Services Criteria, evidence collection racing a dated audit window, policy acknowledgment, and vendor reviews an auditor will sample. When the audit ends, this dashboard resets for the next period; the posture view never stops. Run both rather than stretching one to do the other's job.
What changes between a Type I and a Type II report?
Type I says the controls were designed properly at a point in time; Type II says they operated across an observation period, usually 6–12 months. For the dashboard, that changes everything about evidence: a Type II auditor samples across the whole window, so evidence must exist for February even though the audit happens in October. That's why the cumulative-collection chart matters more than any point-in-time number — a gap in the period is a gap in the report, and no end-of-window scramble can backfill an access review that simply didn't happen in Q1.
Do we need all five Trust Services Criteria on the dashboard?
Only the ones in scope. Security (the Common Criteria) is mandatory in every SOC 2; Availability, Confidentiality, Processing Integrity, and Privacy are opt-in, and most first audits scope Security plus one or two others that customers actually ask about. Keep the stacked-by-criteria card to the criteria in your report — charting Privacy controls you haven't scoped just invites questions. If you're deciding what to add, Availability is the usual second pick for SaaS, and its evidence (uptime, incident records, DR tests) is data you likely already have.
How do we keep evidence collection from becoming a scramble?
Turn it into a rate problem the dashboard can watch. Every evidence request gets a due date derived from the audit window; the cumulative-collected line then has a required pace, and "54 items outstanding with 38 days to go" is a calm, checkable statement instead of a panic. Two practices keep it honest: assign every item an owner the week the audit period opens, and mark evidence that must be generated during the period (quarterly access reviews, restore tests) on a calendar, because those can't be produced retroactively no matter how fast you collect.
We use Drata (or Vanta). Why build this in Metabase?
The platform is the collector; the dashboard is the join. Drata and Vanta run the monitors and store the evidence, but their dashboards stop at their own data. In Metabase you can put control status next to the systems the controls govern — deprovisioning lag from Okta, vulnerability-scan cadence from your scanner, uptime against the Availability criteria — and give executives an audit-countdown view without buying them GRC seats. Both platforms expose this state through their APIs, so the sync is a scheduled pull, not a re-keying exercise.
What counts as an exception, and why chart its age?
In SOC 2 terms, an exception is a deviation the auditor notes when a sampled control didn't operate as described — and in your own tracking, it's any accepted gap awaiting remediation or formal risk acceptance. Age is the signal that matters: an exception opened three weeks before the audit reads as an active program catching its own issues, while one that's been open for six months reads as management ignoring a known failure. The aging chart (under 30 through over 90 days) makes that distinction visible before the auditor makes it for you.
How should we handle policy acknowledgment?
Track it by department, not just as one number, and start the clock early. The overall 92.7% hides the story — Engineering at 84% is where the auditor's sample will find un-acknowledged policies. Wire the dashboard to your HR or IdP data so new hires appear in the denominator on day one, set acknowledgment as an onboarding task rather than an annual campaign, and give the laggard-department view to managers monthly. The goal is boring: by the time the audit window opens, the card should have been green for a quarter.