‧
11 min read
10 B2B SaaS product metrics that should be on your dashboard
Tanya Aulachynskaya
‧ 11 min read
Share this article
For SaaS teams, product metrics are the backbone of decision-making. This guide walks through the core metrics every product and data team should track: conversion, activation, retention, churn, and NDR-showing how to define each one in SQL, calculate it correctly, and visualize results in Metabase.
Website to signup conversion rate
Why it matters: Shows how well your website turns visitors into potential customers.
How to build: Divide number of people who signed up to number of unique visitors and group by date (e.g. week/month).
Bonus points: if your signup flow has several steps, calculate conversion rate into each step and display as a set of line charts
Signups segmentation
Why it matters: Shows which marketing channels bring you most customers and which are growing faster.
How to build: Group signups by marketing_channel or another attribution parameters that you have.
Traffic quality (aka signups quality, share of ICP signups, share of high quality signups, share of MQLs)
Why it matters: Not all signups are equal, and you should be monitoring what kind of users you are acquiring. Sudden spikes in traffic quality might influence a lot of metrics down the funnel.
How to build: The quality of signups is usually defined by the marketing and product team together, historically looking at easy to define qualities of a signup.
Those could be, for B2B: share of signups with business domain, share of signups from a specific country or a list of countries. Calculate the % of ICP signups over the total number of signups and group by week or month.
Activation rate
Why it matters: Activation rate is the most important metric every product manager should watch.
Activation rate is a share of new signups that reached the point where they understand your product’s value and are taking meaningful actions.
There’re 3 key things about a well defined activation metric. It should:
- Be easily measurable and represent value
- Correlate with conversion well
- Show result in a 2-3 day window after signup (great if you can do it in a 1-day window).
How to define and validate activation rate metrics
List hypotheses
Very likely you can name 1-2-5 actions that users should perform in your product in order to signal that they understood what it is about. For example in Metabase, likely users understood how to use the product if they were able to build a nice chart from their data. Make a list of activation metric hypotheses in the format:
Performed X events in Y days after signup, Y<3
Examples:
New user should get 7 friends in 10 days (Facebook)
Sent 1 document within 2 days after trial start (PandaDoc)
User executes 100 queries OR invites > 1 user within 3 days (Metabase)
Find correlations
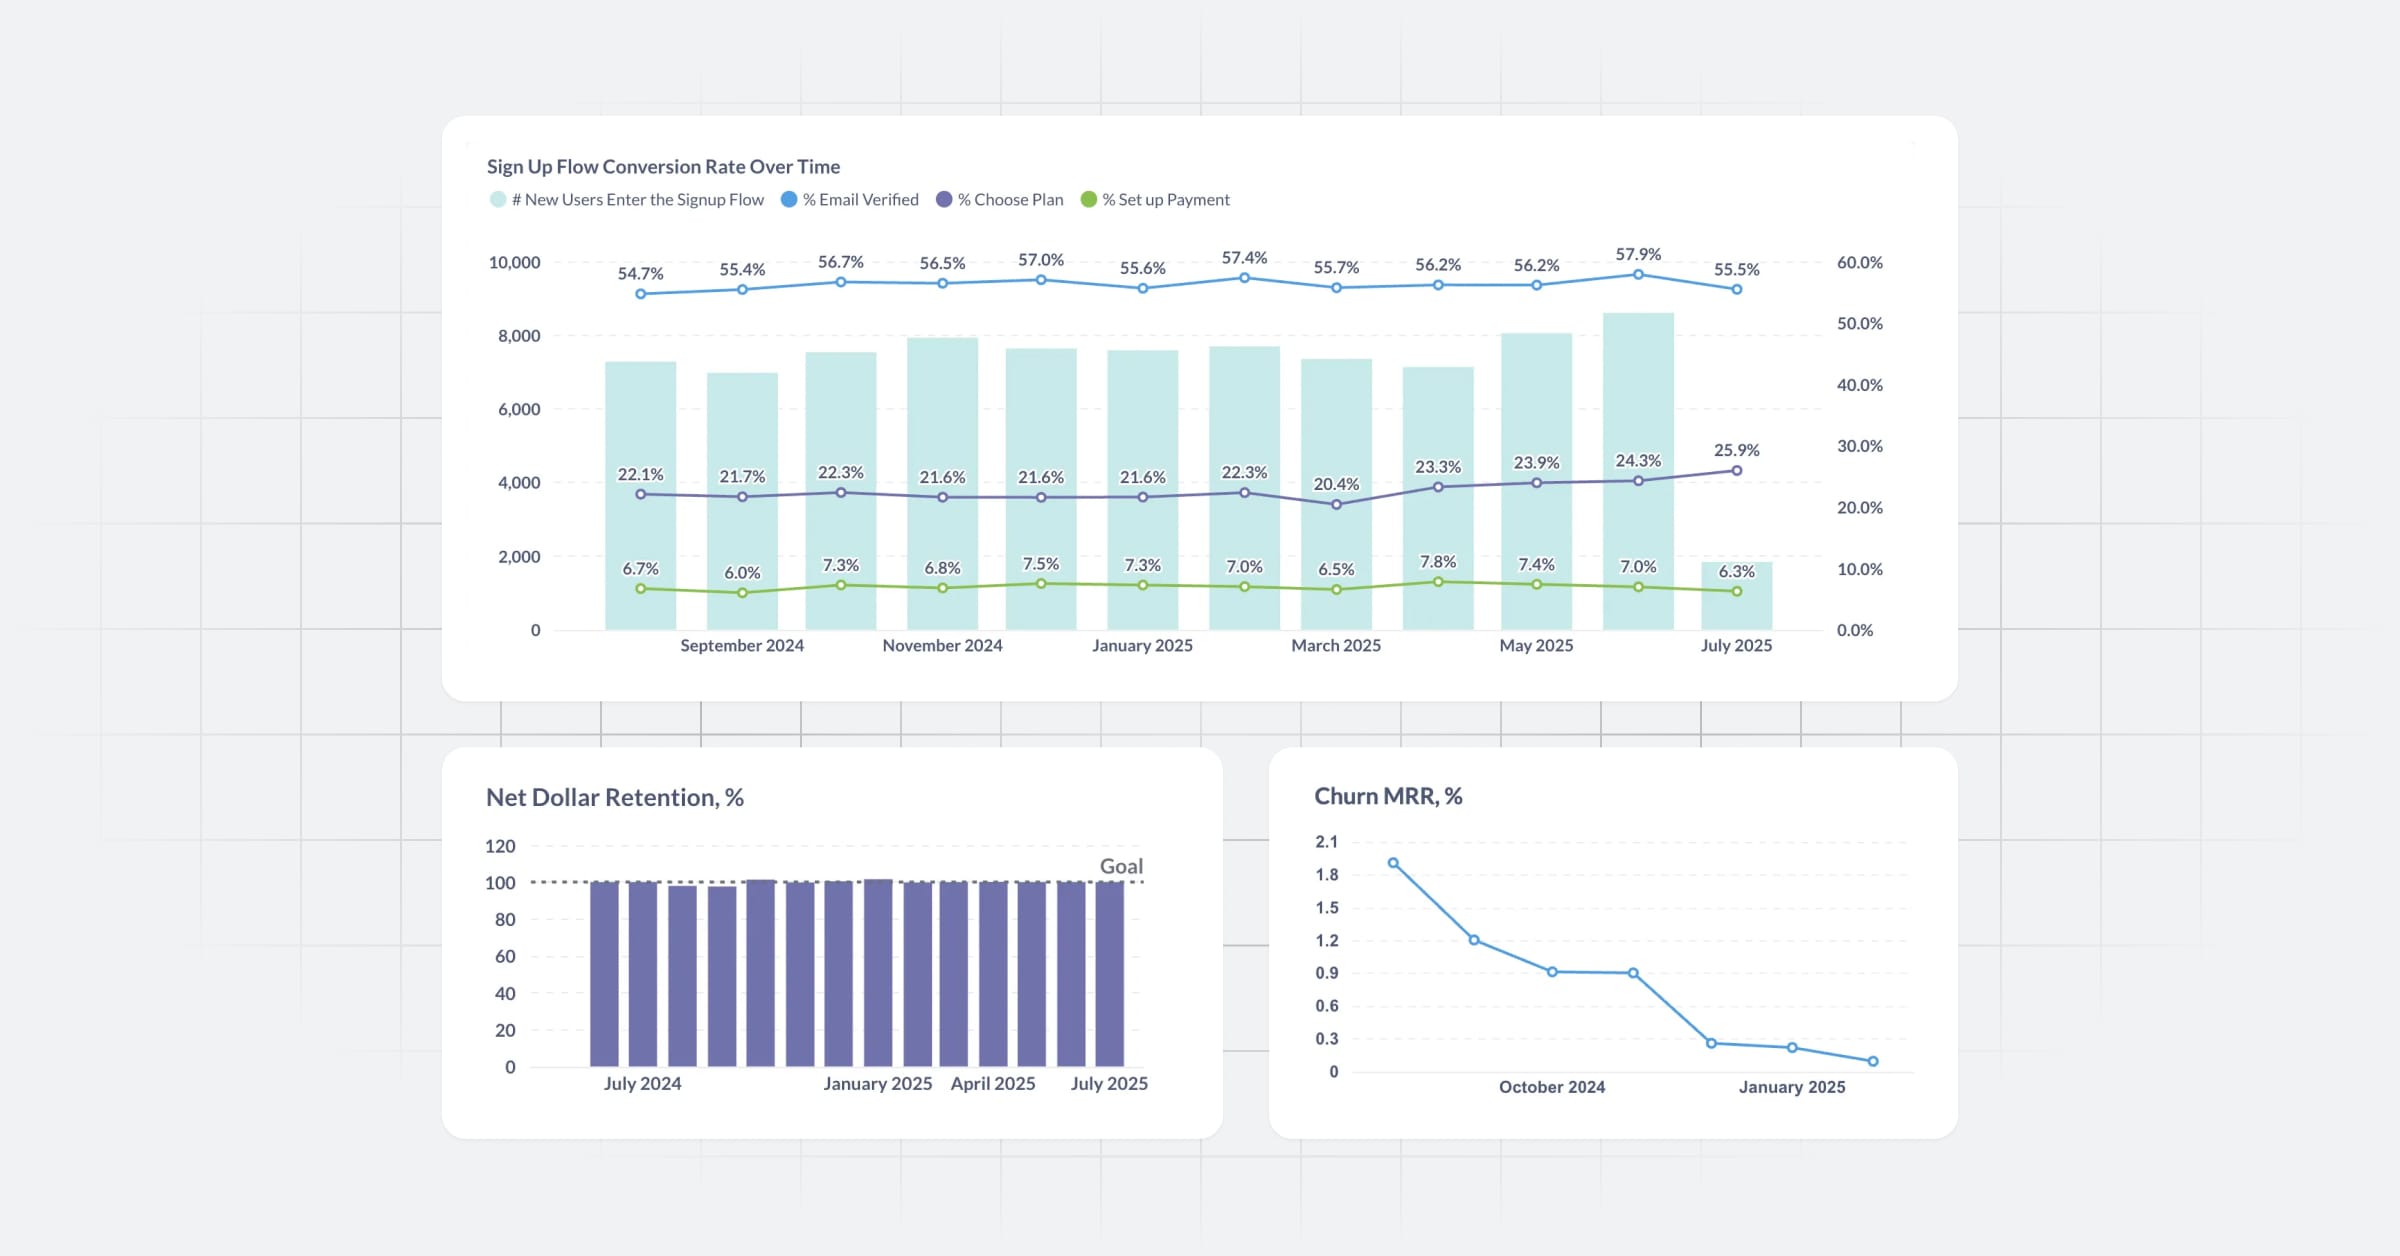
For the hypotheses you listed, build the shares: share of users who performed event x / total signups. Plot these shares on a chart and add your historical conversion rate (share of users who paid / total signups).
You should get a picture like this:
Run the correlation analysis for the curves of potential activation metrics and conversion on a weekly trend. Pick the best metric, the one that correlates with conversion better. You can check if your metrics correlate, using basic CORR function in SQL.
Not seeing correlations?
If correlation analysis did not work, try running an Odds Ratio analysis or WOE/IV analysis.
Or add an “OR did Z events” condition to the hypotheses that you have and repeat the correlation exercise.
Hopefully these steps would help. In order to further dissect the activation rate, it is often suggested to divide into “setup moment” and “aha moment”. E.g. in case of Metabase, our “setup moment” is connecting a database, which is super important but is not an activation action per se, while the “aha moment” in our case would be the creation of a chart.
Conversion rate from trial to paid / conversion rate from free to paid customer
Why it matters: To know how big is the share of traffic that actually pays you. It’s also a metric that is easy to benchmark (see Benchmarks below).
How to build: Divide the number of converted customers by the number of total signups and group by the date of signup (week/month).
To make this metric more stable, add a conversion window that is typical for your customers. E.g. if you have a time-limited 14d trial without a credit card, people can convert any time after 14 days, sometimes it would be after 60 or 90 days, so pick something that is easy enough for you to make decisions, e.g. 15 days.
Note: Conversion rate is a lagging metric and is not very suitable for being a goal for the product team. If you’d like to have goals on something, try activation rate or self-service revenue, not conversion.
New business revenue / new business MRR
Why it matters: Your product’s most important metric is revenue and you need to know what’s going on with it.
How to build: Sum the revenue/MRR of all new customers who converted in the given month
Pro tip: Group by pricing plans to see which products are bringing you more new revenue
Feature adoption share (of total paid customers / of total MRR)
Why it matters: The bigger the product becomes, the more features it has. Oftentimes new features are being added without consideration of their actual performance. This product strategy is called “Fire and forget”. For that not to happen, monitor the adoption rate of your features.
How to build: Divide the number of customers who used the feature in a given month by the number of paid customers in the given month. Do it for all features in a form of a set of line charts over time to see the trends (and also see which features are doing well, and which aren’t).
Pro tip: segment the features by pricing plans - to see what is actually driving customers to your higher plans.
Retention rate (general and by specific feature/use case)
Why it matters: Retention is king, and knowing where the trends go is important. For anything new you ship you have to be sure people stick with the new features - retention cohorts to the rescue. If you see that people are dropping the feature after a first week and don’t come back — it’s time to iterate and improve. Otherwise your product might turn into a Frankenstein.
How to build: Divide your customers to monthly cohorts and calculate how big % of the cohort uses the feature on month 1, 2, and so on.
Net Dollar Retention rate / Expansion MRR
Why it matters: The only thing that can save your business long term is your ability to upsell and expand your existing customers. There’s a limit to user acquisition efforts your marketing team can apply in order to bring new customers in a cheap way. The more you will be growing, the more expensive acquisition will become.
Thus invest early in upgrade and upsell paths in your product — and monitor the Expansion MRR that will eventually drive your Net Dollar Retention rate up as well.
How to build:
- Expansion MRR: Sum the revenue from Expansion MRR events for the given month.
- NDR in $: Expansion MRR + Reactivation MRR - Contraction MRR - Churn MRR
Churn rate (logo, MRR)
Why it matters: The opposite metric to retention rate, churn is telling you how much money you’re losing each month from customers who paid you but stopped paying you in this month. Churn in logo and in MRR % is a well benchmarked metric.
How to build: For all customers who paid in the previous month, but didn’t pay this month, generate Churn MRR events with a negative value. Sum these events to get the Churn MRR.
Logo churn in % is the number of customers who paid you in the previous month but stopped paying you this month divided by the total number of paying customers in this month.
Essential benchmarks for top-of-funnel SaaS metrics
Some of these metrics, mostly conversion rates, are easy to benchmark, especially if you’re building a product that has a similar business model to the canonical digital products.
Here’re some examples of top of the funnel metrics benchmarks for B2b SaaS types of products:
| Metric | Benchmark | Comment |
|---|---|---|
| Website visit (unique) → signup (finished) | 8% | 8% is for a mix of paid and organic traffic. Depending on your user acquisition strategy, it could be higher or lower for paid traffic. A very nice early indicator of how well your marketing campaigns perform — if they bring in traffic that converts to signups better than organic, you’re on the right track. This number might be lower if you’re offering a trial with credit card collection. |
| Signup start → signup finished | 25% | Depends on the number of required fields/steps and again, on whether you collect a credit card or not. |
| Signup finished → Activated | 35% | This is the canonical B2B SaaS activation rate, with activation defined as mentioned above. |
| Signup finished → paid (7 or 14d trial) | 10% (trial without credit card, 30-day window) 40% (trial with credit card) 2.5–5% (freemium) |
Trials with credit cards collected convert better, but you should be mindful of retention and refund rates. If you have a sales team engaging with leads from the self-service funnel, this number can be higher. Freemium products convert at best around 5%, which is considered very high — your product must be very sticky and have a large user base to sustain revenue at this rate. |
| Churn MRR % | 4% | For B2B SaaS, under this amount churn is considered healthy. If you’re doing better — great! |
| Net Dollar Retention % | 100%+ | If you’re upselling well, you might reach 100%+ NDR, meaning your business would grow even if user acquisition stopped. Investors love this metric because it signals strong expansion and retention. |
Source: OpenView Product Benchmarks
How to turn your product metrics into actionable Insights
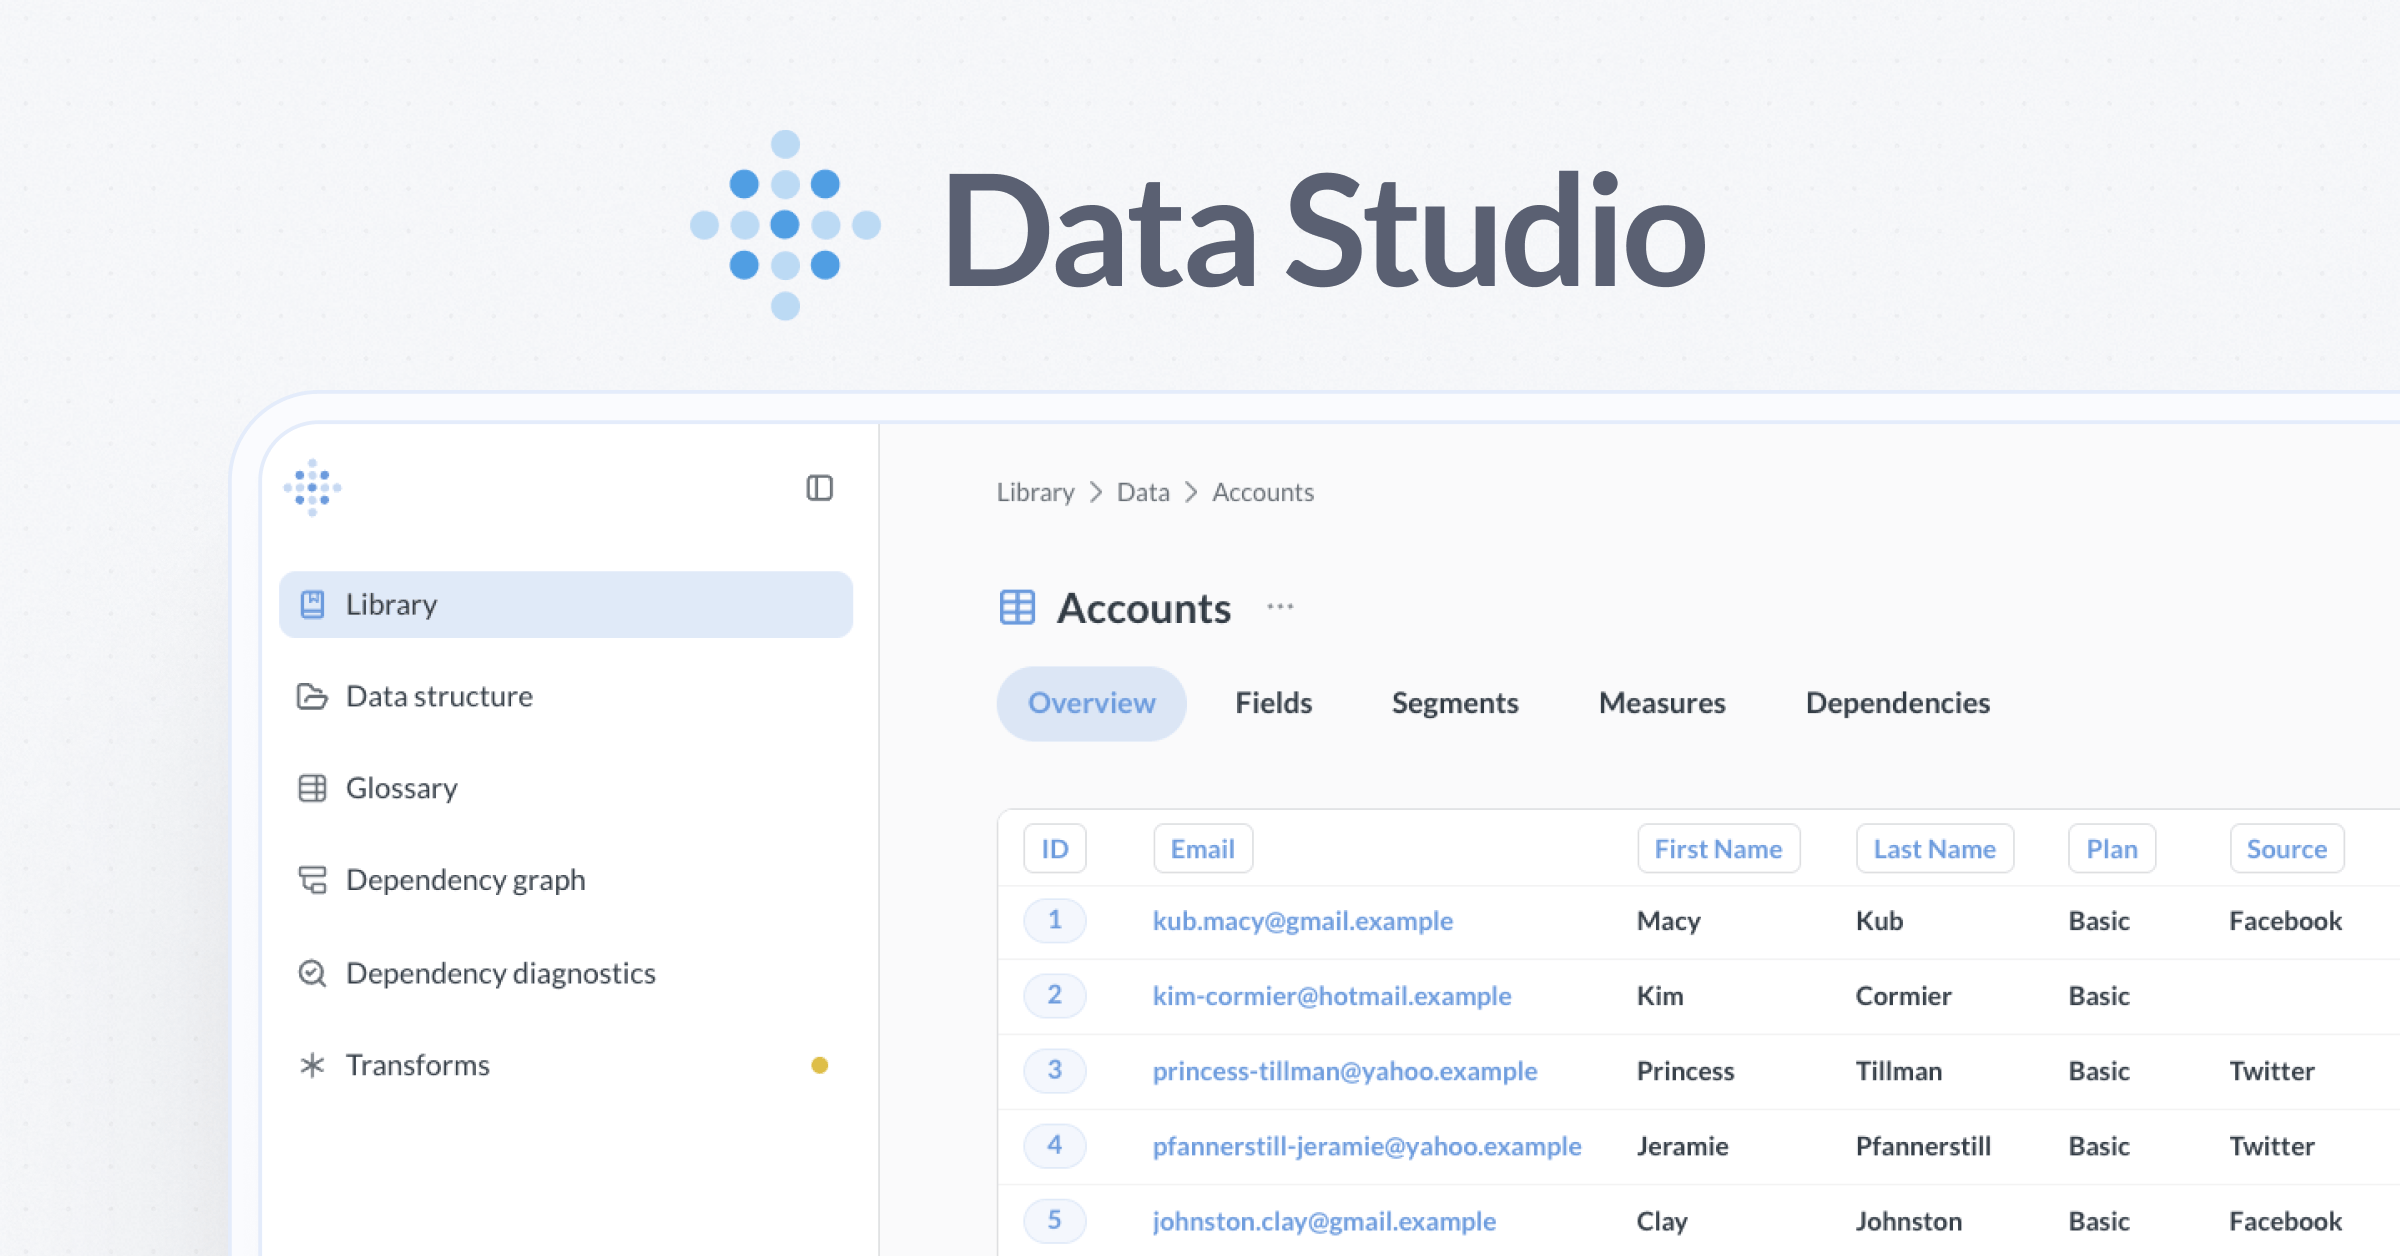
First, get a full picture of your metrics in a nice bird view - make a dashboard that will serve as a navigating compass for your decisions. Metabase can help!
Look at the metrics and find the laggards: which metrics are far below the benchmarks?
Try to pick 1-2 of them and find the reasons of why those could be so low.
Low activation and user engagement on trial will naturally lead to low conversions. Is your product too complicated to use? Are you acquiring the right users?
Perform user interviews, listen to sales calls to find the gaps in the first time user experience and focus on fixing those. Oh, and bugs, don’t forget to fix these as buggy software is also not converting people into paid and loyal customers well.
Activation problem is not fixed by adding tooltips, walkthrough guides or extra documentation. The only thing that works well is thoughtful design of the navigation and first time user experience, that should help to overcome setup hurdles, if they are necessary.
Churn is the derivative metric and won’t improve if you don’t fix the activation rate for new customers and adoption for the existing.
Final thoughts: making product metrics accessible and actionable
This post showed you how to choose the right product metrics and visualize them. Metabase is a powerful tool not only for measuring and displaying these metrics but also for giving the entire team access to them, so everyone can explore the data and discover valuable insights on their own, no data expertise or SQL needed.