Learn about Production Incidents, including how to measure it, and leverage it in dashboards and visualizations with Metabase.
Production incidents cover a variety of metrics, allowing teams to visualize how often problems are occurring and how quickly they get fixed. The purpose of learning about production incidents is to learn how to better manage said incidents and get insight into specific production problems that might be occurring. In tech, production incidents can become detrimental to an organization, causing dissatisfied customers, unreliability, and stressful working environments. Being able to easily look at your incidents can help you get a handle on any problems that arise before they become massive issues.
Get Started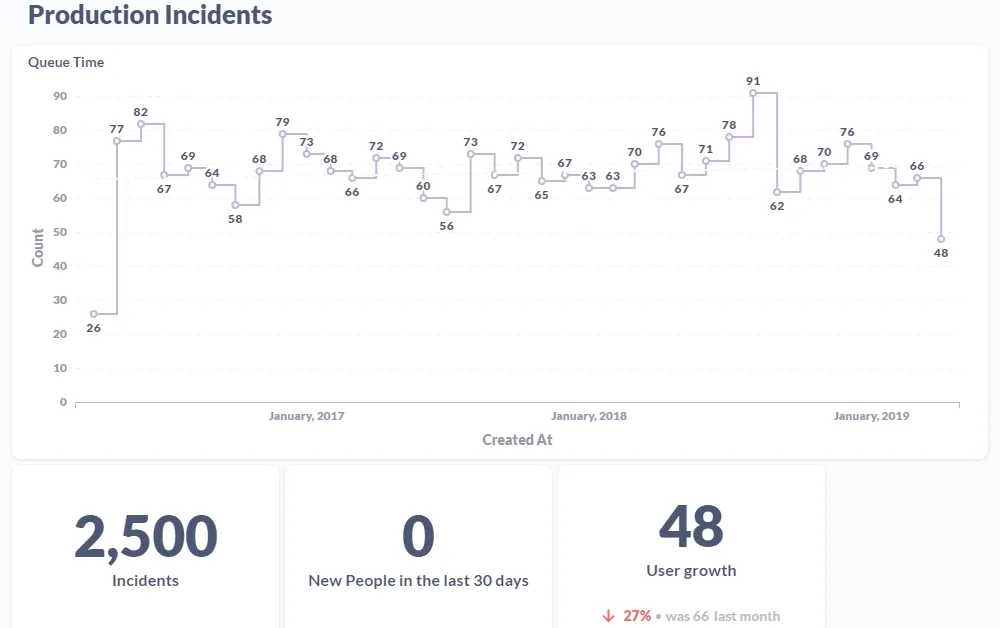
Many different KPIs fall under the production incident umbrella, so how you calculate them is entirely customizable based on your needs. A few popular metrics used to track production incidents are: Incidents over time - This is a metric that counts up the number of incidents you’ve encountered over a specified time period. You can determine what’s acceptable or unacceptable for your products and you can see patterns in increases and decreases of incidents over time. Uptime and downtime - You can calculate the average number of your uptime or downtime, giving you a percentage that indicates your reliability levels and whether or not they’re in an acceptable range. Production incidents won’t fix your problems for you, but it’s important to show trends in incidents to dev teams in order to address them before they get worse.
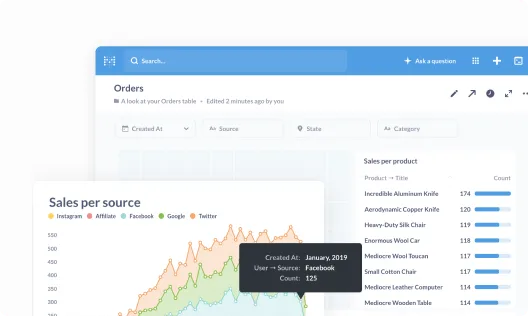
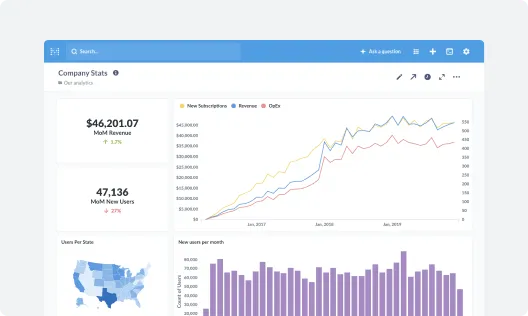
Get everyone on the same page by collecting your most important metrics into a single view.
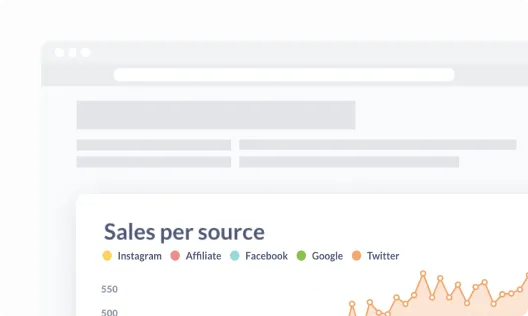
Take your data wherever it needs to go by embedding it in your internal wikis, websites, and content.
Empower your team to measure their own progress and explore new paths to achieve their goals.

That's right, no sales calls necessary—just sign up, and get running in under 5 minutes.

We connect to the most popular production databases and data warehouses.
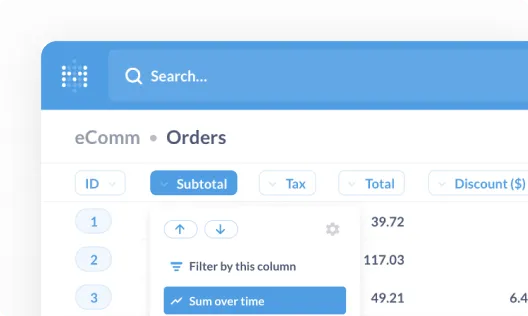
Invite your team and start building dashboards—no SQL required.


