Learn about Release Burndown, including how to measure it, and leverage it in dashboards and visualizations with Metabase.
Keeping a schedule is an essential part of a product’s release. Calculating your release burndown can tell you post-release how your project’s schedule went. You’ll be using your release burndown for both your team and as a way to publicly show what’s going on with your current release since launch. Release burndown also helps you predict your ROI, which can help you guide stakeholders on ROI expectations. You’ll be able to give them insight into what’s going on for each sprint based on velocity and developer estimations.
Get Started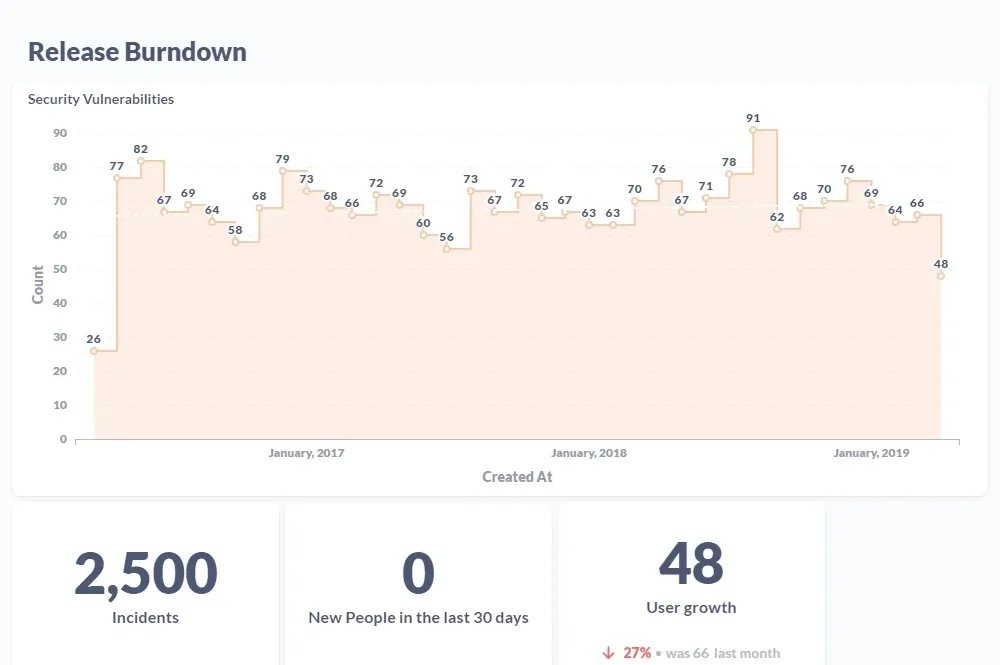
Release burndown is represented in a graph, comparing the number of story points remaining (which equates to the amount of work required to complete) and sprint (which equates to time). The graph will show the initial story points in the positive, while the added user stories will be a negative number, showing the ROI. When you visualize release burndown this way, it gives you space to continue showing predictions for your burndown, giving a realistic idea of what your ROI looks like.
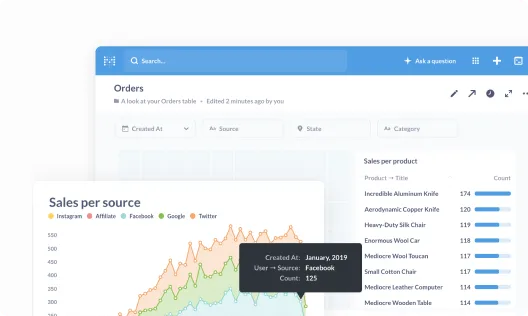
Get everyone on the same page by collecting your most important metrics into a single view.

Take your data wherever it needs to go by embedding it in your internal wikis, websites, and content.
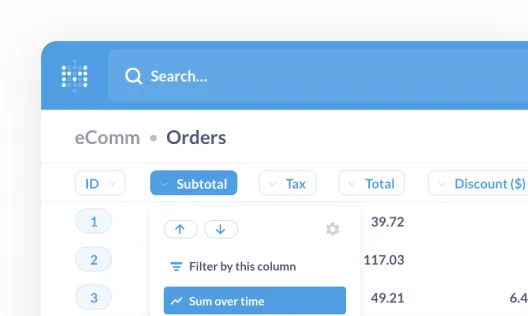
Empower your team to measure their own progress and explore new paths to achieve their goals.

That's right, no sales calls necessary—just sign up, and get running in under 5 minutes.

We connect to the most popular production databases and data warehouses.
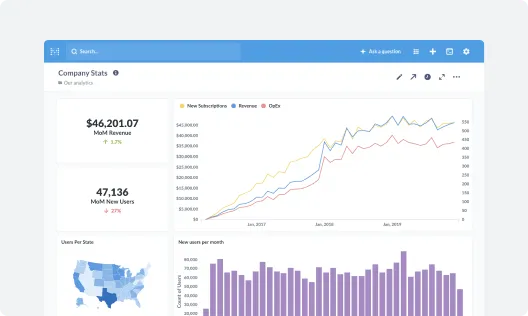
Invite your team and start building dashboards—no SQL required.