8 min read

Becoming a data analyst is both a great goal and a big undertaking. It’s tempting to try to list everything you might need to learn, but that quickly becomes overwhelming and still incomplete.
Instead, this guide gives you a solid starting point. It focuses on building a strong foundation that will support all the topics you’ll want, or need, to learn later. The topics are broken down below into chunks of related topics, and organized by tools you might know or want to learn: Spreadsheets, Metabase, and SQL.
Stay tuned for part 2, which will include pointers to more advanced topics for you to tackle once you’ve mastered the basics laid out here.
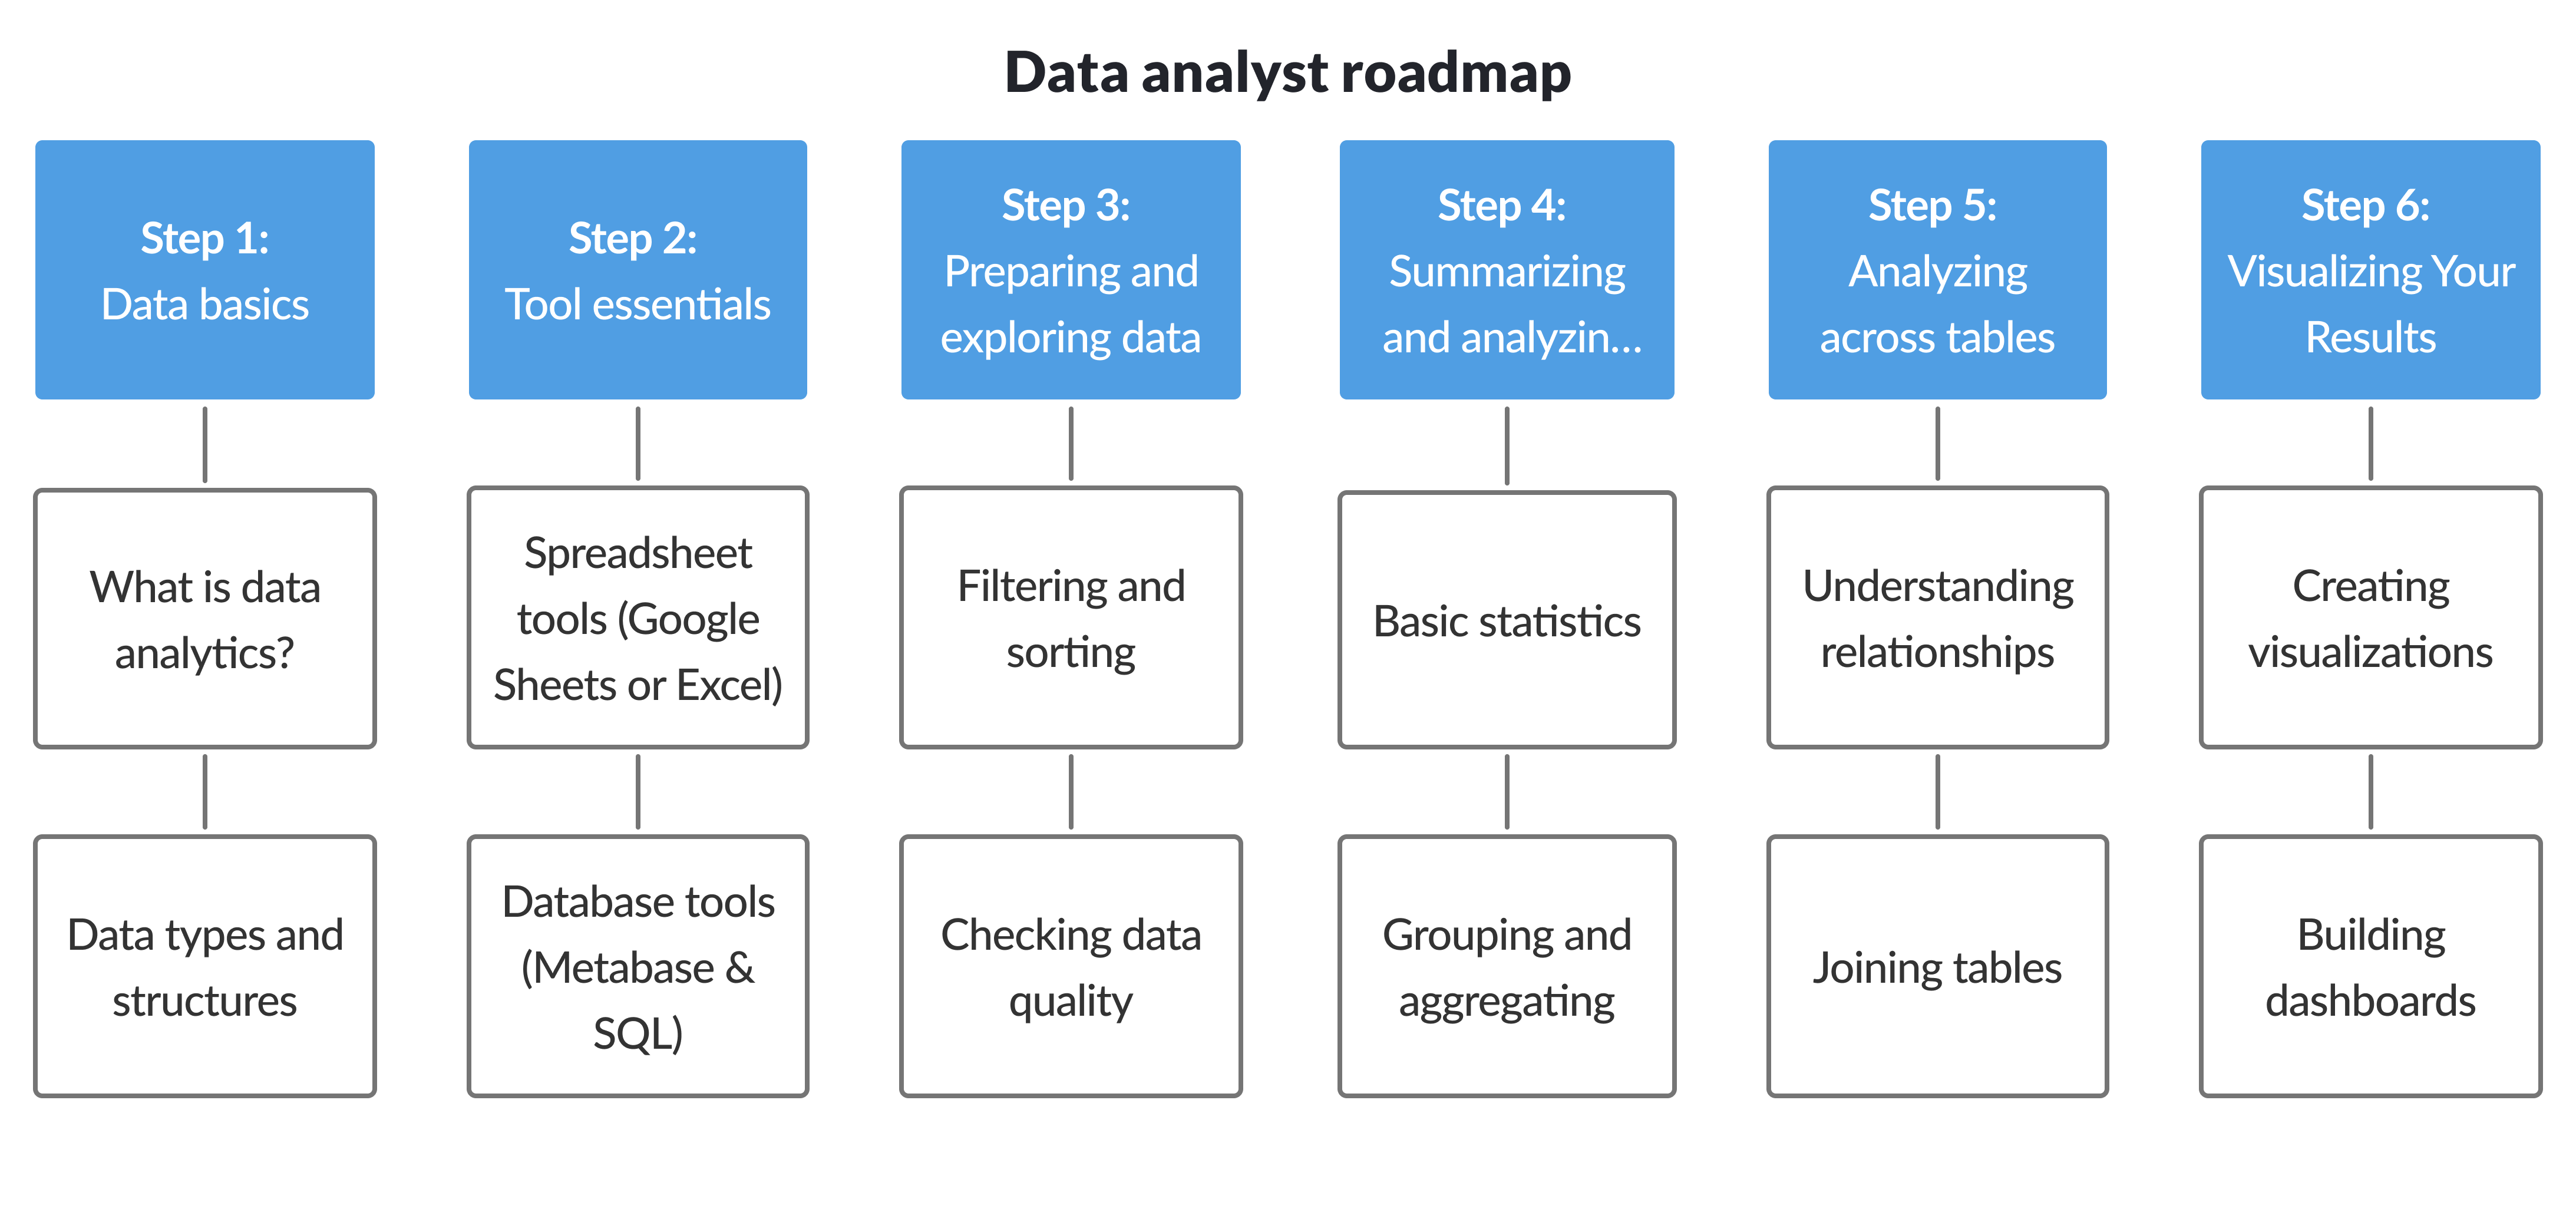
First, let’s look at what data and data analytics even are. This is the foundation for all further steps. Even if you’re familiar with some of the material here, it will pay off to remind yourself of these fundamental concepts.
Analytics is all about understanding what your data means and what it can tell you about your business (or whatever your data is about). Analytics serves a number of purposes, and doesn’t just react to the data. There are different types of analytics you should be aware of, even if we are mostly covering descriptive analytics in this guide.
Core concepts
Data comes in many forms, but we’re really only looking at a fairly specific kind of data here: tabular data the way it is used in spreadsheets and databases. Much of the worlds of business and technology run on this kind of data, however. In this section, we’re looking at how this data is organized and what kinds of information you can find in databases and spreadsheets.
Before diving into analysis, you need to get comfortable with your tools. The three most common are Excel (for spreadsheets), Metabase (a BI tool), and SQL (for querying databases).
Start with whichever tool is most relevant to your work. You don’t need to learn all three at once.
You can skip this if you’re comfortable in Excel, but take this opportunity to reacquaint yourself with the basics of spreadsheets if you’re unsure.
SUM, AVERAGE, COUNT, IF, and VLOOKUP in this Excel tutorialAs a BI tool, Metabase allows you to work directly with databases without necessarily knowing SQL, and also create data visualizations.
SQL is the native language of databases. Even if it might look difficult, it’s worth knowing for more complex data analysis (and because it’s the industry standard). It’s also much less scary than it initially looks, once you get to know it a little bit.
Now let’s get to the actual work with data! The first step is being able to organize it. Filtering and sorting data are the first operations, and they are part of all the next steps below.
The good news is that once you understand the concept in one tool, it transfers easily to others.
Filtering in Excel Learn how to narrow down rows in spreadsheets using built-in filters, as shown in this Excel filtering guide.
Filtering in Metabase Apply filters visually in the query builder without writing SQL, as explained in the Metabase filtering guide.
Filtering in SQL
Filter rows in database queries using WHERE clauses, text and date conditions, and logical operators like AND, OR, and NOT, using examples from filtering by text and filtering by date.
Data is rarely clean and perfect. It may come from multiple sources, use inconsistent formats, or contain missing values.
Once your data has been checked and cleaned, and you’re able to perform basic sorting and filtering, the more advanced operations can begin. Data can be vast, so it is necessary to reduce it in different ways to make sense of it. This is done using various kinds of aggregations: groupings that compute values. They can be simple sums, or various statistical values like means or medians.
You’ve heard of means and medians, but what do they mean? And how are they computed?
It’s also useful to understand data aggregation, how individual data points are grouped into summary values. See this data aggregation overview.
Pivot tables are a powerful way of computing aggregations in spreadsheets. While they might seem daunting at first, the basic idea is the same as in SQL: subdivide the data and compute values over each segment. Much of data analysis is built on top of this approach.
Similarly to Excel, Metabase has the tools for computing sums and breaking down large datasets into sections.
GROUP BYThe SQL way of computing aggregations and statistics is done using the GROUP BY keyword. These resources will help you understand how it works.
GROUP BY in this SQL guideOnce you can aggregate data, the next step is deciding what to measure. Metrics and key performance indicators (KPIs) help turn raw numbers into signals you can track over time and use to guide decisions.
In real databases, data is usually organized into several data tables. To answer questions, these have to be connected through joins. This section explains how joins work, and how this operation can be performed even in Excel, but also in a BI tool like Metabase and using SQL.
To combine data from different tables, Excel has the XLOOKUP and VLOOKUP functions.
In databases, this operation is called a join. Metabase can create joins in its query editor.
SQL of course allows you to create joins using the JOIN keyword.
Finally, once your analysis is done, it is time to show your results to the world. The way to do this is using charts and visualizations. Here we cover the basics of creating visualizations from data, and how to turn them into a interesting and compelling story.
Data analysis is a fascinating field to dive into, but it is easy to get lost in the many different things you can do, and all the possible ways to do it. If you’re new to this field, our guide will give you a first foundation for you to then base your own explorations on.
We very consciously kept this guide quite simple and basic. It’s better to have a shorter list of items to really work through, than a massive list that you have no hope of ever completing.
In a few months, we will follow up with more advanced tutorials and topics, so stay tuned!