


How tables differ between spreadsheets and databases
A look at the different mental models for spreadsheets and database tables.
Both spreadsheets and databases are ultimately built on tables: regular layouts of data with rows and columns, where each row tends to have a value in each column.
While tables in spreadsheets and databases appear similar at first glance, they organize data differently. Each has different strengths for data analysis and visual organization.
- Data in spreadsheets is laid out in rows and columns, while database tables assign fixed semantic roles to columns.
- Spreadsheets use a “wide” format suitable for summaries and annotations, whereas databases use a “long,” normalized format that results in rows with uniform structure.
- Database tables make it easy to add many values to the same table by adding more columns. To add values to spreadsheet data, you may need to create additional tables.
- Tables can be translated between spreadsheet and database formats using an operation called pivoting.
Spreadsheets can have many layouts
Spreadsheets come in all shapes and sizes. They can include many tables with hierarchies, calculations like sums across and down, and random one-off calculations. This example from the Bureau of Labor Statistics is typical of government data.
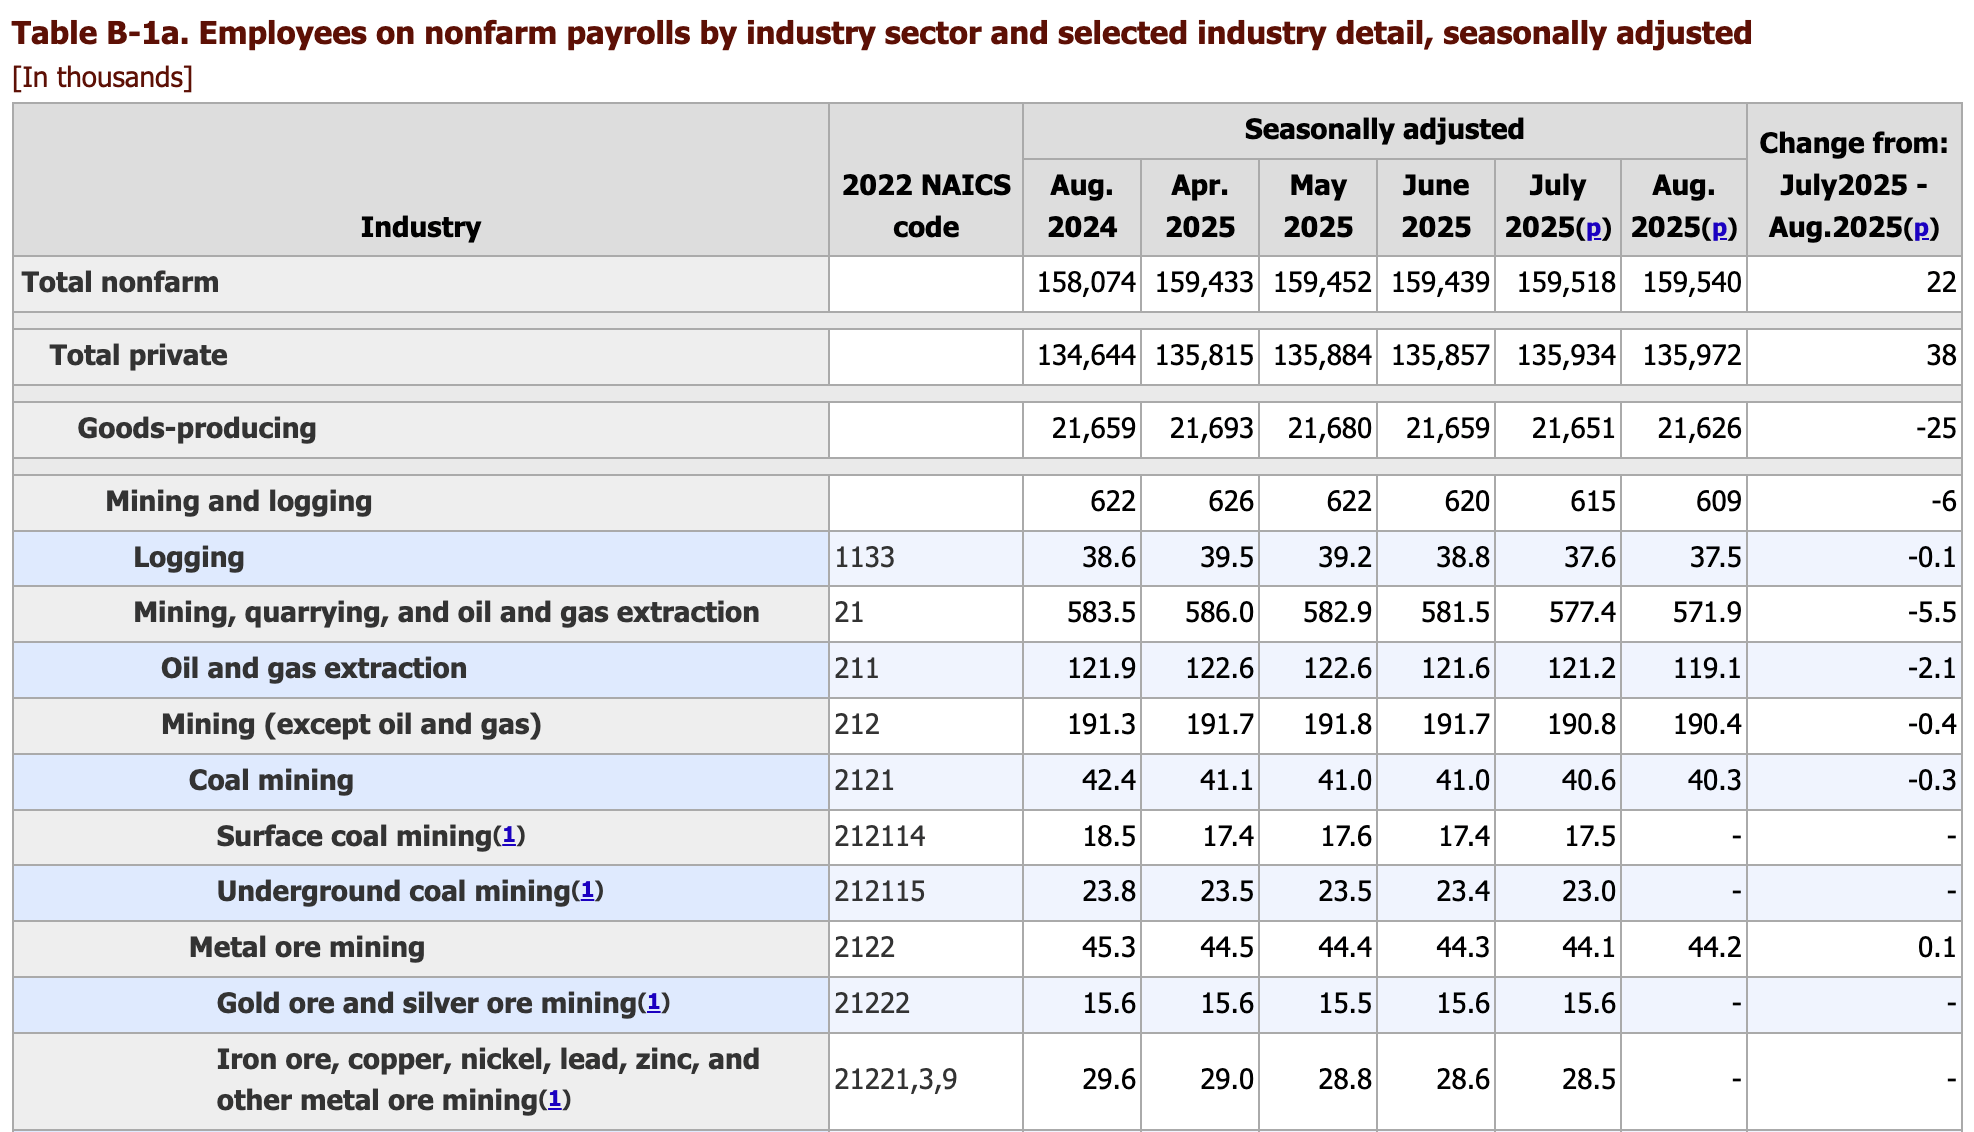
The lack of restrictions makes spreadsheets incredibly powerful, and works well for tables that are meant to be consumed directly by humans. But for analysis and visualization, we need data to be structured in a more rigid and consistent way.
Comparing spreadsheet and database layouts
A typical table in a spreadsheet uses a 2D layout, with labels along the side and top. We can break the table up into two types of values, dimensions that determine its structure, and measures that represent the values we observed or computed.
For example, here’s a table of yearly sales for a number of product categories:
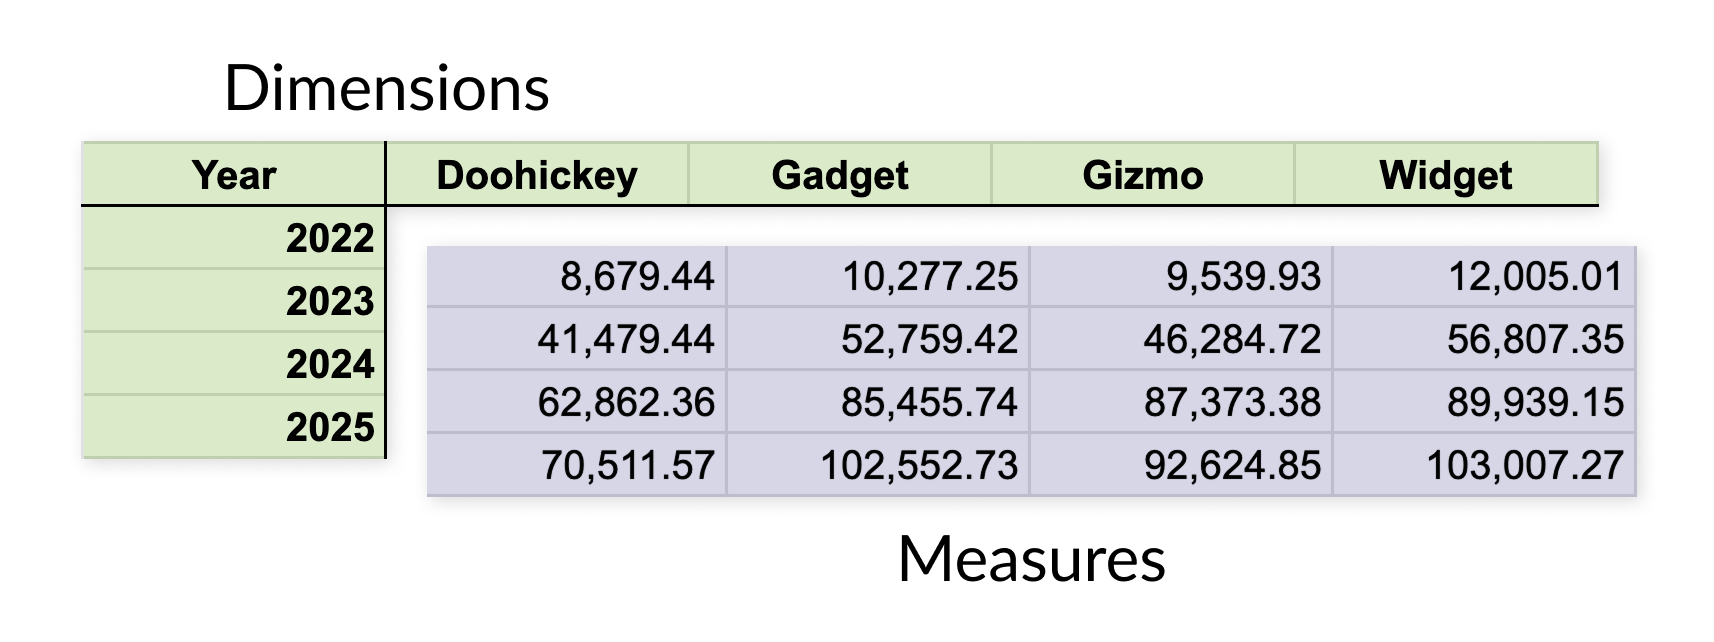
Dimensions are qualitative values, even when they are numeric, meaning they aren’t used in computations but act as identifiers. Measures, on the other hand, can be used to compute sums, averages, etc.
Another way to think of dimensions is as coordinates. In the spreadsheet table example above, each value is placed at the intersection of a grid. To look up the value for Gadget sales in 2024, you find the Gadget column and then the row for 2024.
By contrast, in a database-style layout, each row has the same layout, with each column either a dimension or a measure. Where a spreadsheet table lays values out in a grid of cells, a database table looks more like a long list of rows.
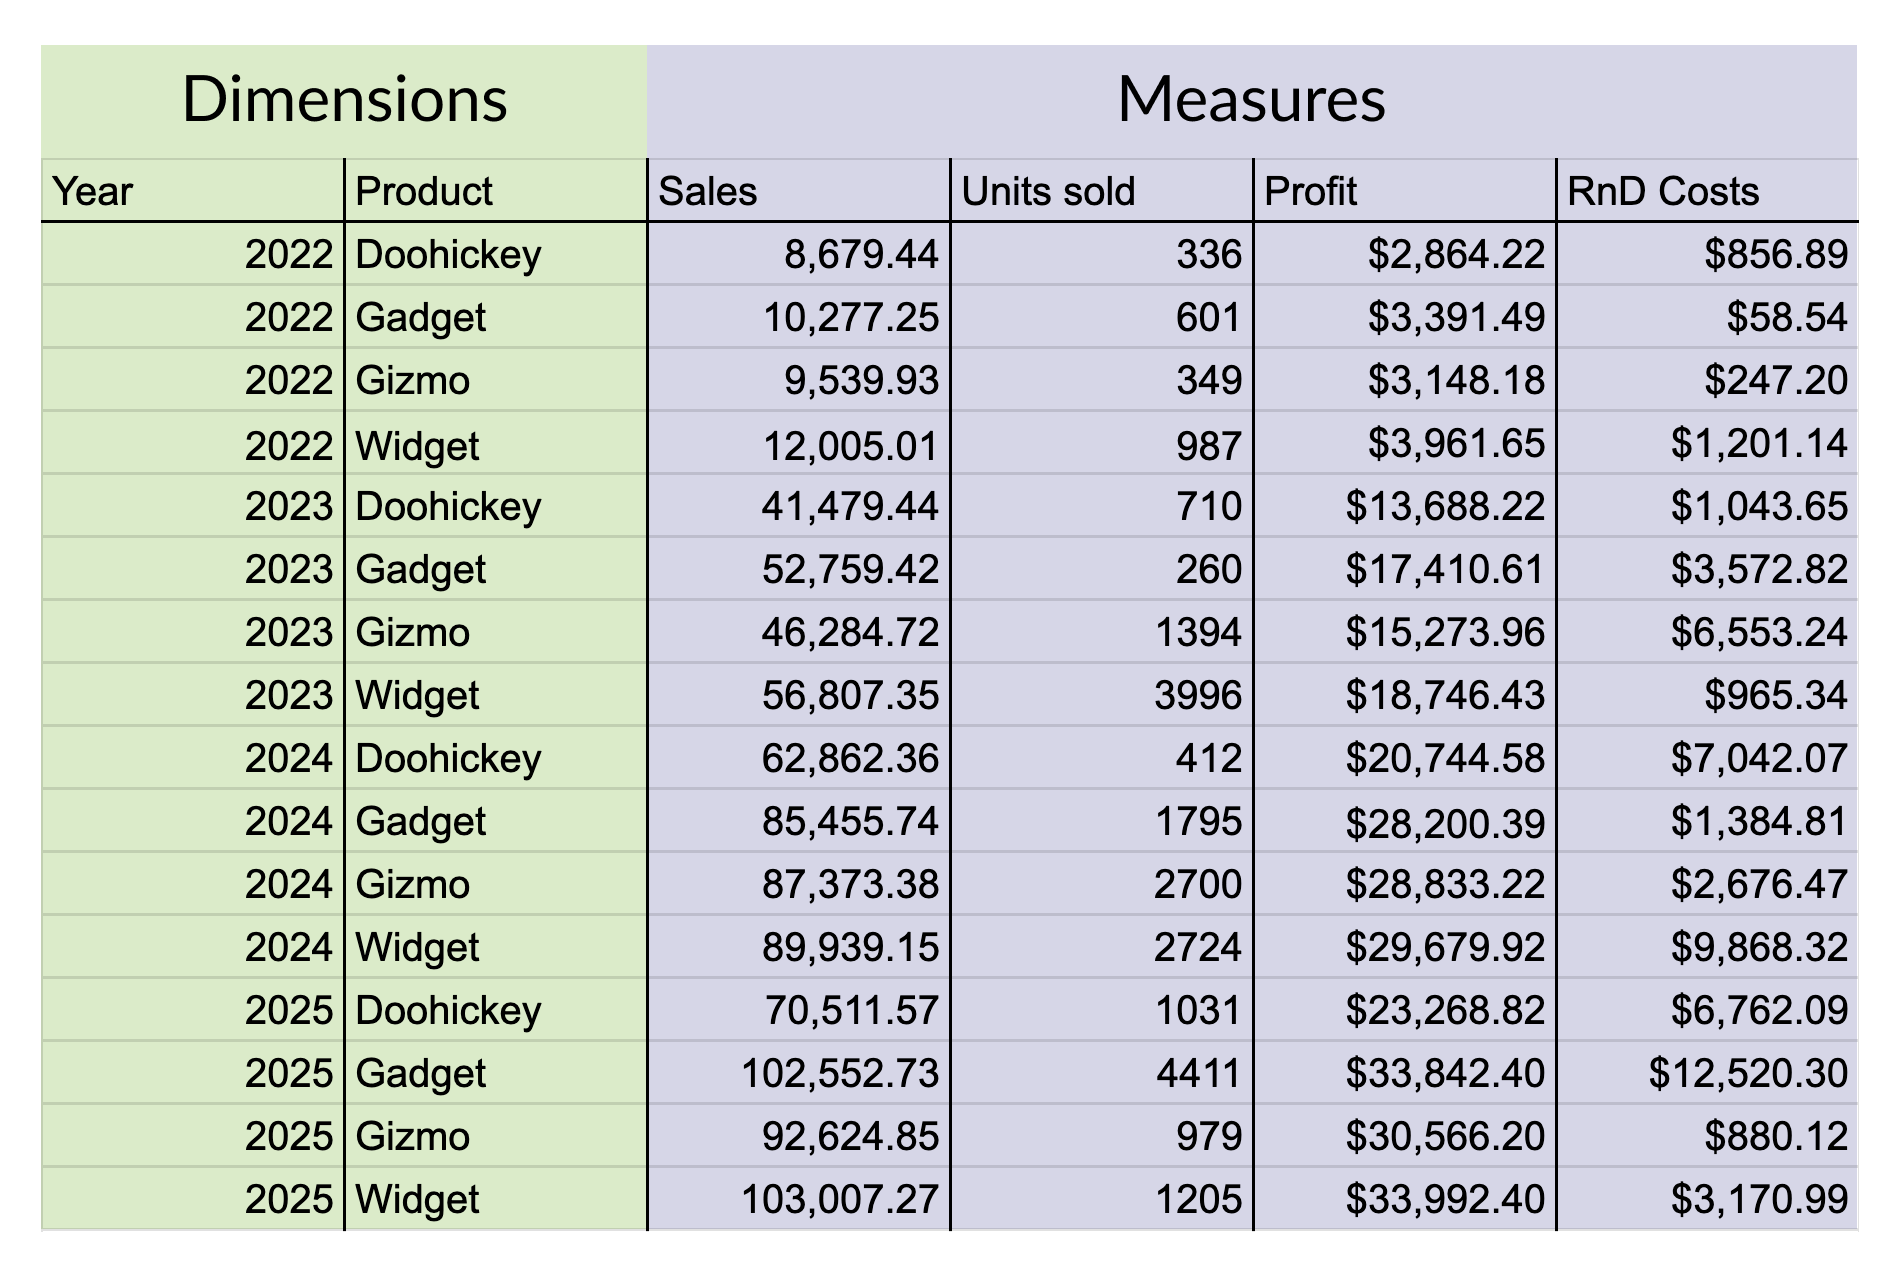
Finding a value in the row-based layout of a database depends only on the information contained in each row. When looking for Gadget sales in 2024, a database can scan each row and check the values in its Product and Year columns.
Storing data as rows allows the database to sort and filter by any combination of columns, compute values within rows (such as price per unit), and create aggregations of values across many rows (like totals per year).
Pivoting tables between the spreadsheet and database format
The process of converting between the spreadsheet and database styles of tables is called pivoting. When going from spreadsheets to databases, pivoting reorders the measures and adds columns for the two dimensions. When going from databases to spreadsheets, the pivot operation turns a large number of rows into a two-dimensional grid of values.
Here is a spreadsheet table (on the left) pivoted to the row-based layout of a database table (on the right). The colors show the corresponding product categories.
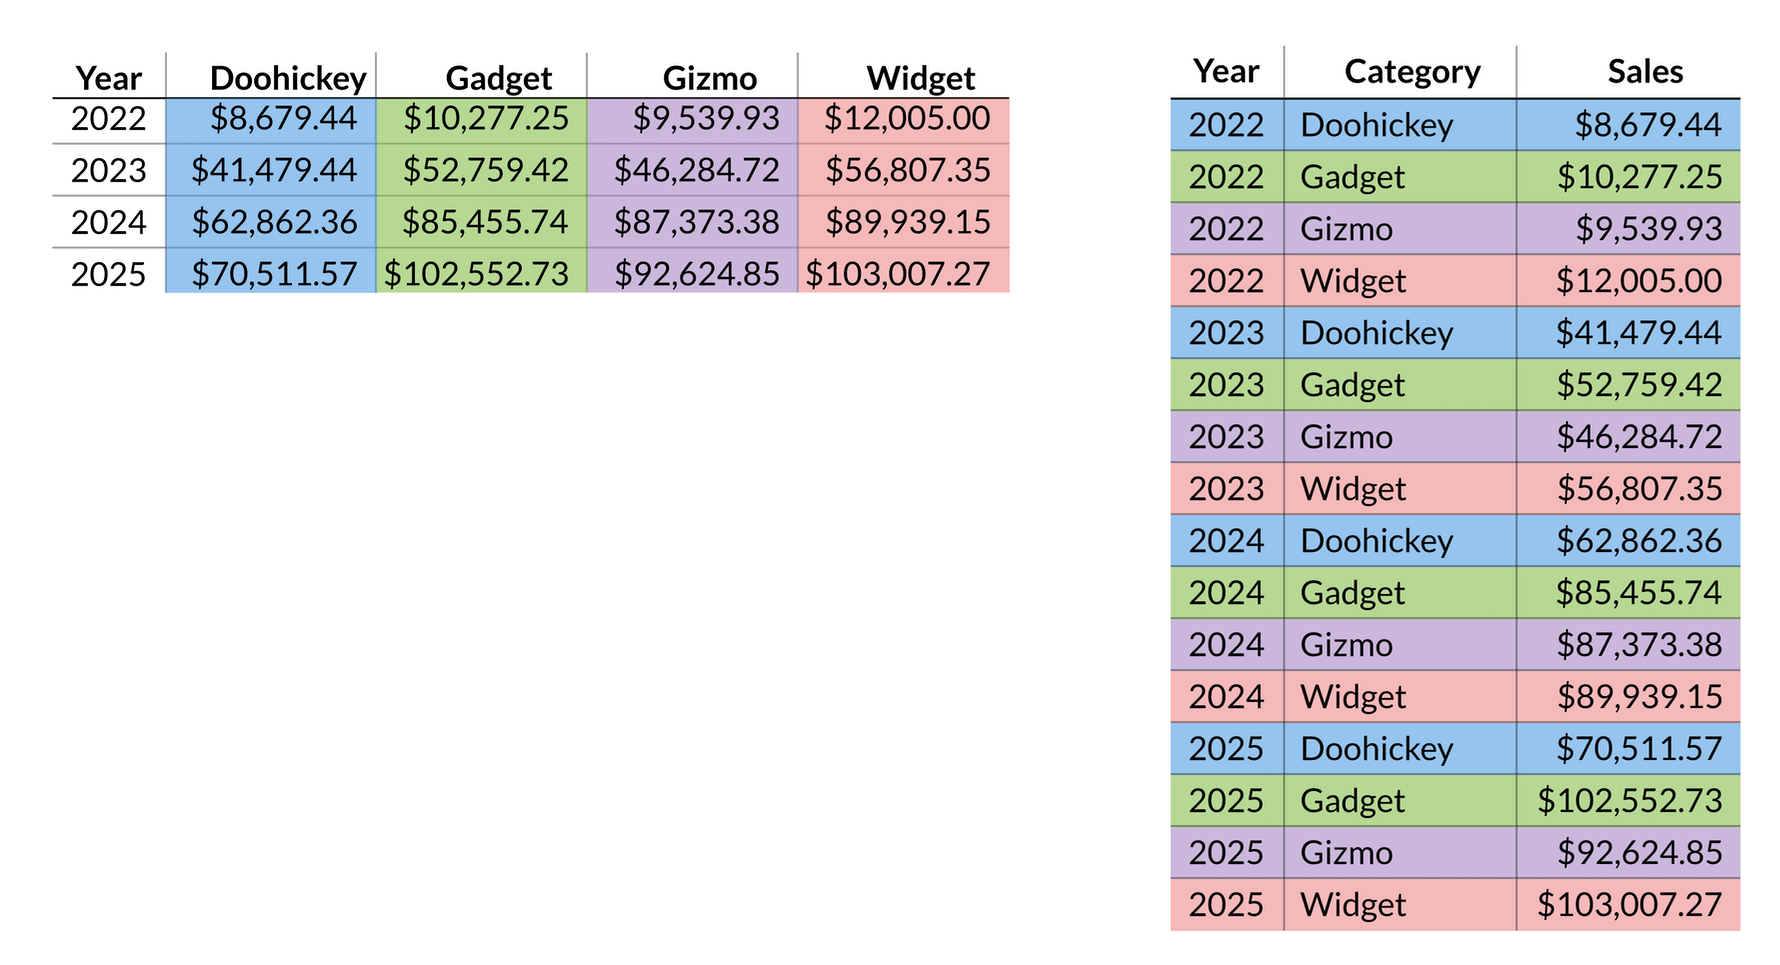
The data is exactly the same between the two types of tables, we have just reorganized it. Instead of the spreadsheet’s 4x4 grid giving us 16 cells, the database table now has 16 rows.
Confusingly, pivoting a table isn’t the same as creating a pivot table. A pivot table in the Excel sense is not purely a transformation of data rows into columns (and vice versa), but also a way to aggregate and summarize values. These pivot tables are otherwise known as cross-tabulations, or crosstabs.
Combining and joining tables
Both spreadsheets and databases can combine data from multiple tables, but they do it in different ways. Check out VLOOKUP/XLOOKUP to Joins.