Build a record lookup tool with Metabase
How to use Metabase to build an internal lookup tool to quickly find details about your customers, orders, or other data.
We’ve written about some of the interesting ways people use Metabase, and one of those is using Metabase as a solution for internal or back office apps, like a customer lookup tool. Rather than building custom pages to look up customer information, order info, or other records important to your organization, you can simply spin up a Metabase instance and build a dashboard that allows people to quickly pull up information related to an order number, SKU, name, or other field.
In this article, we’ll walk you through how to build a simple customer lookup tool using the Sample Database included with Metabase. We’ll show you some of the features Metabase gives you out of the box, as well as some things you can do to customize your lookup tool. The data in the Sample Database is pretty basic, but we’ll try to put together a dashboard that approximates the kind of tool you’d actually build and use in the wild. You can get Metabase and follow along, or just read through to get some ideas for building your own tools.
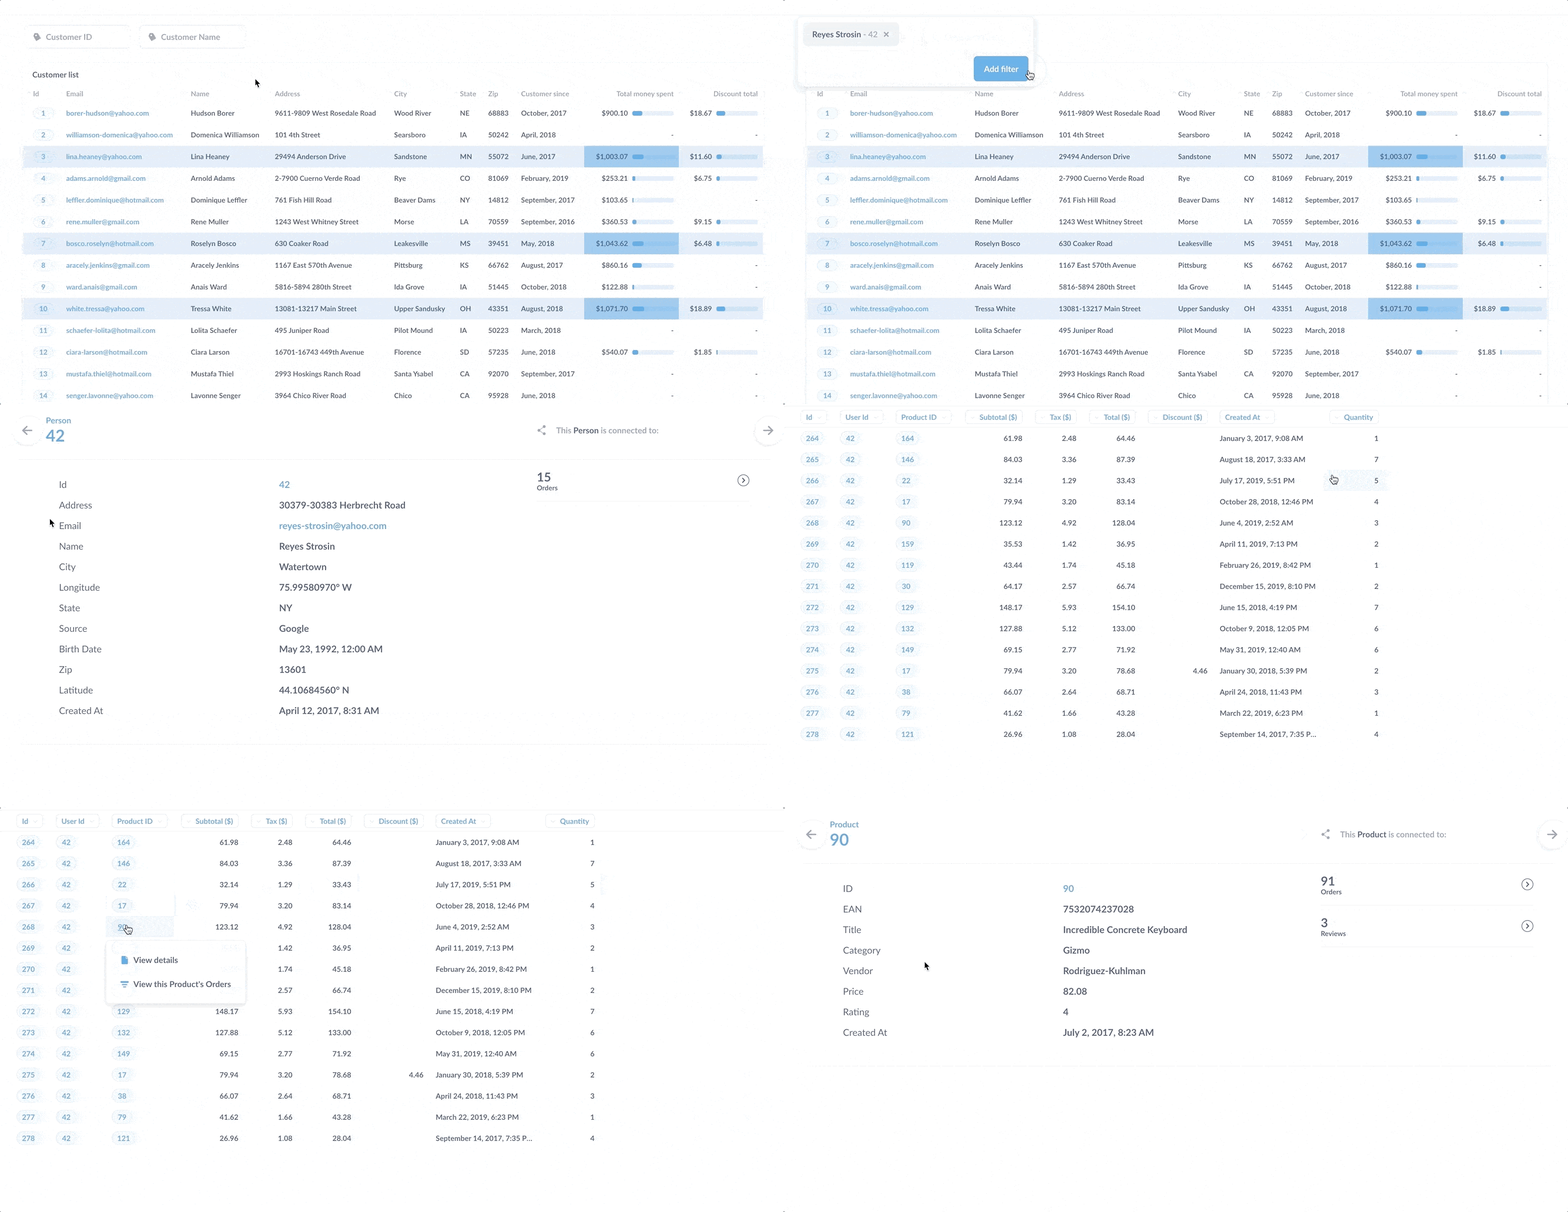
Here’s our finished lookup tool in action:
Goals for the customer lookup tool
Our goal here is to have an interactive list of our customers that will be handy when we’re going through help tickets or other customer-related tasks. Clicking on the ID to bring up details about that customer, and then pulling up the orders placed by that customer.
To that end, we’ll want to make our list sortable and filterable, and we’ll want to be able to drill down to see individual records. Here are some things we want to know about our customers:
- Name, email, city, and state
- How much money they’ve spent with us
- The total amount of discounts we’ve given them
We also want to be able to look up customers by their name or ID.
So here’s the high-level plan for building our tool:
- Goals for the customer lookup tool
- Create our list
- Add our question to a dashboard
- Add filters to the dashboard
- Customize click behavior
- Embed the tool in your wiki or app
- And that’s it!
Create our list
From the main navigation bar, we’ll select + New followed by Question > Raw Data > Sample Database > People table (since we’re interested in customer information). If we click Visualize, Metabase will do some science, and we’ll get a nice little table visualization of the records in the People table.

Metabase has already done some work for us. For example, clicking on the ID in a row will bring us to a detail page.
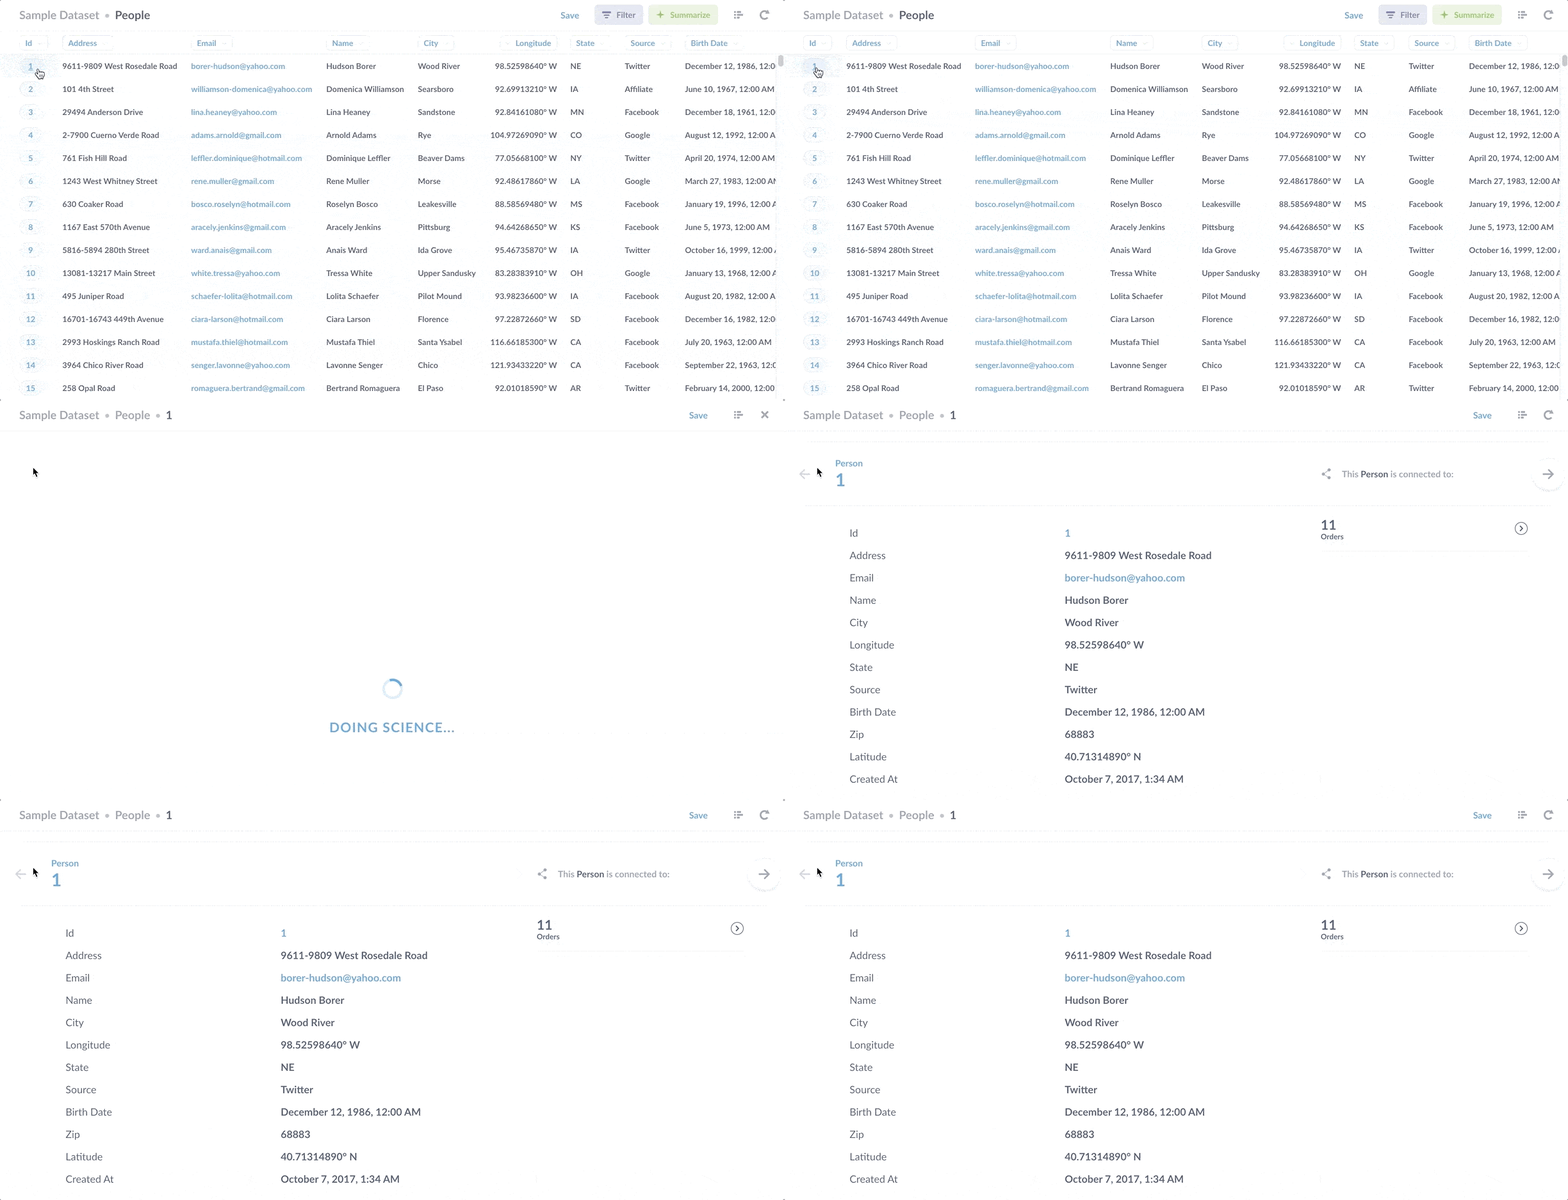
It’s nothing special, but it’s nice to have, as it makes the info easier to read. Actually, it’s a little special. The ID field we clicked on is an entity key, which is a field in a table that uniquely identifies each table row, in this case a row in the People table. (Check out our docs to learn more about how to customize your data model.) Metabase knows that it’s an entity key, and that’s how it knew to link to this detail view. Notice that on the detail page for this customer, Hudson Borer, we 1) see every field from the People table, not just the fields we included in our question, and 2) in the upper right, a link to orders associated with Hudson Borer’s user ID. If one table includes an entity key as a foreign key in another table, Metabase will make that data available to explore on this detail page.
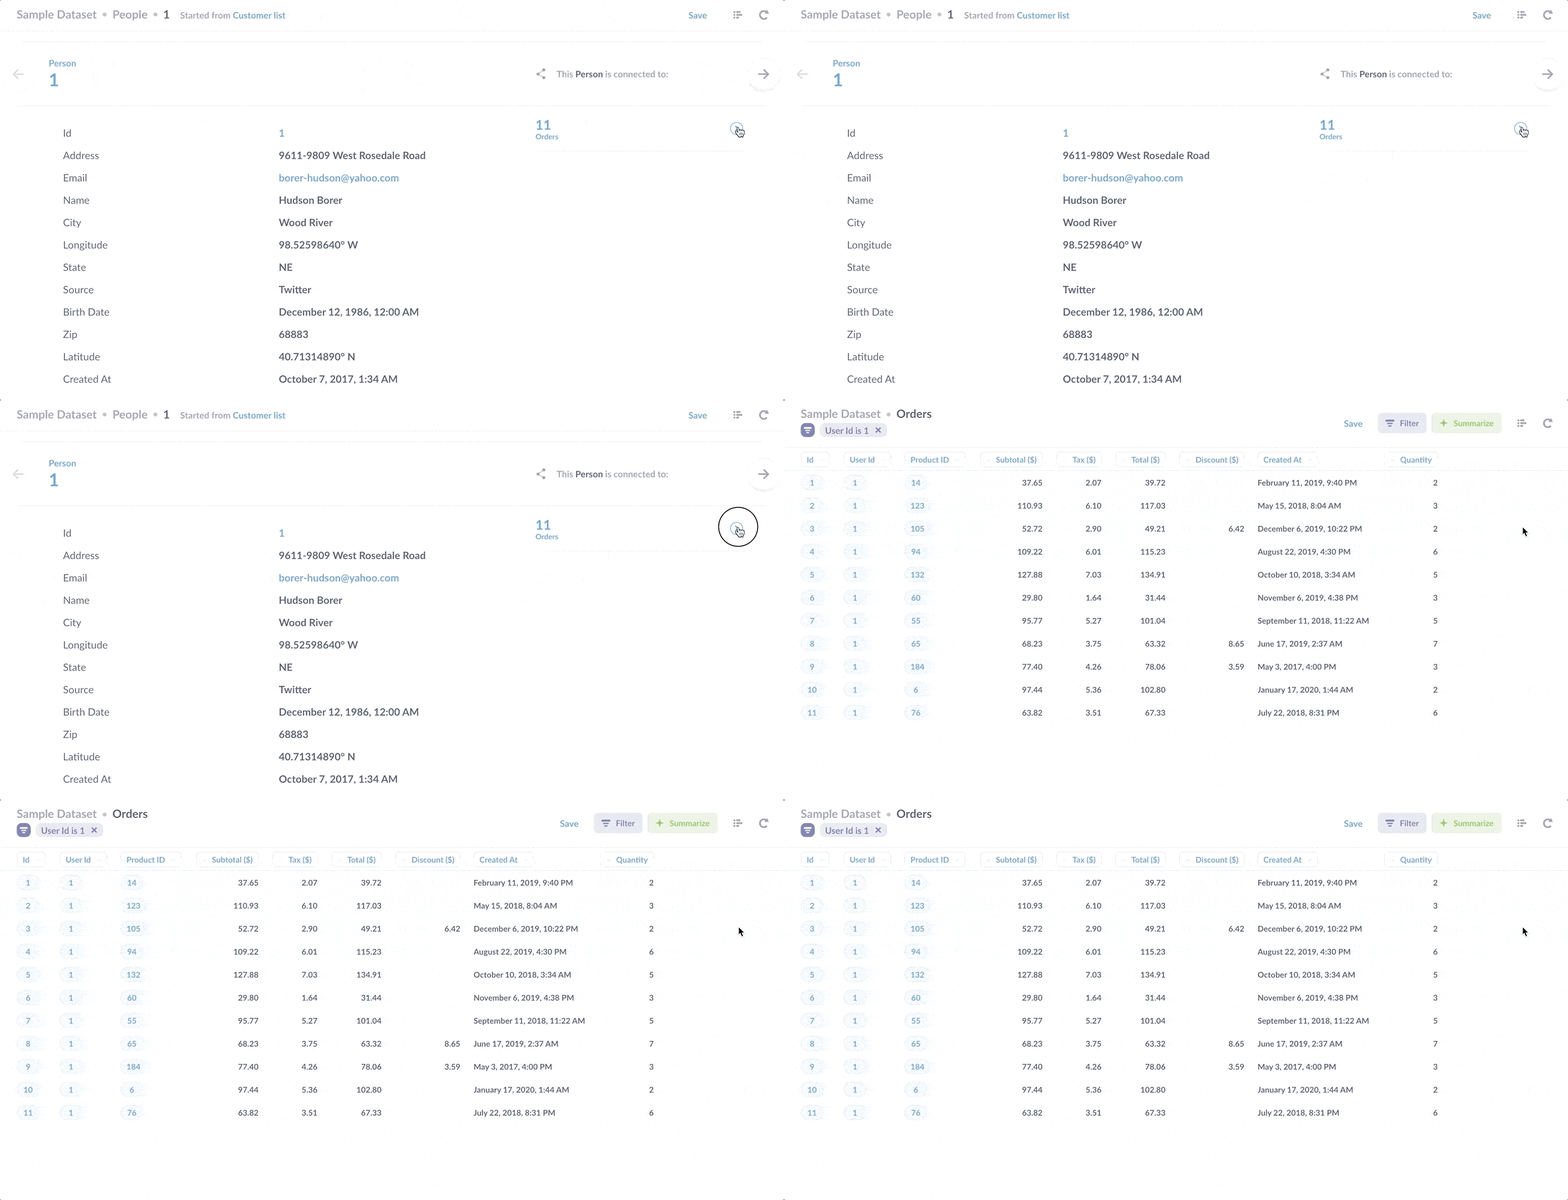
We’ve done basically nothing so far, and we’re already off to a pretty good start. To calculate how much money each customer has spent with the company, we’ll need to include order information in our list. And that requires us to join the People table to the Orders table. We’ll click on the editor icon to bring up the Query Builder**.

Next, we’ll click on the Join data option, and connect the People table to the Orders table by telling Metabase that it should link the entity key ID in the People table to the Foreign Key User_ID in the Orders table. (If you’re new to joining tables, check out our article on joins in Metabase).
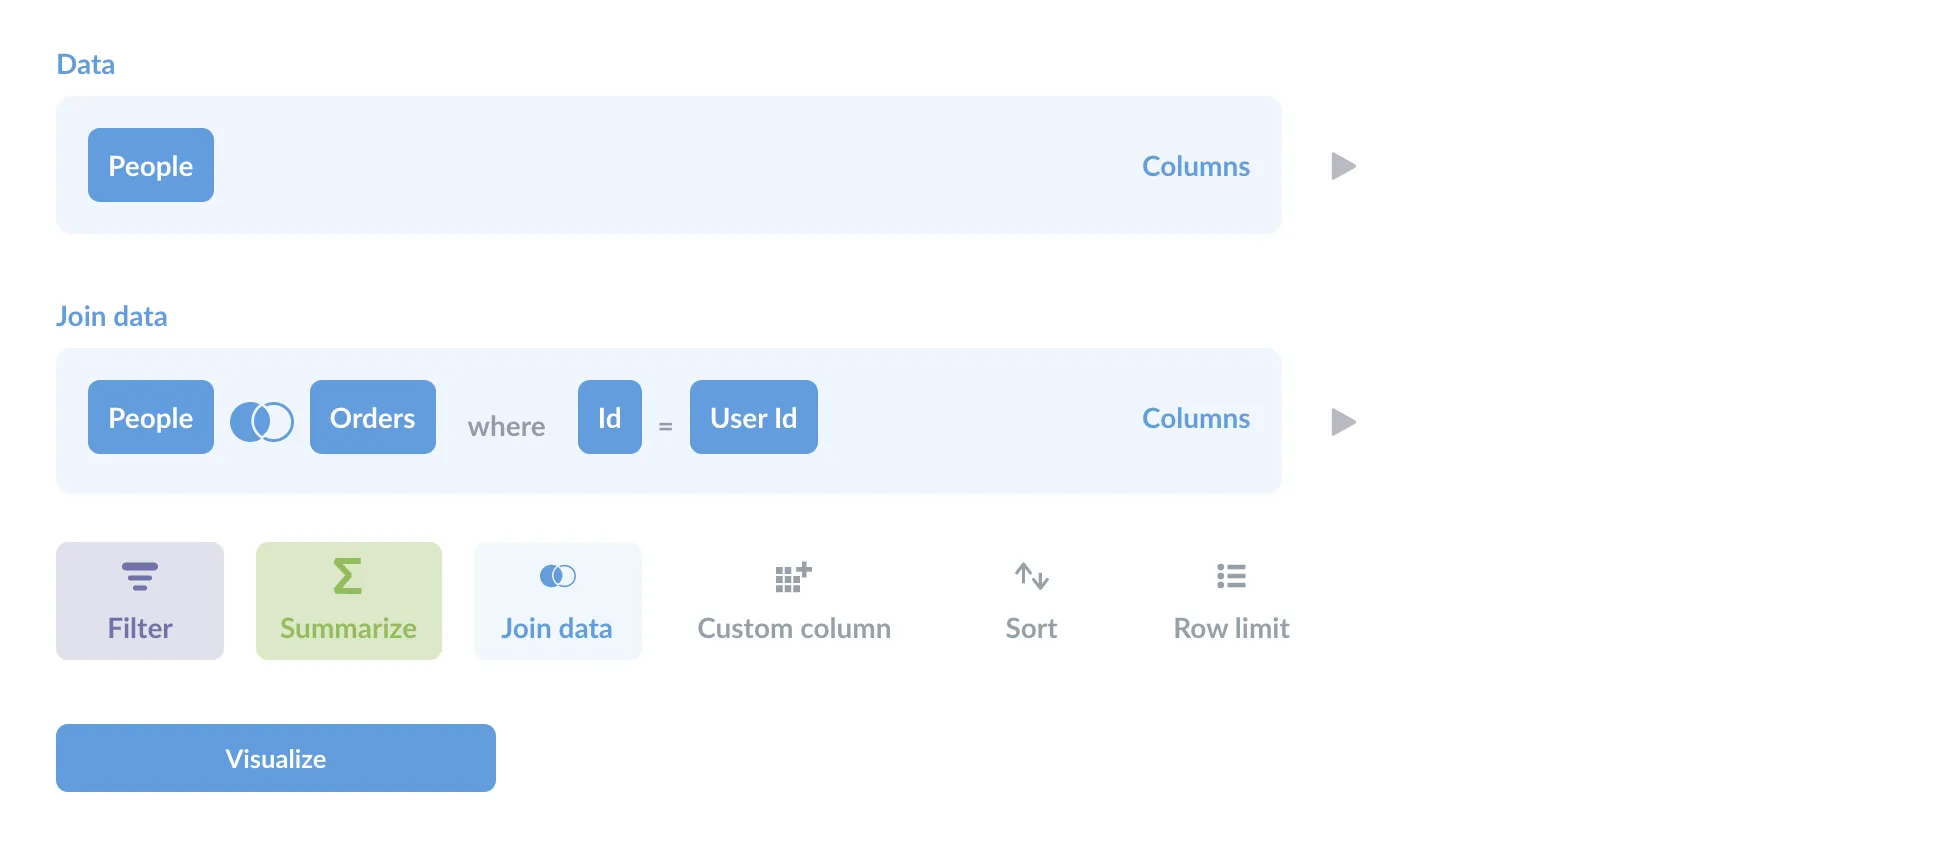
Joining the People and Orders tables will produce the table shown below, where the customer information is repeated for each order they placed.
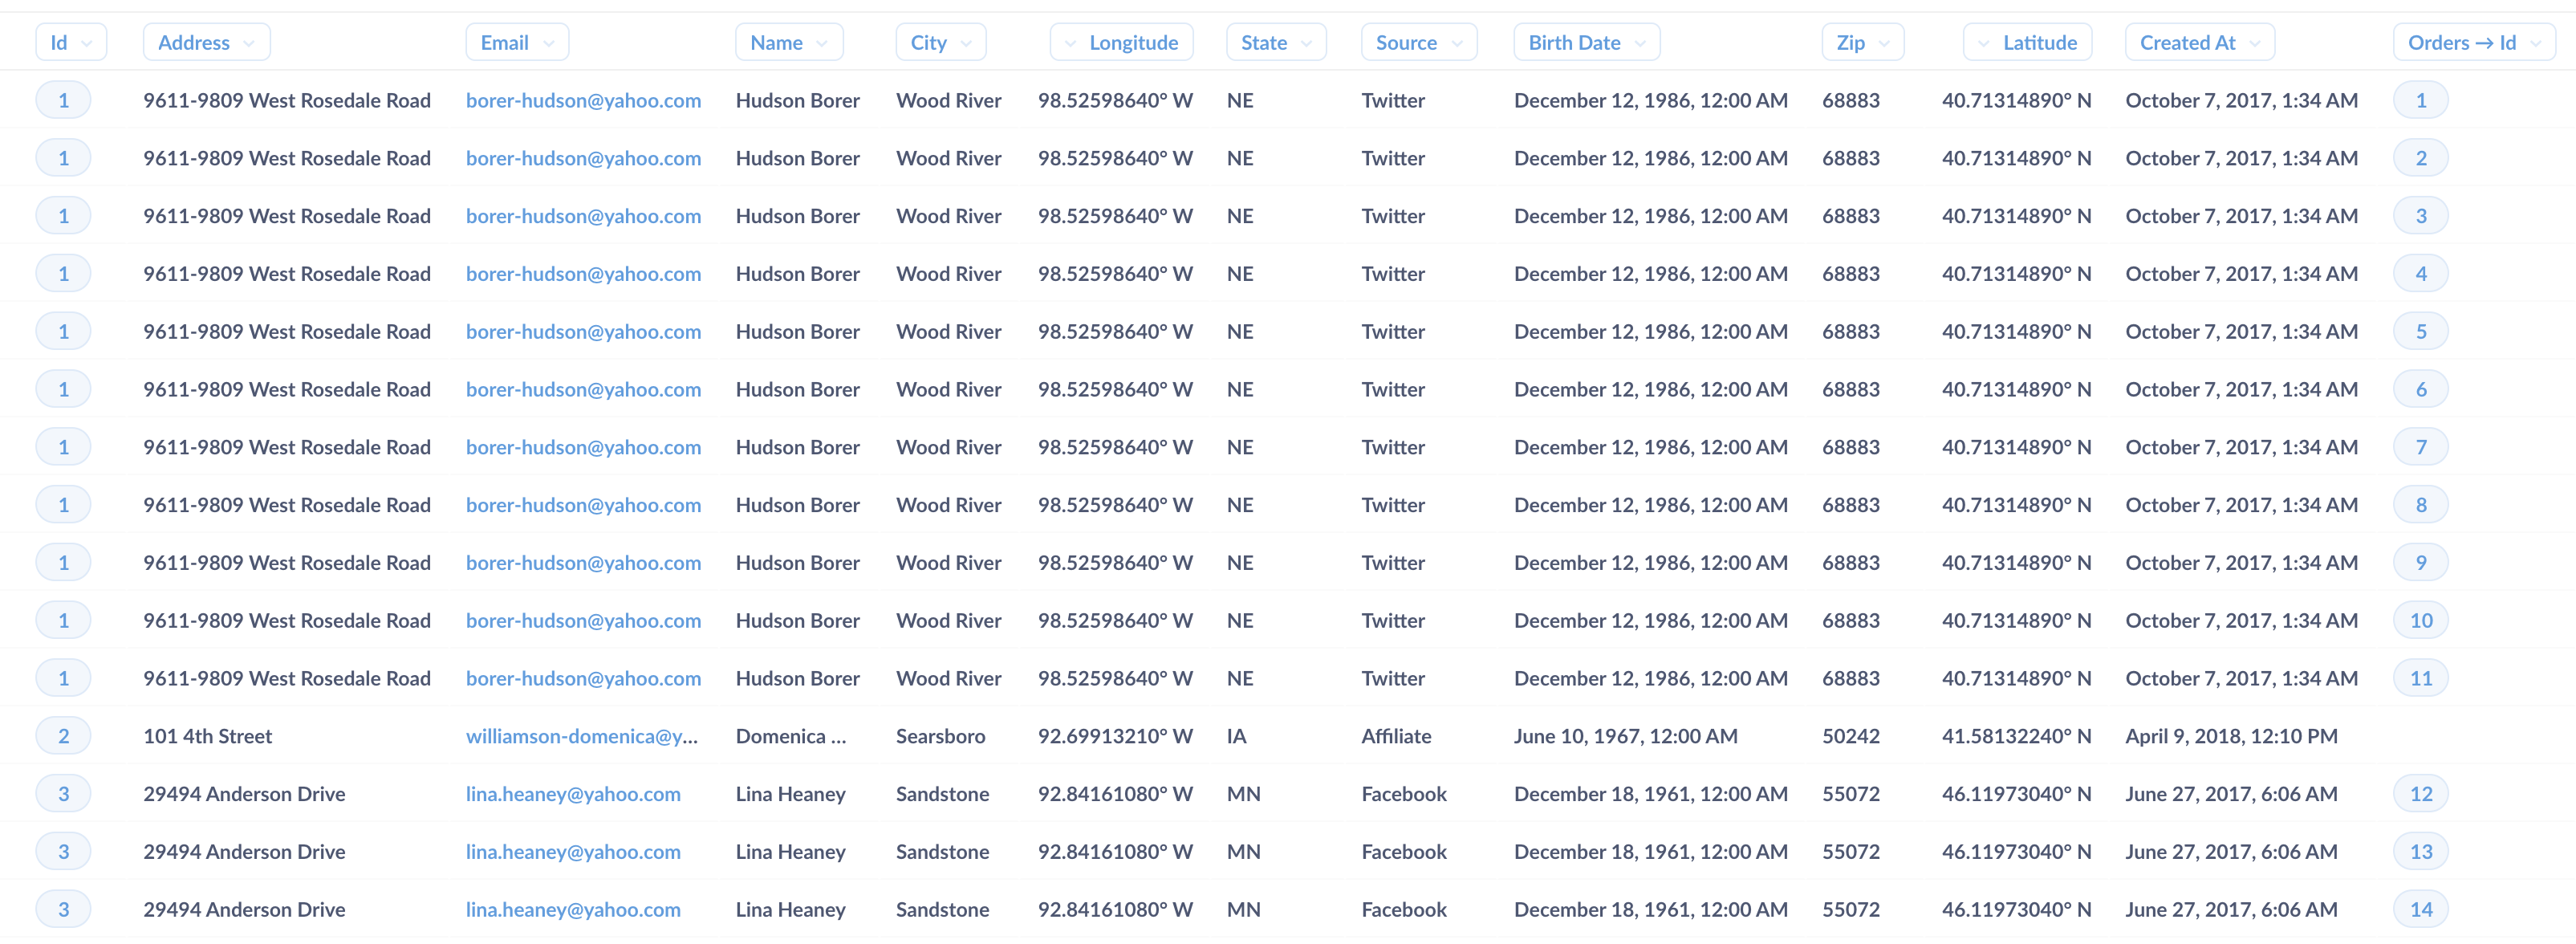
That’s not ideal: we don’t want a customer to be listed more than once in this lookup tool. If we want to see their orders, we can just click on the customers’ ID to view their detail pages, but now we have their order information to work with.
Let’s try to find the total amount of money they’ve spent with us to date. Returning to the Query Builder, we’ll select Summarize, and select Sum of. Under the joined Orders table, we’ll select Total. And since we want to see the sum for each user, we’ll group by each user’s ID.
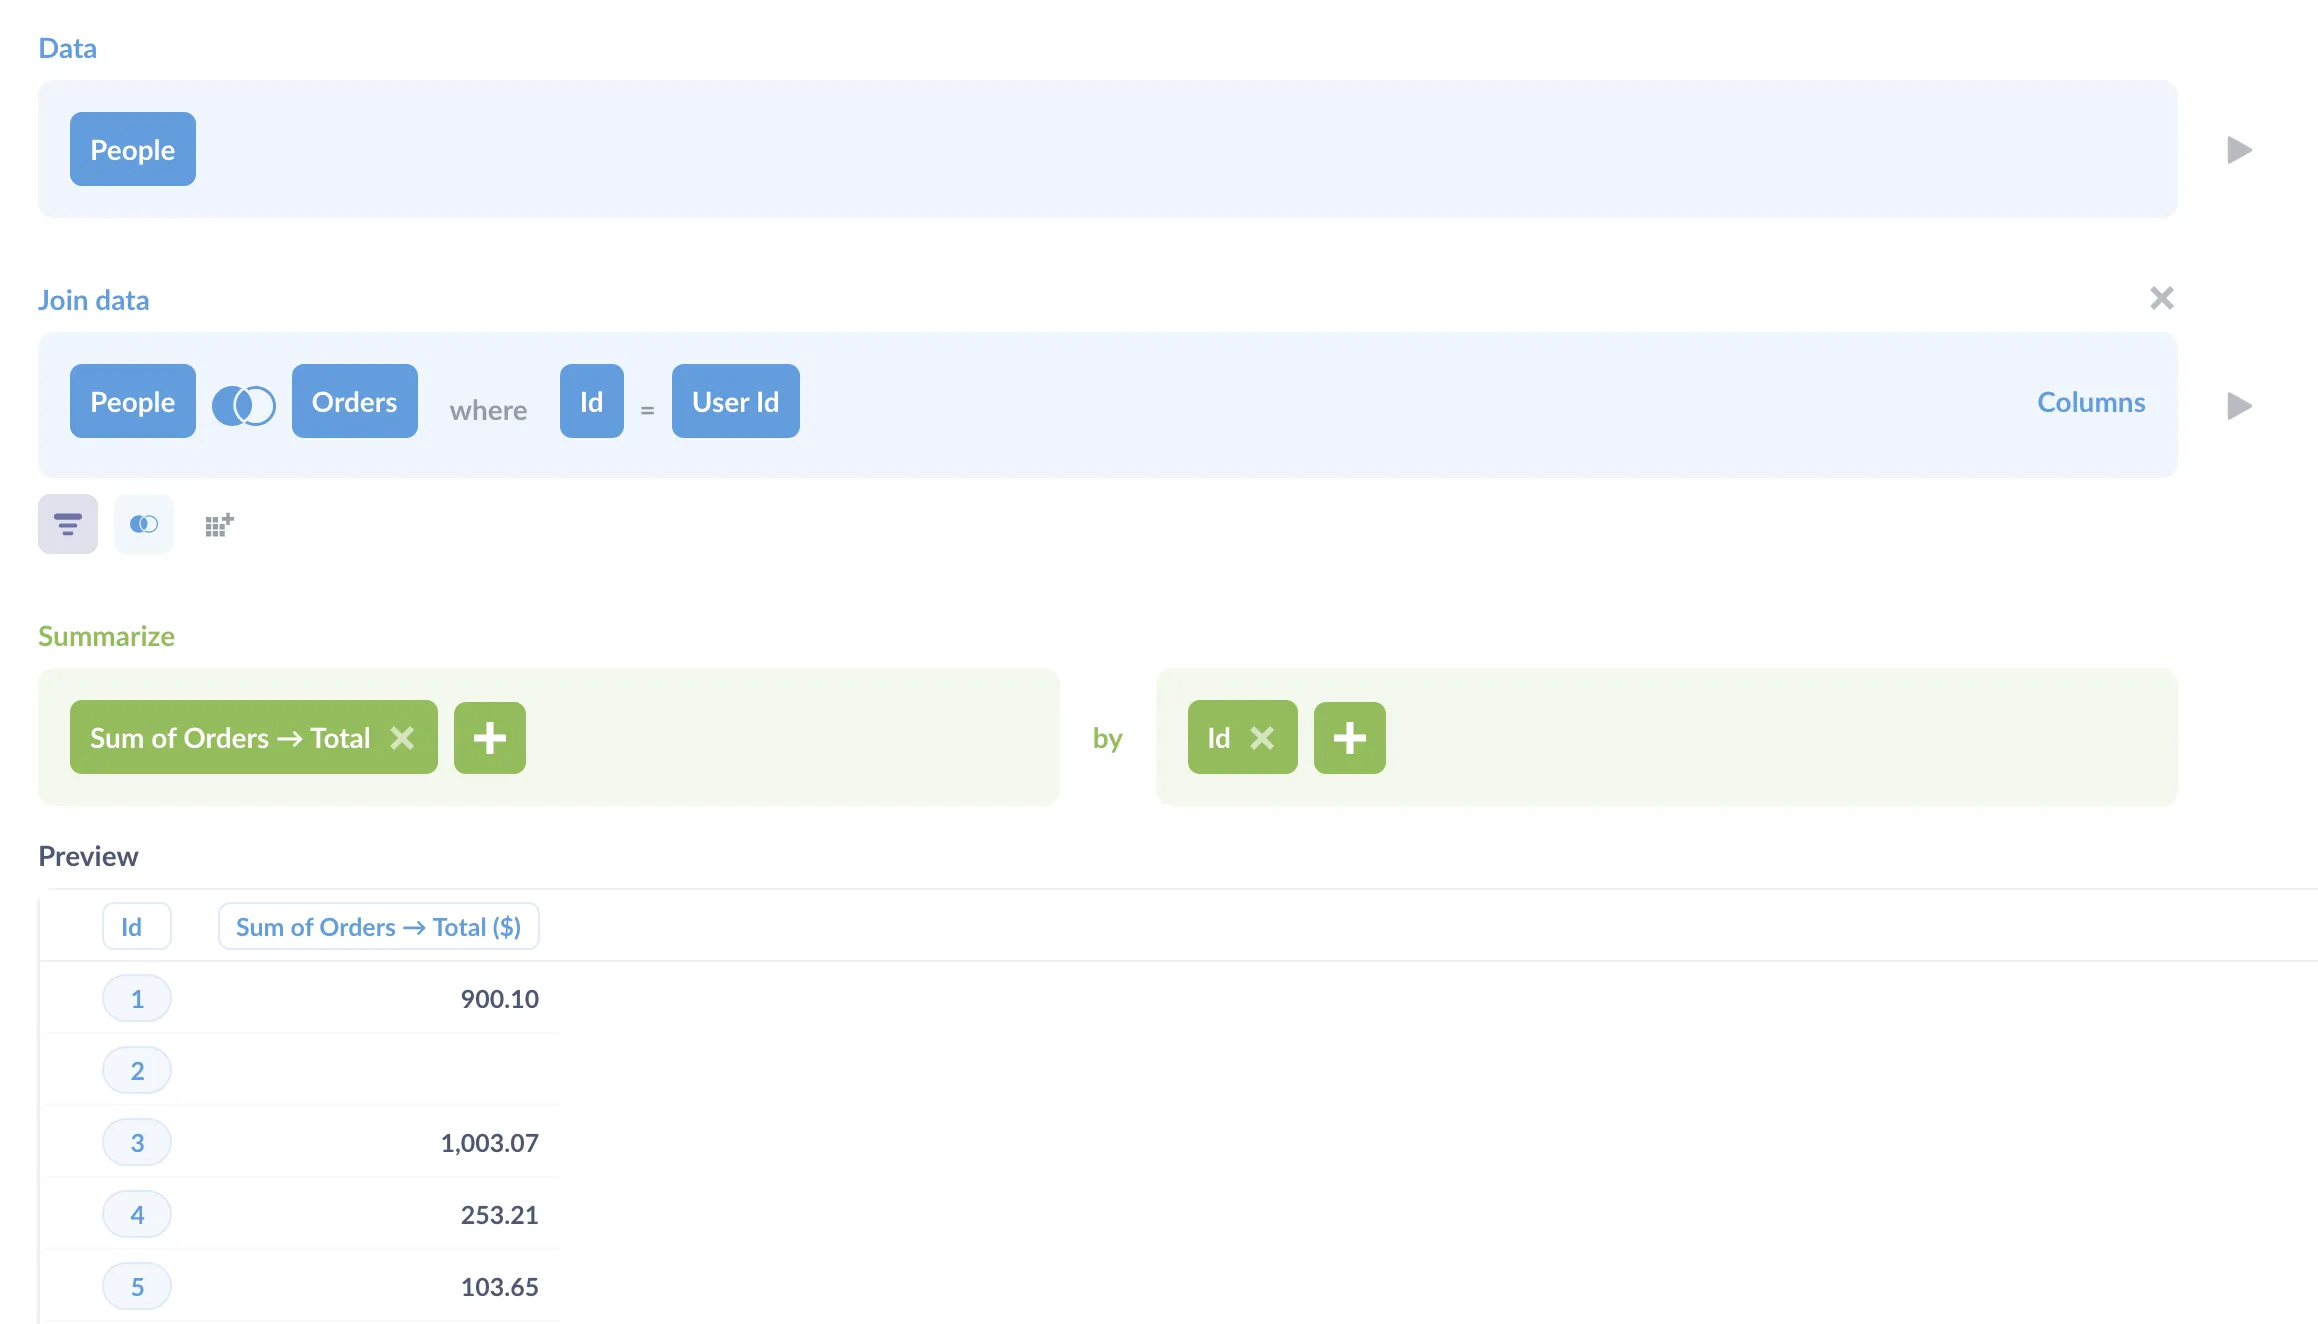
A preview shows us an updated table with just two columns: ID and our new column, Sum of Orders → Total($). We’ll also sum the discounts (Sum of Orders → Discount($)), just like we did with the order totals.
Next, we’ll add the columns we want to include in our table by adding them to the Group by box of the Summarize section. Here’s our full list of columns:
IDEmailNameCityStateZipCreated_at: MonthSum of Orders → TotalSum of Orders → Discount
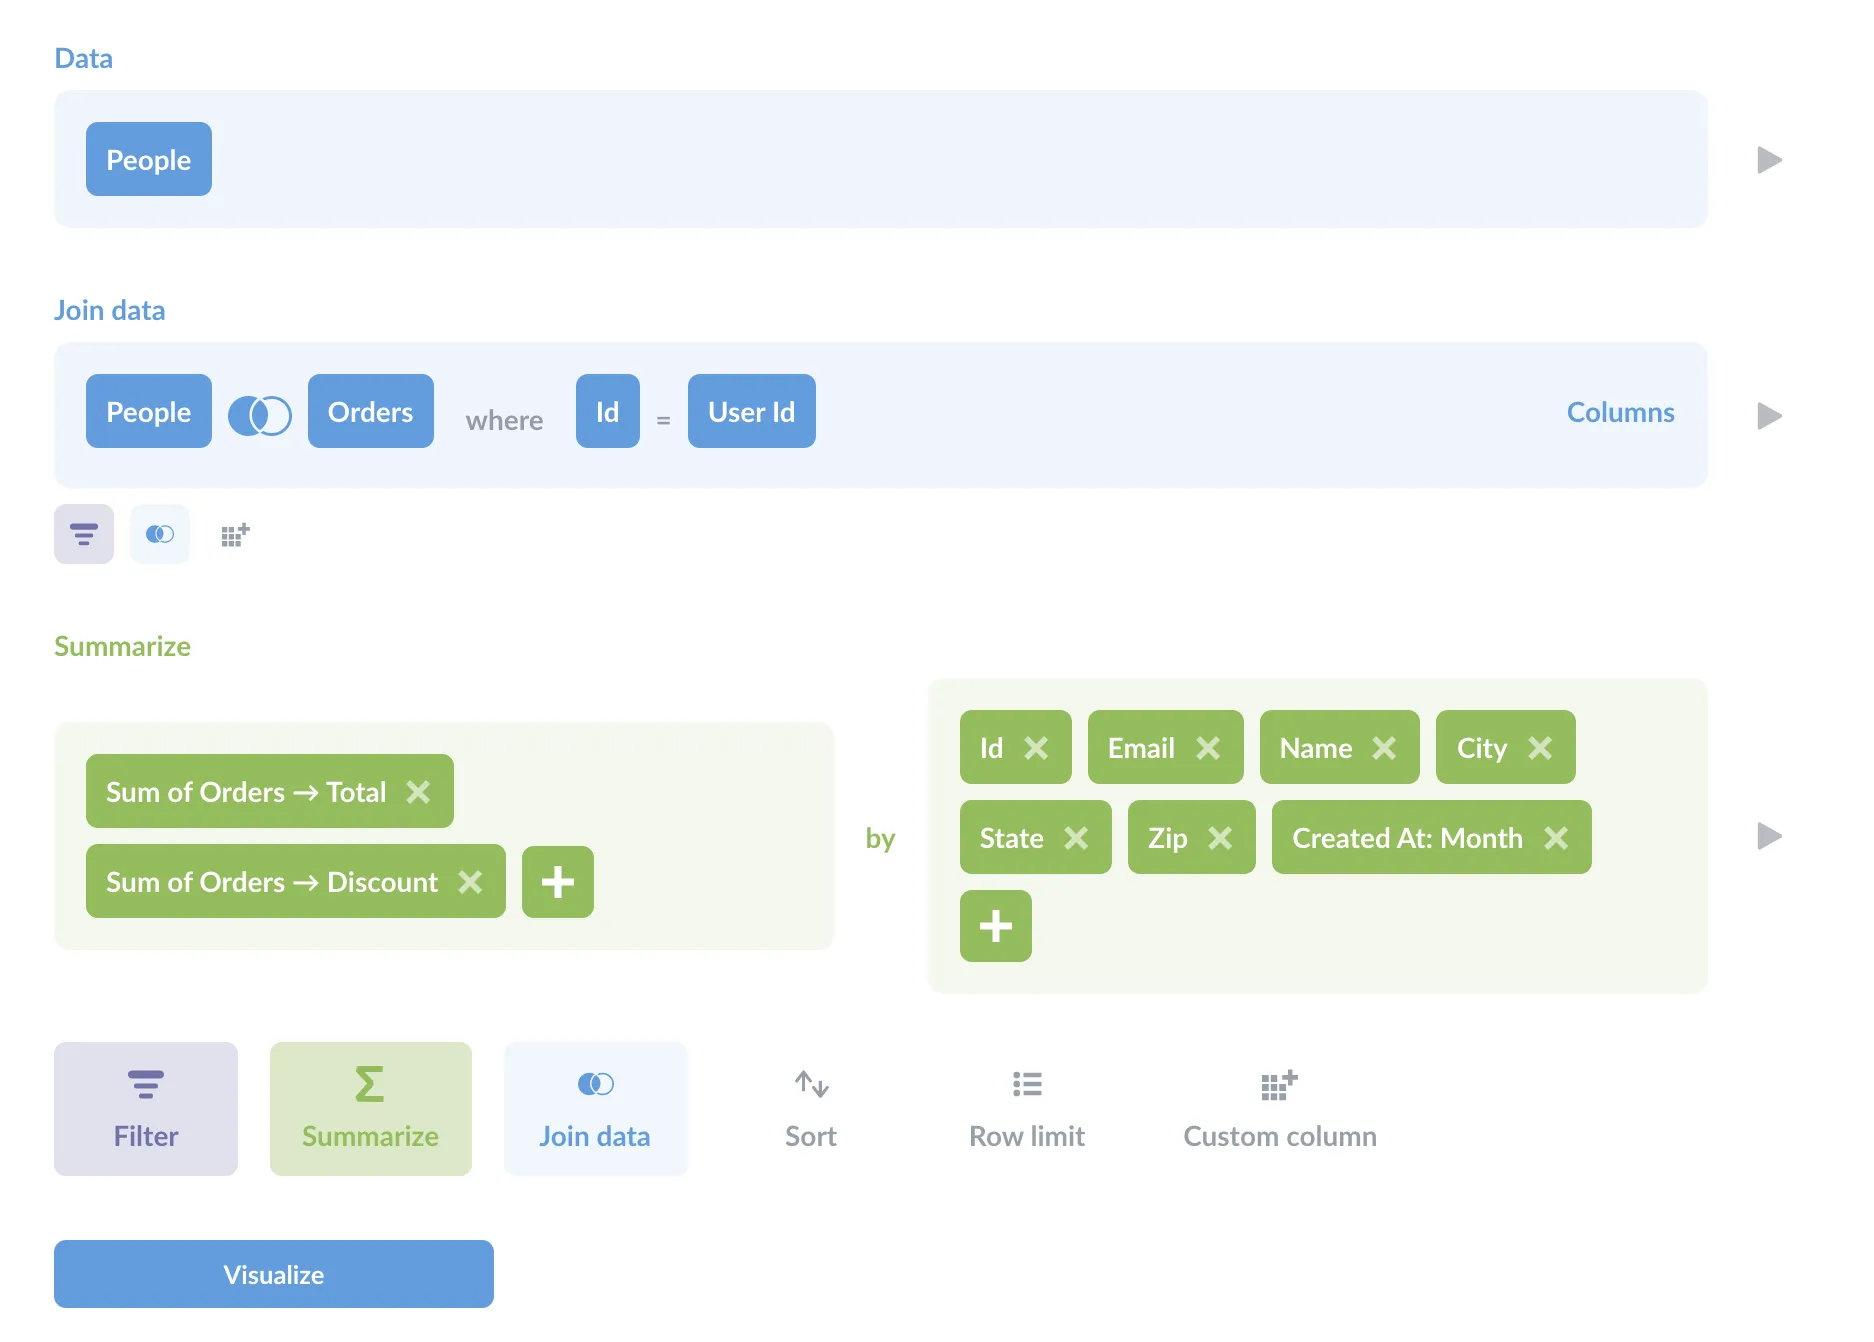
With our notebook filled out, let’s click on the Visualize button, and Metabase will present us with our list.

So far so good, but let’s see if we can spruce it up a bit. Let’s change the formatting for our aggregate columns, which we can do by clicking on the heading for that column, then clicking on the gears icon.

We’ll change Column title to “Total money spent”, toggle Show a mini bar chart, and set Where to display the unit of currency to every cell.
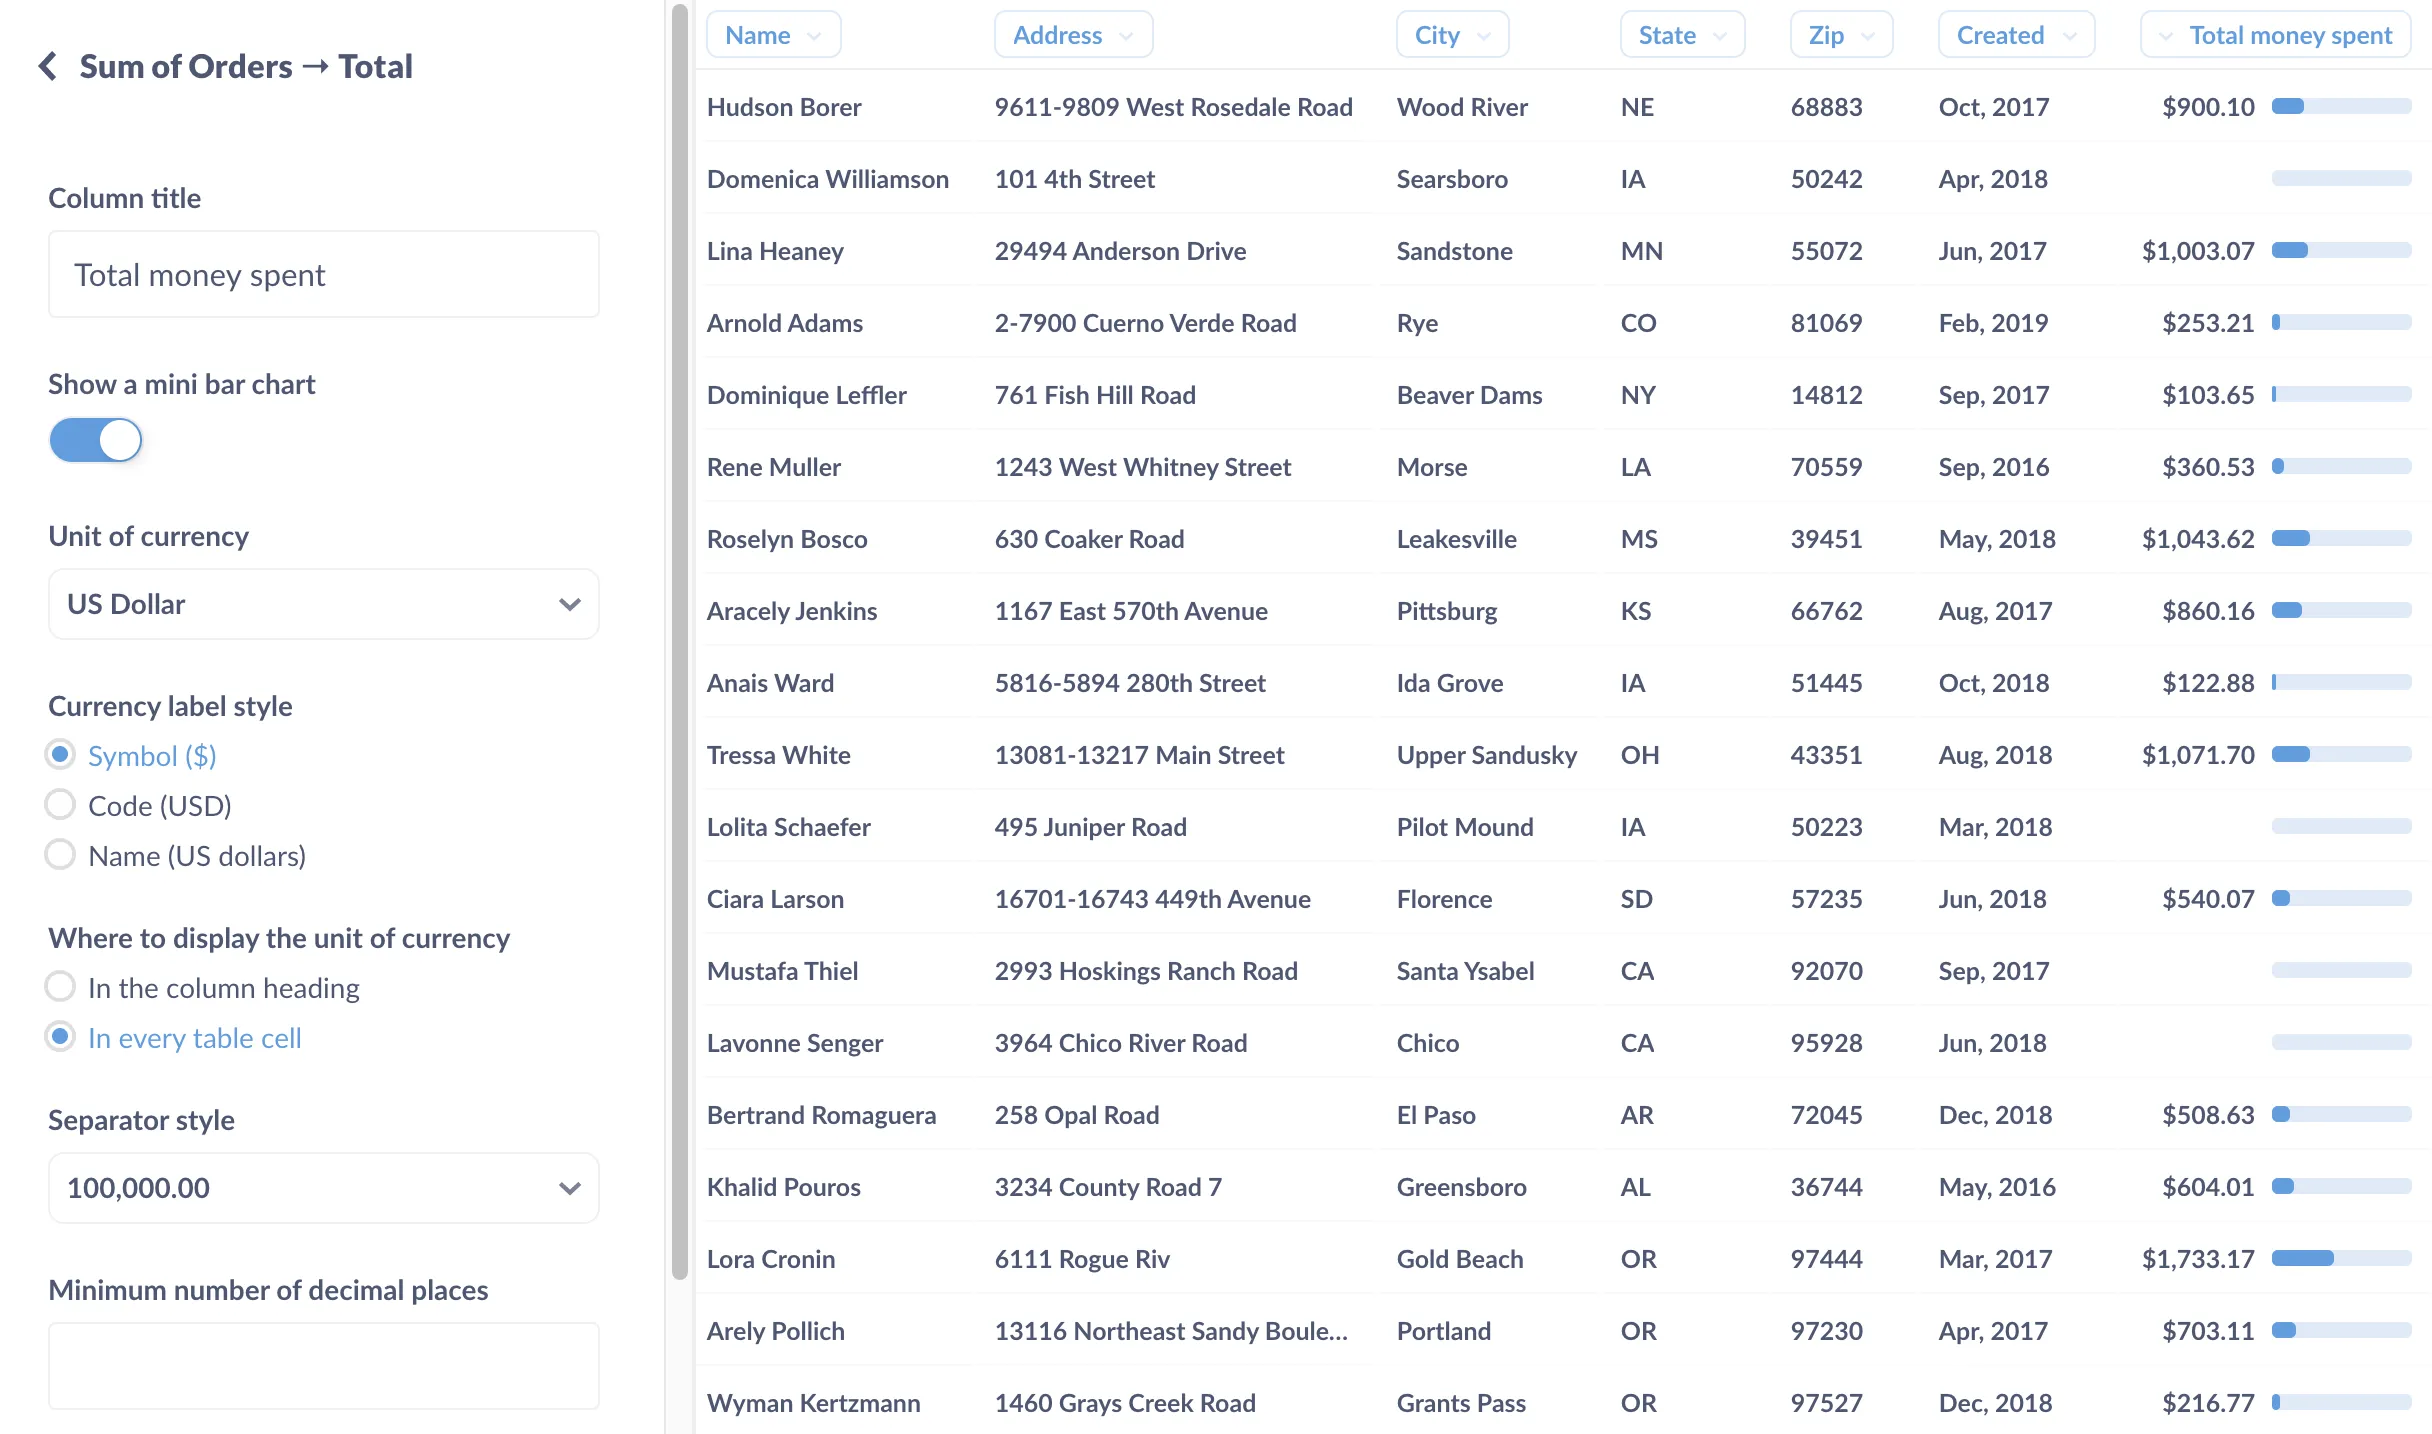
The mini bar chart will show the cell’s value relative to the range of values in the column, which makes it easy to see how much money our customers spend compared with other customers.
We’ll do the same for the discount total column: add mini bar chart, rename heading, show currency in every cell.

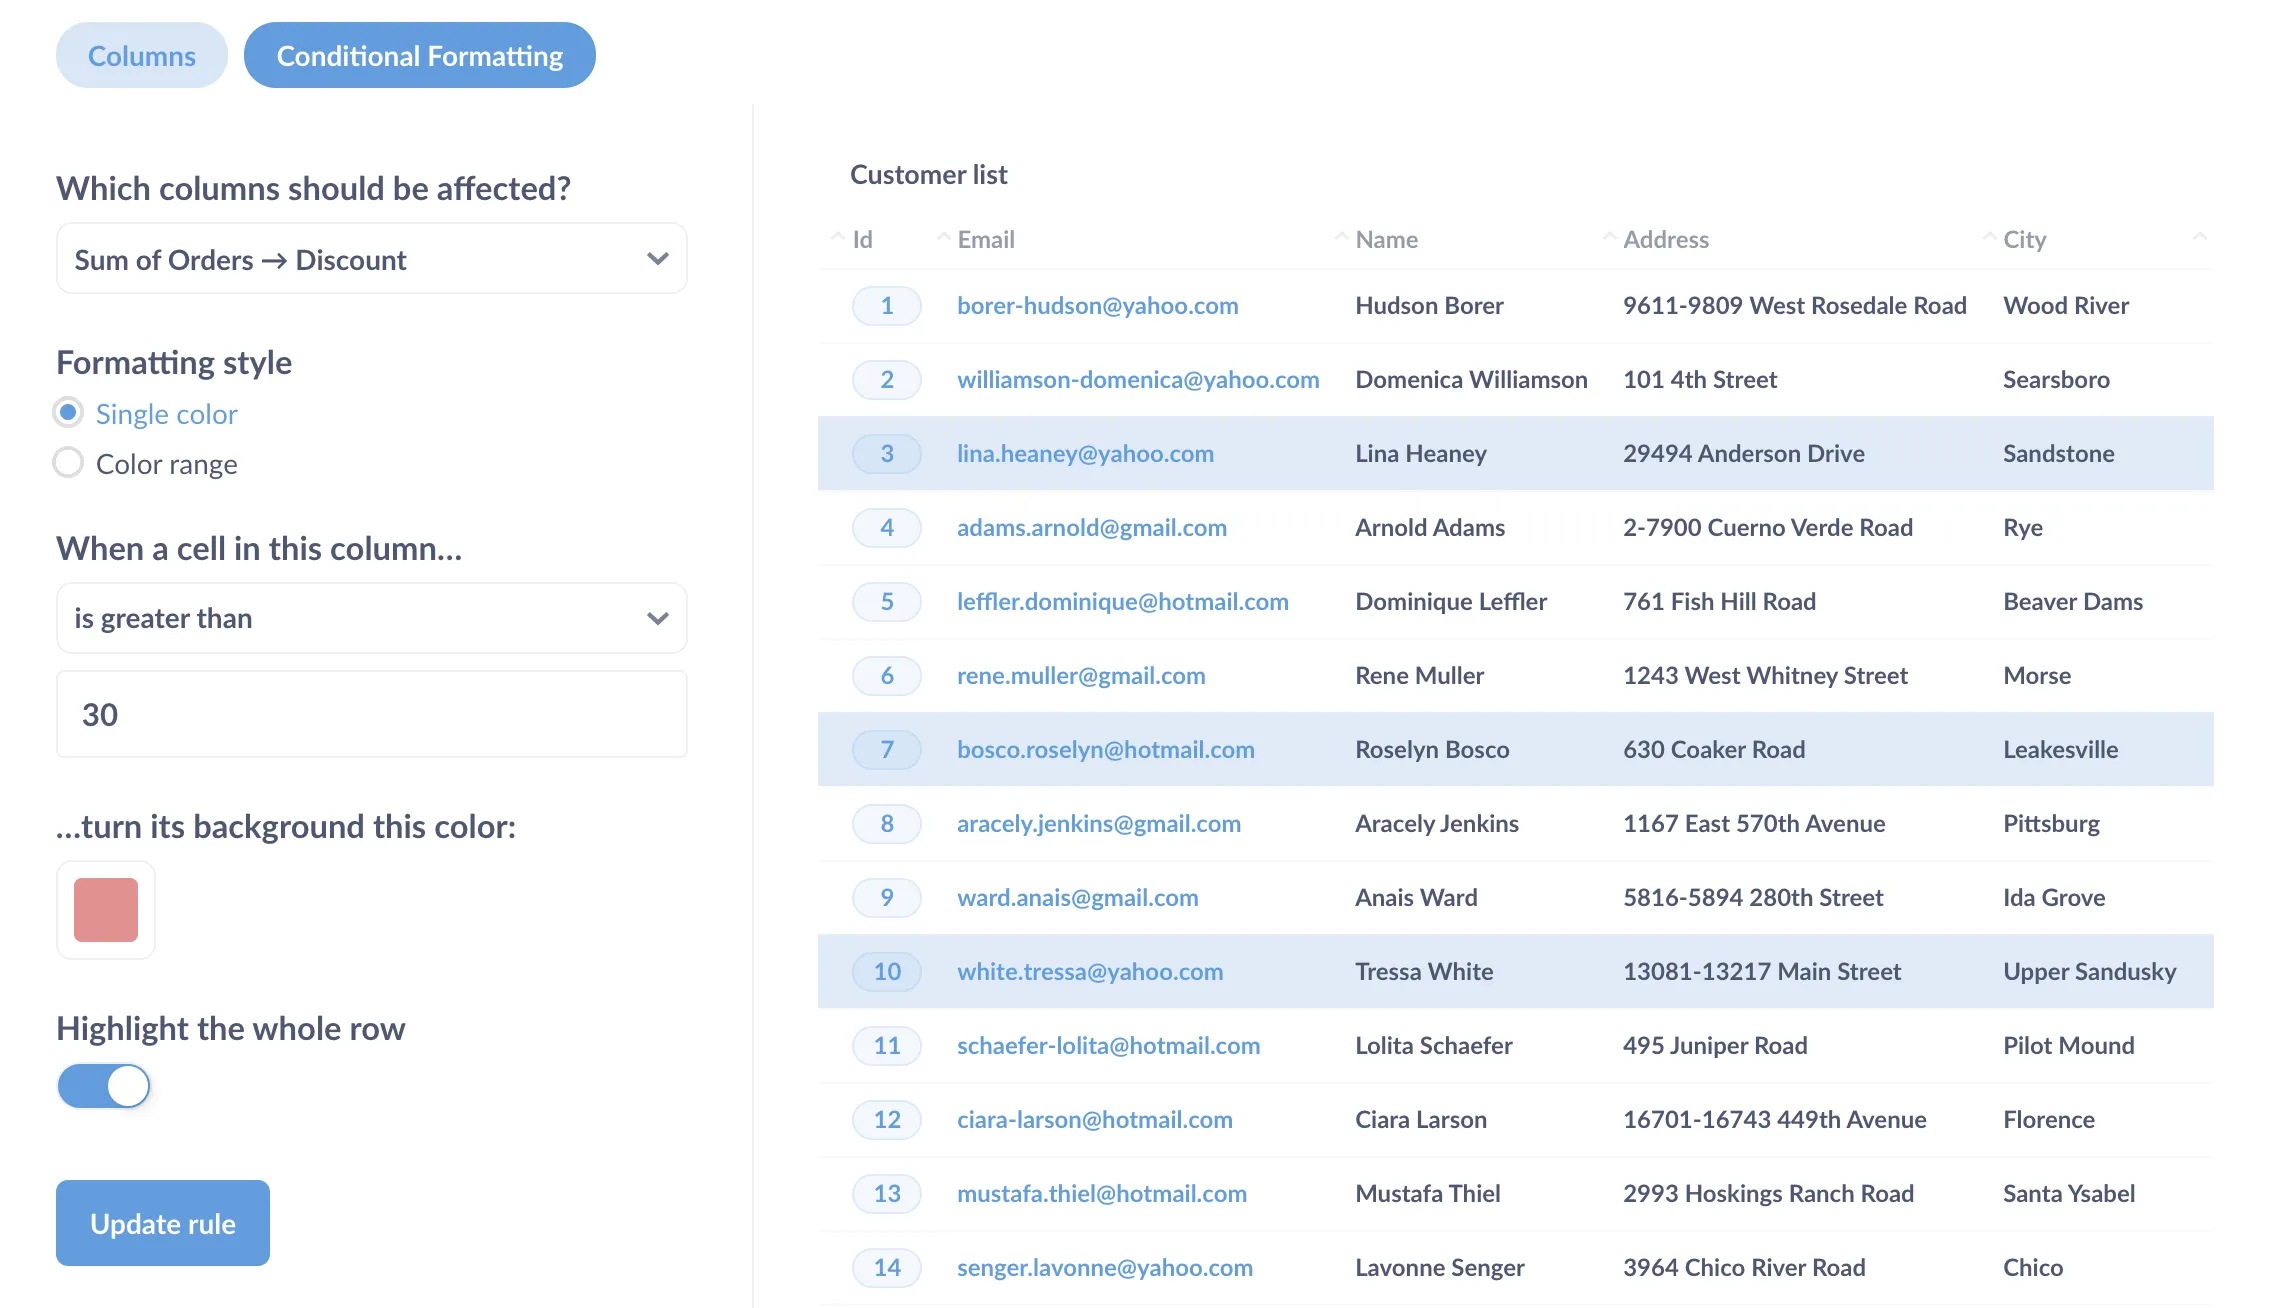
We can also throw in some conditional formatting for the table as a whole. In the bottom left of our screen, we’ll click on the Settings button for the question, and Metabase will slide out the Settings sidebar. At the top of the sidebar, we’ll select the Conditional formatting tab. For example, we can highlight the row in blue for big spenders (customers who’ve dropped more than $1,000 on our products), and highlight rows in red if we’ve given them more than $30 in discounts (so we know we should probably cool it on the discounts for that customer).
With our list all dressed up, let’s save it as Customer list.
Add our question to a dashboard
To be able to look up a customer, we’ll need to be able to filter this table by ID and name. We could filter at the question level, but in this case it’s better to have our list be in a dashboard: it gives us more options, like being able to have a filter widget that can filter additional lists or charts we might want to add in the future, or allowing us to customize what happens when people click on a value in a column.
We’ll create a new dashboard and title it (literally) “Customer lookup tool.” Next, we’ll add our Customer list question to our new dashboard.
Add filters to the dashboard
Since we want people to be able to look up customers by either their ID or Name, we’ll need to add a filter widget for each lookup method. To add filters, we’ll click on the pencil icon to edit the dashboard, then click on the filter icon. We’ll add an ID filter for the ID filter widget, and a Category filter for the Name filter widget.

We’ll connect each filter to the Customer list card (the “ID” filter to Person.ID and the Category filter to Person.Name). To make it clear for our users what each filter does, we’ll change the filters’ labels to Customer ID and Customer name. Check out our docs on dashboard filters to learn more about how to wire these up.

If the filter doesn’t behave like you expect, you may need to change the field type in the data model. Check out our docs on editing metadata, which shows you how you can choose whether to have the filter display a list of all available values, or as a search box.
Customize click behavior
When you’re building a customer lookup tool, you may want to set up your list so that clicking on a value like a customer name or ID or whatever will take you to a different dashbooard, third-party app, or even your own app. To do this, you can customize click behavior on a dashboard card and set up a custom destination. Just to demo the feature, we’ll set it up so that when people click on the person’s address, it’ll open up Google Maps with that address pre-loaded.
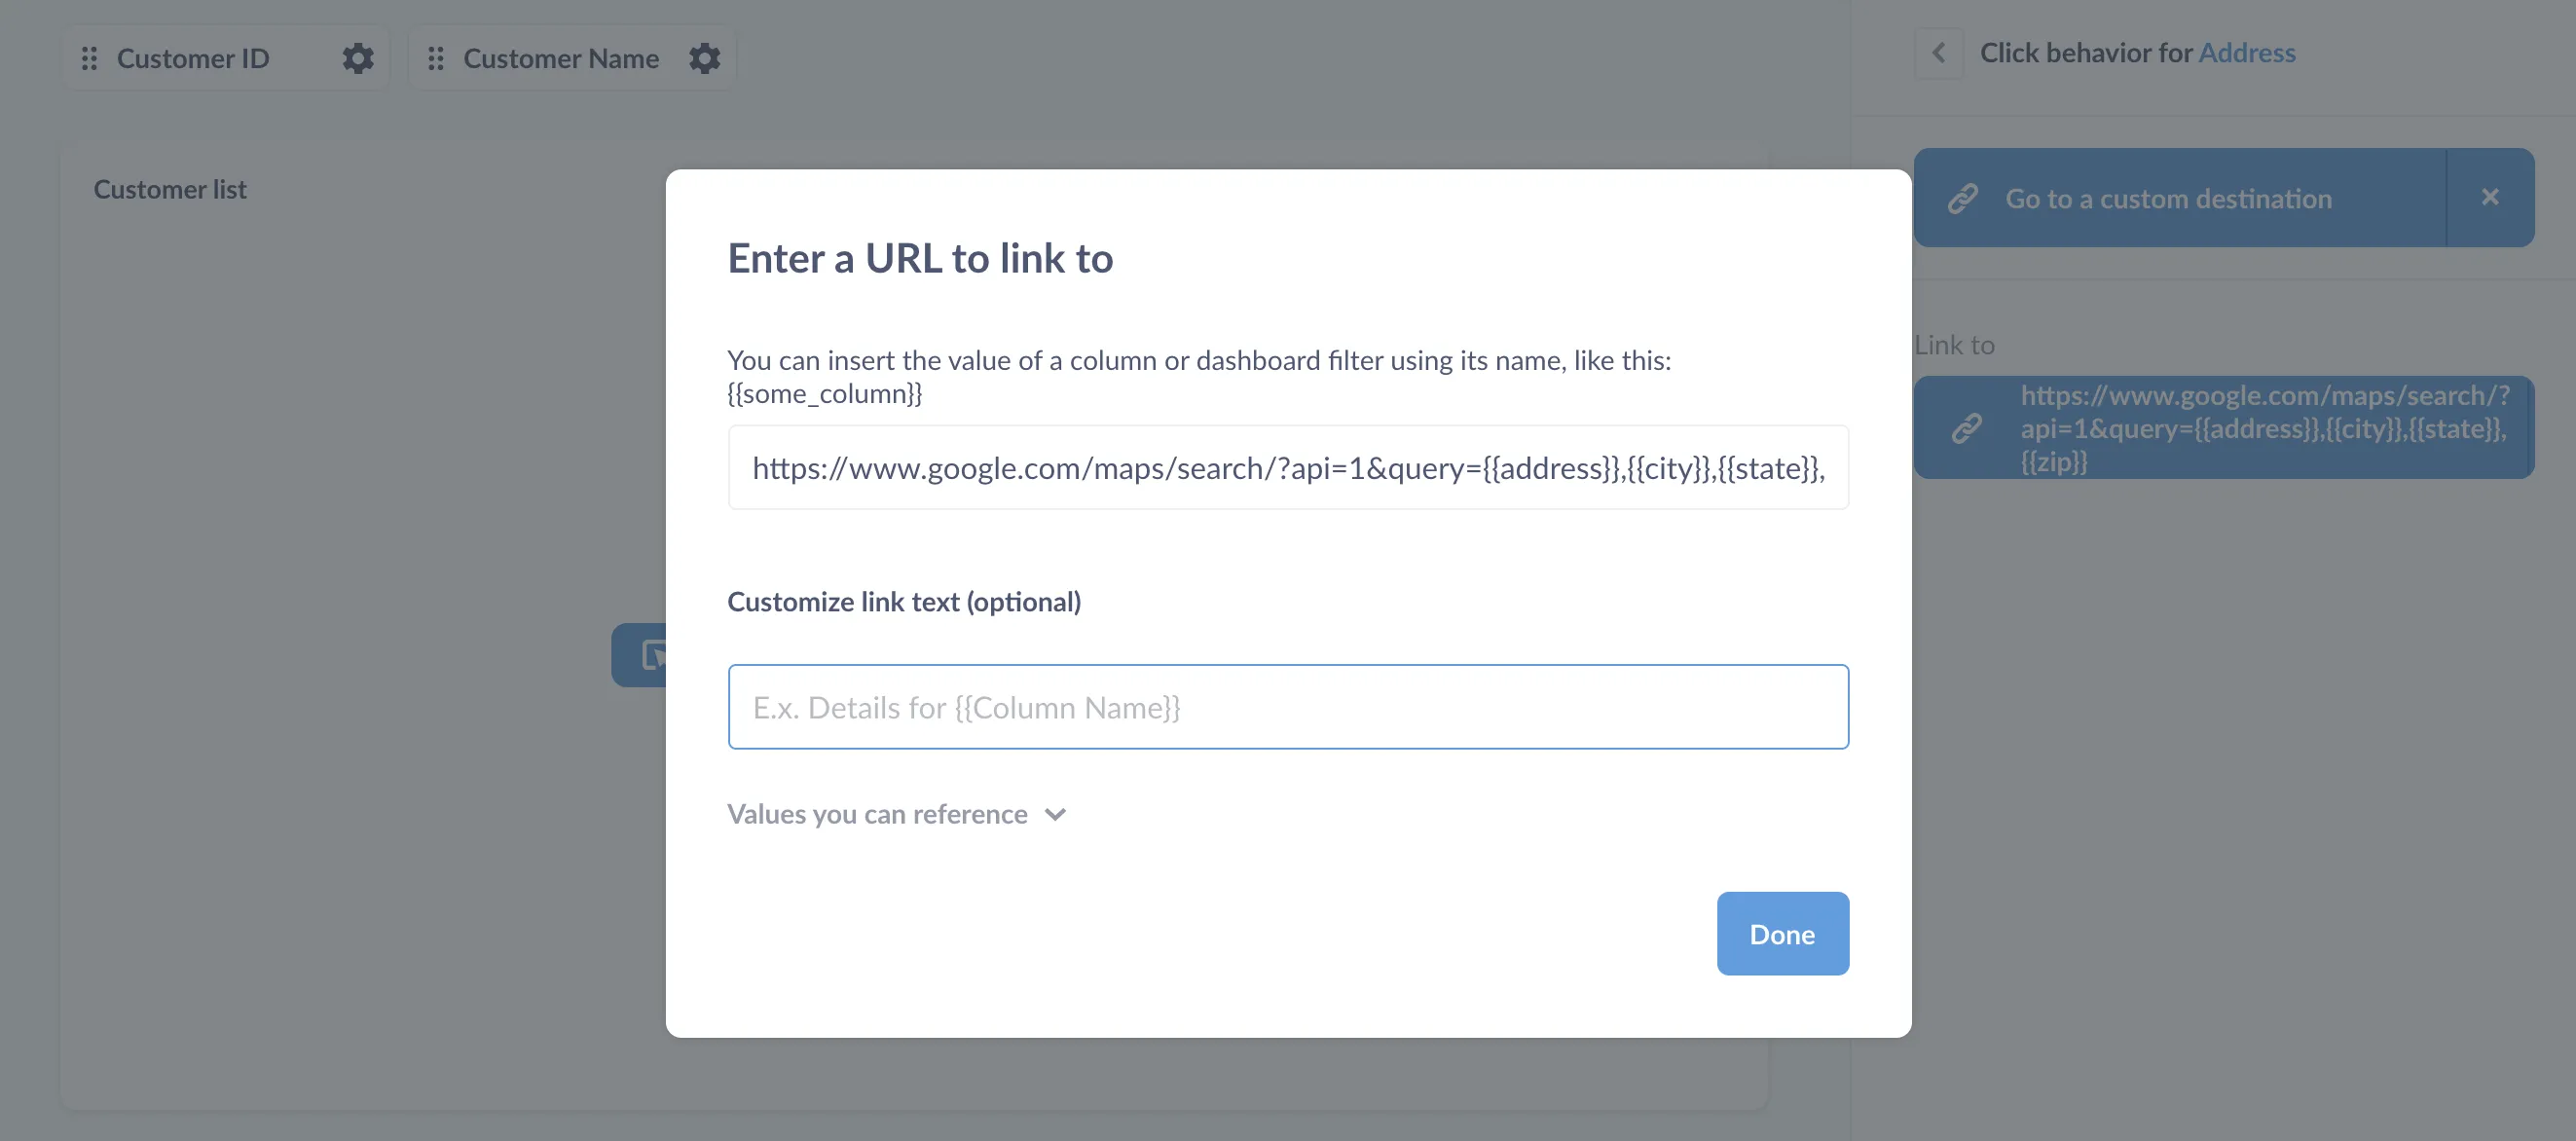
We can click on the Values you can reference dropdown to see which values we can plug in as parameters. Based on Google Maps API documentation, we’ll format the URL as follows:
https://www.google.com/maps/search/?api=1&query={{address}},{{city}},{{state}},{{zip}}
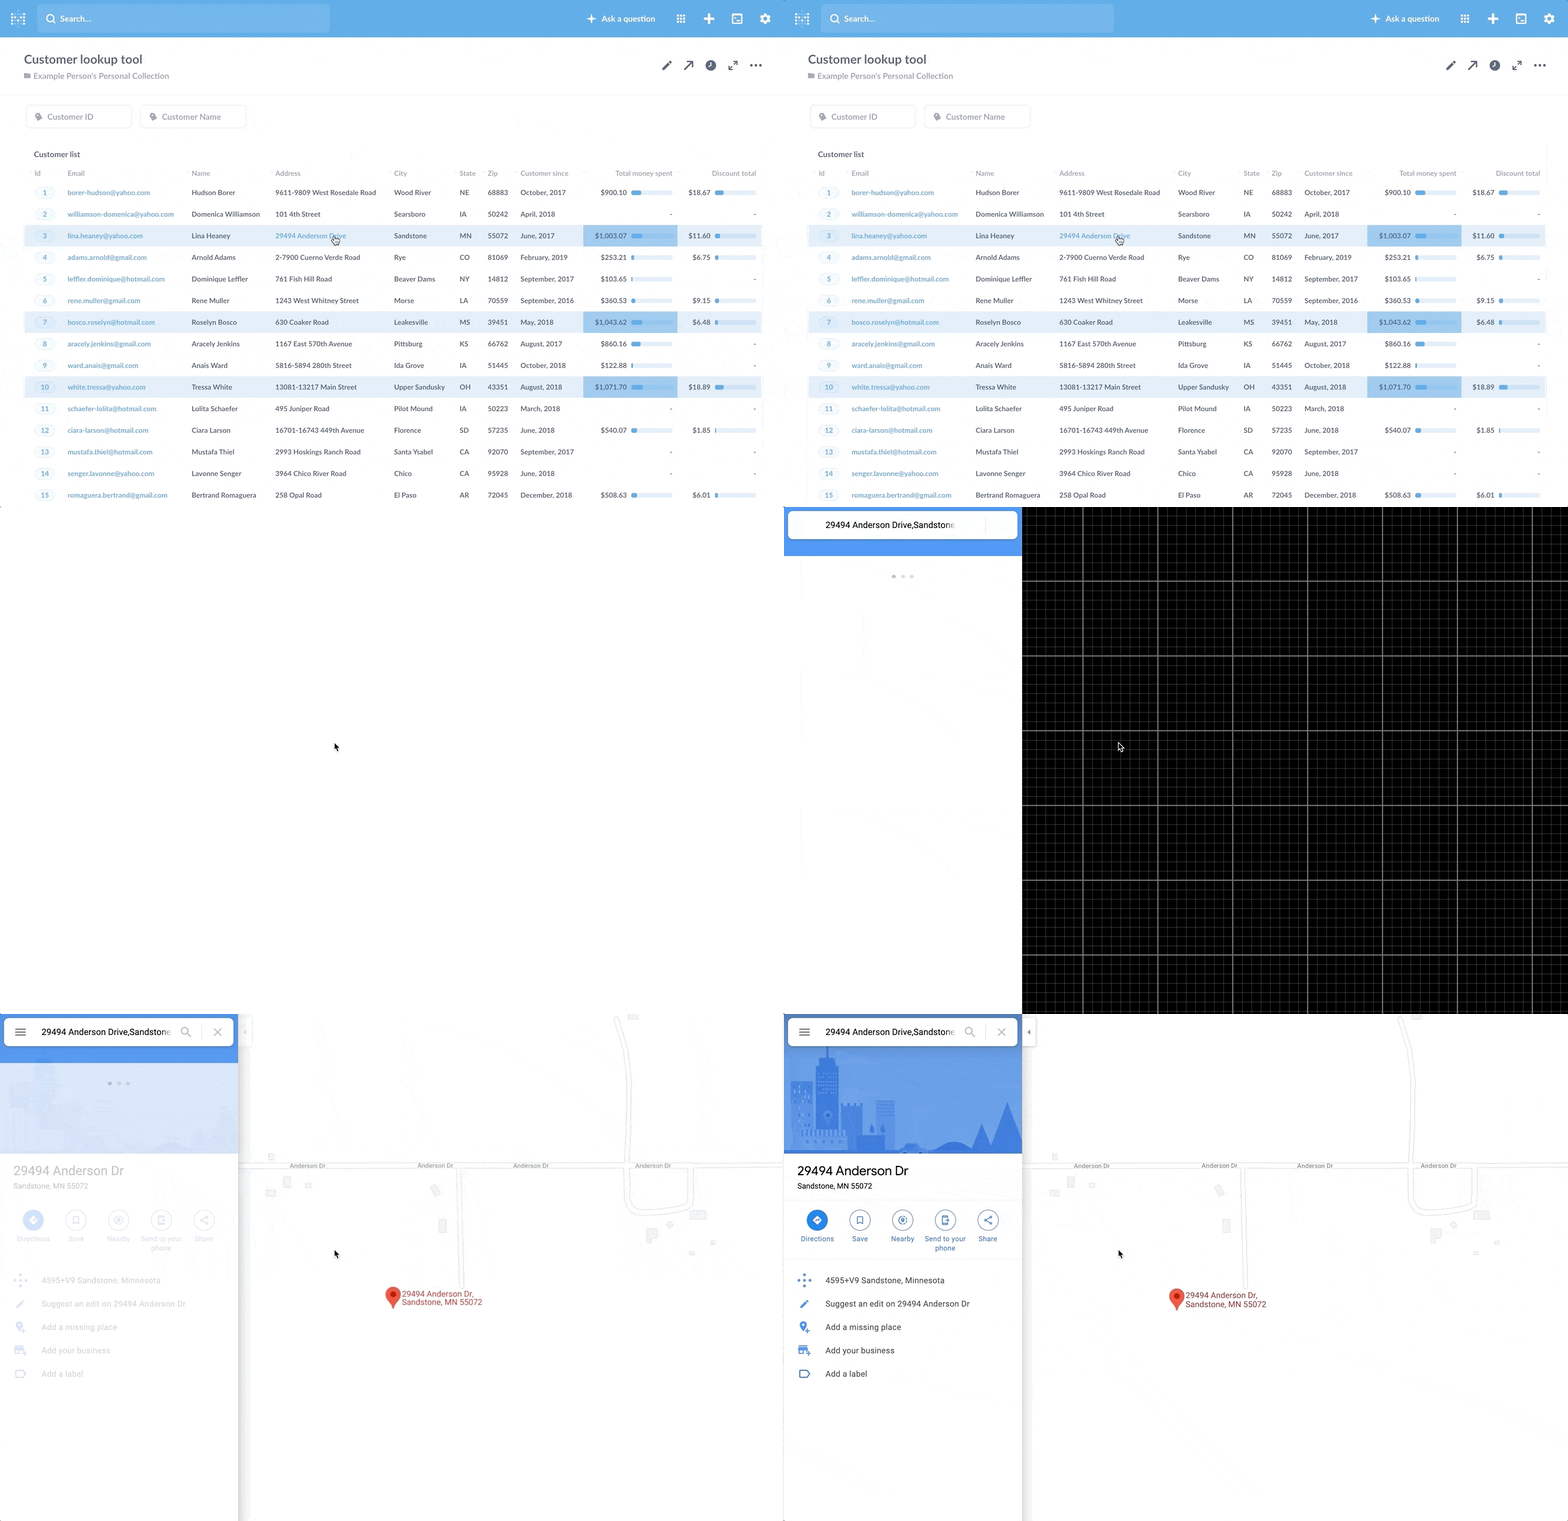
The parameters we pass are enclosed in double braces: address, city, state, and zip, and Metabase will escape the commas for us. Once we save the custom destination, we can now click on an address and Metabase will open the address in Google Maps.
Embed the tool in your wiki or app
You can leave the lookup tool in your Metabase instance, but you can also embed the tool in other apps, like your organization’s wiki or homegrown app. Check out our article on embedding charts and dashboards.
And that’s it!
Or is it? We now have a decent customer lookup tool to work with, and we can extend the dashboard as we go. We can add other questions and other filters to our dashboard, or set up more custom destinations to link to additional dashboards and tools. We hope this article gave you some ideas for some tools you can build—or for upgrading your existing dashboards.

