


How to do funnel analysis
Track how individuals progress through a multi-step process and where they exit.
Most people who land on your site never sign up, try your product, or make it to checkout. Where do they go? What made them leave? And how many made it to each step?
In this guide, you’ll learn how to find those answers using funnel analysis, along with what data you need, how to carry out the analysis, and how to try it yourself with a sample dataset.
What is funnel analysis?
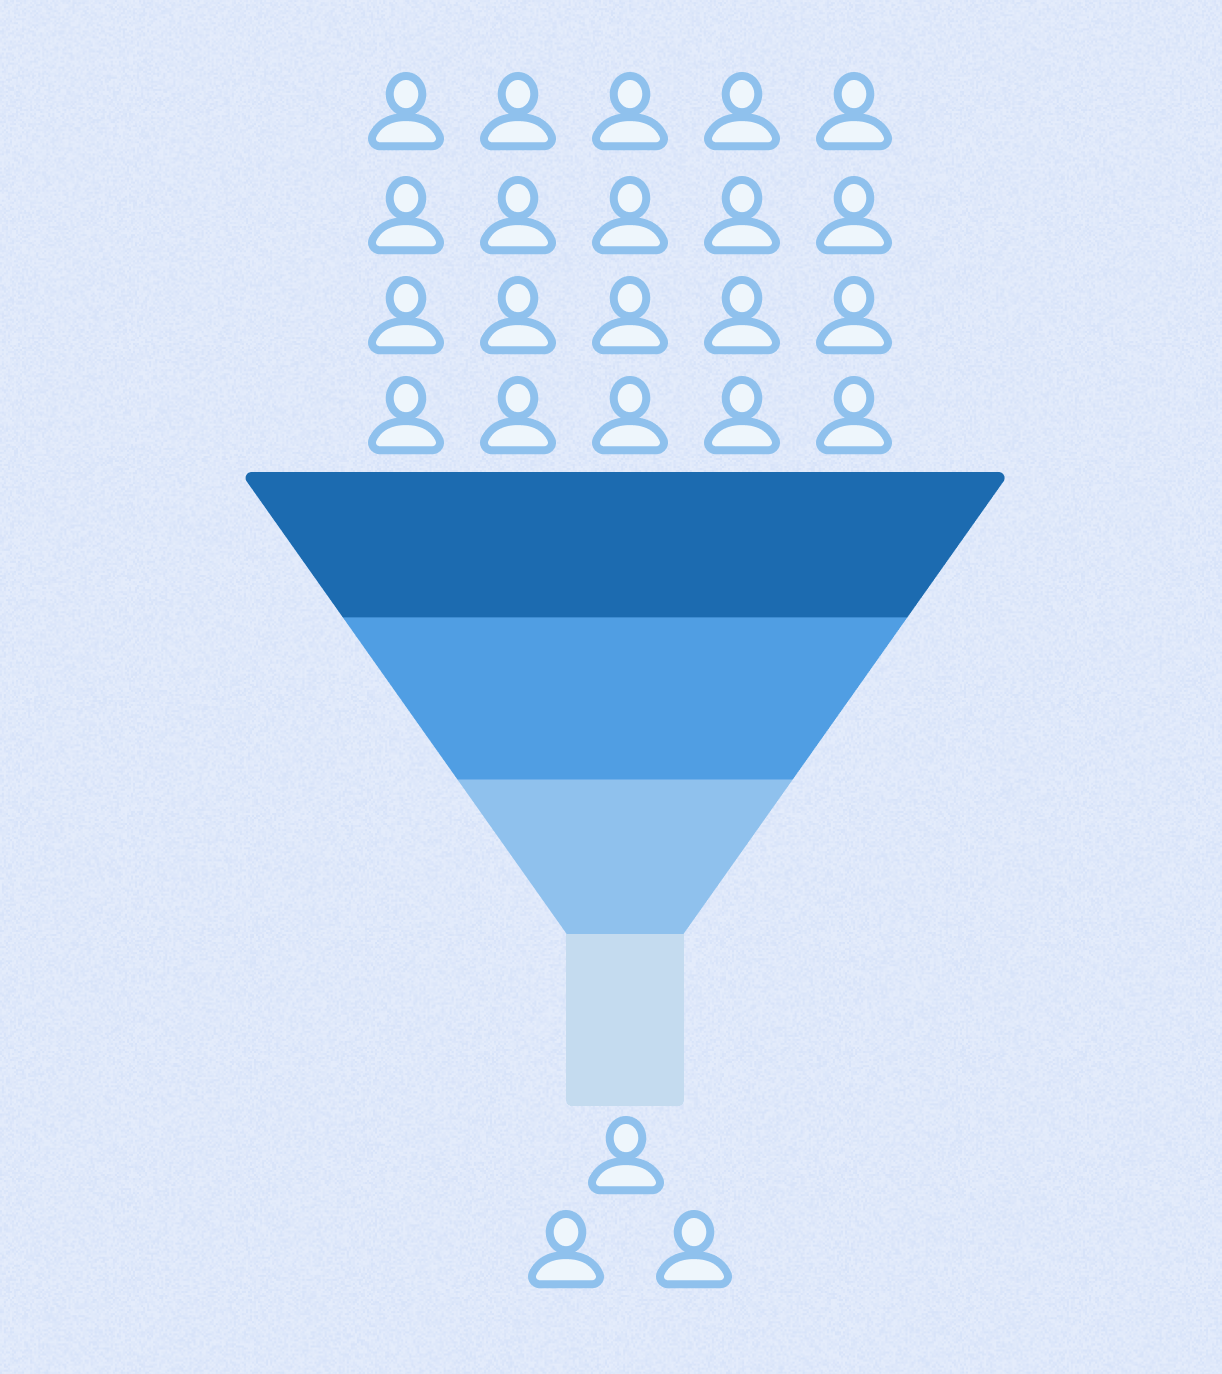
Funnel analysis shows how users move through a series of steps and where they drop off. Think of it like an actual funnel: wide at the top and narrow at the bottom. Lots of people start at the top, but fewer finish at the bottom. It’s not just a chart, but a way to map your users’ journeys step by step.
A simple example:
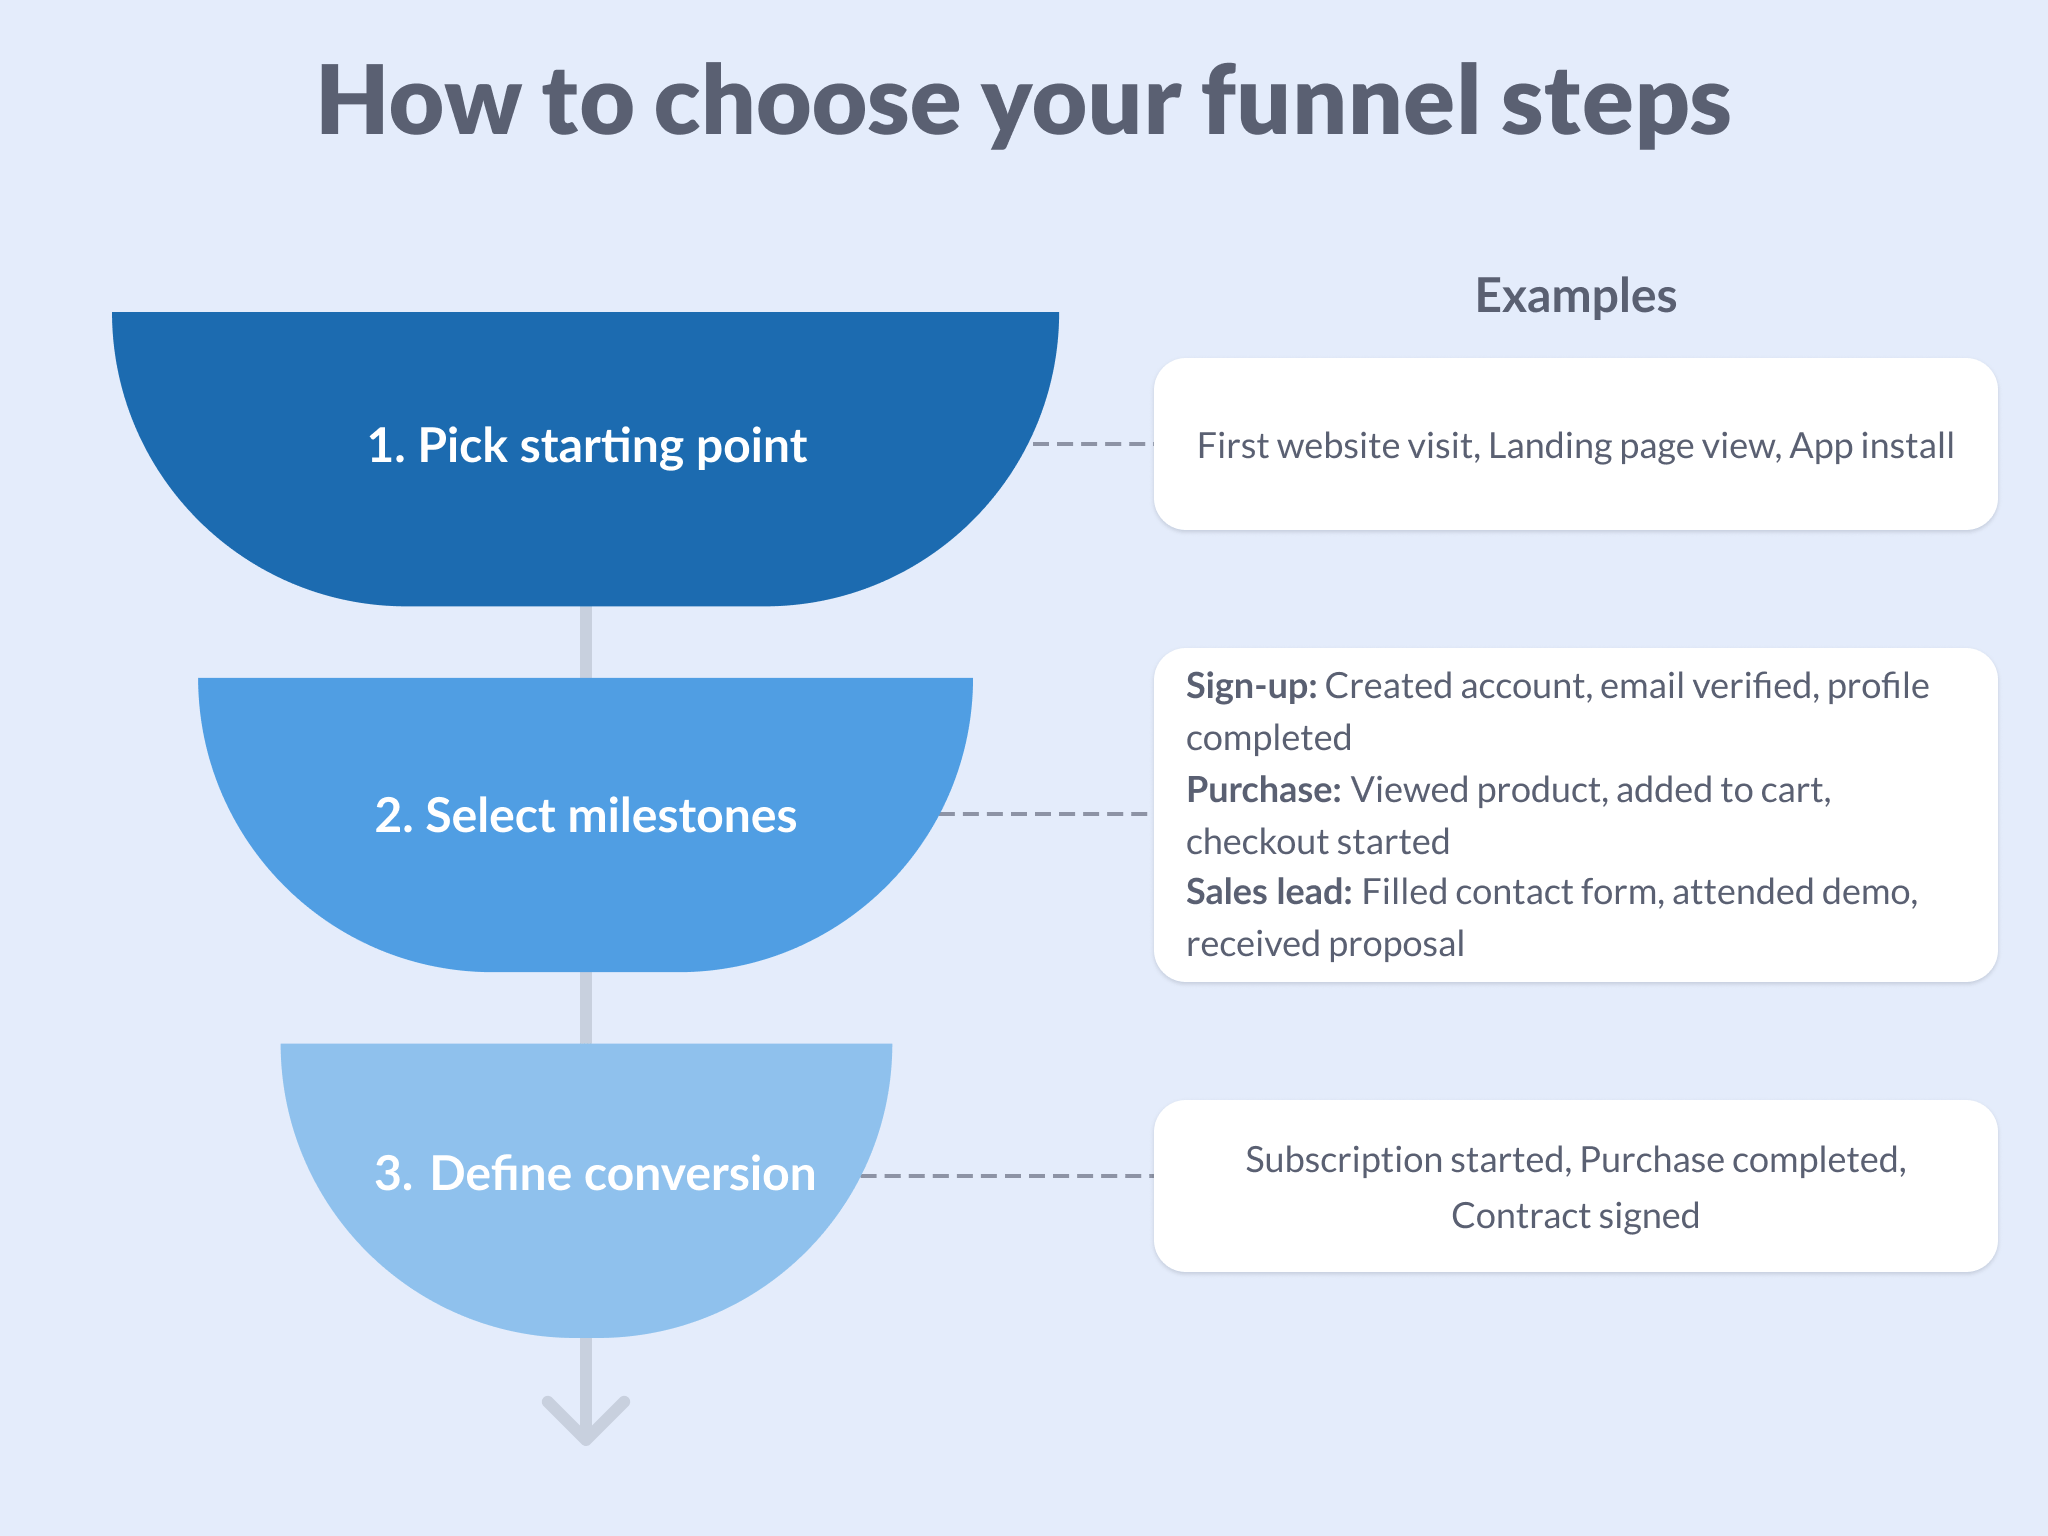
Let’s say you want to analyze your signup flow. You define four key steps:
Step 1: Visited the homepage
Step 2: Signed up
Step 3: Started trial
Step 4: Purchased plan
Now imagine 1,000 people visited your homepage, but only 50 purchased a plan. Your funnel might look like this:
| Step | Users | Conversion from previous | Conversion from total |
|---|---|---|---|
| Visited homepage | 1,000 | – | – |
| Signed up | 600 | 60% | 60% |
| Started trial | 200 | 33% | 20% |
| Purchased plan | 50 | 25% | 5% |
This breakdown highlights where users drop off. In this case, signups are strong, but the trial-to-paid conversion is where things fall apart.
Your turn: What are the 3 to 5 key steps your users go through before converting?
Sketch them out, even roughly. These will become your funnel steps.
The data you need
The table above contains aggregated data. To build your own funnel, you need raw data with three attributes: who did something, what they did, and when they did it.
That means each row will typically include fields like these: user_id (Who), event_name (What), and event_time (When).
Here’s what clean data looks like:
| user_id | event_name | event_time |
|---|---|---|
| A | visited_homepage | 2025-07-30 09:00:36 |
| A | signed_up | 2025-07-30 09:05:11 |
| B | visited_homepage | 2025-07-30 10:02:07 |
| B | signed_up | 2025-07-30 10:04:40 |
| B | started_trial | 2025-07-30 10:06:03 |
This kind of event log is the backbone of funnel analysis. You can also include extra fields like device, country, or campaign_source to slice funnels by audience segments.
In many cases, you’ll need to reshape or model your data into this format before you can calculate a funnel.
How to calculate data for a funnel
Once your data is clean, funnel calculation is straightforward: count how many users reach each step, then calculate conversion rates between steps.
Let’s use an example:
| user_id | event_name |
|---|---|
| A | visited_homepage |
| A | signed_up |
| A | started_trial |
| B | visited_homepage |
| B | signed_up |
| C | visited_homepage |
Step 1 (Visited Homepage): 3 users — A, B, C
Step 2 (Signed Up): 2 users — A & B
Step 3 (Started Trial): 1 user — A
Now calculate the conversion rates:
- Step-by-step conversion rate:
- Homepage → Sign Up = 2 ÷ 3 = 66.7%
- Sign Up → Trial = 1 ÷ 2 = 50%
- Conversion rate from start:
- Homepage → Trial = 1 ÷ 3 = 33.3%
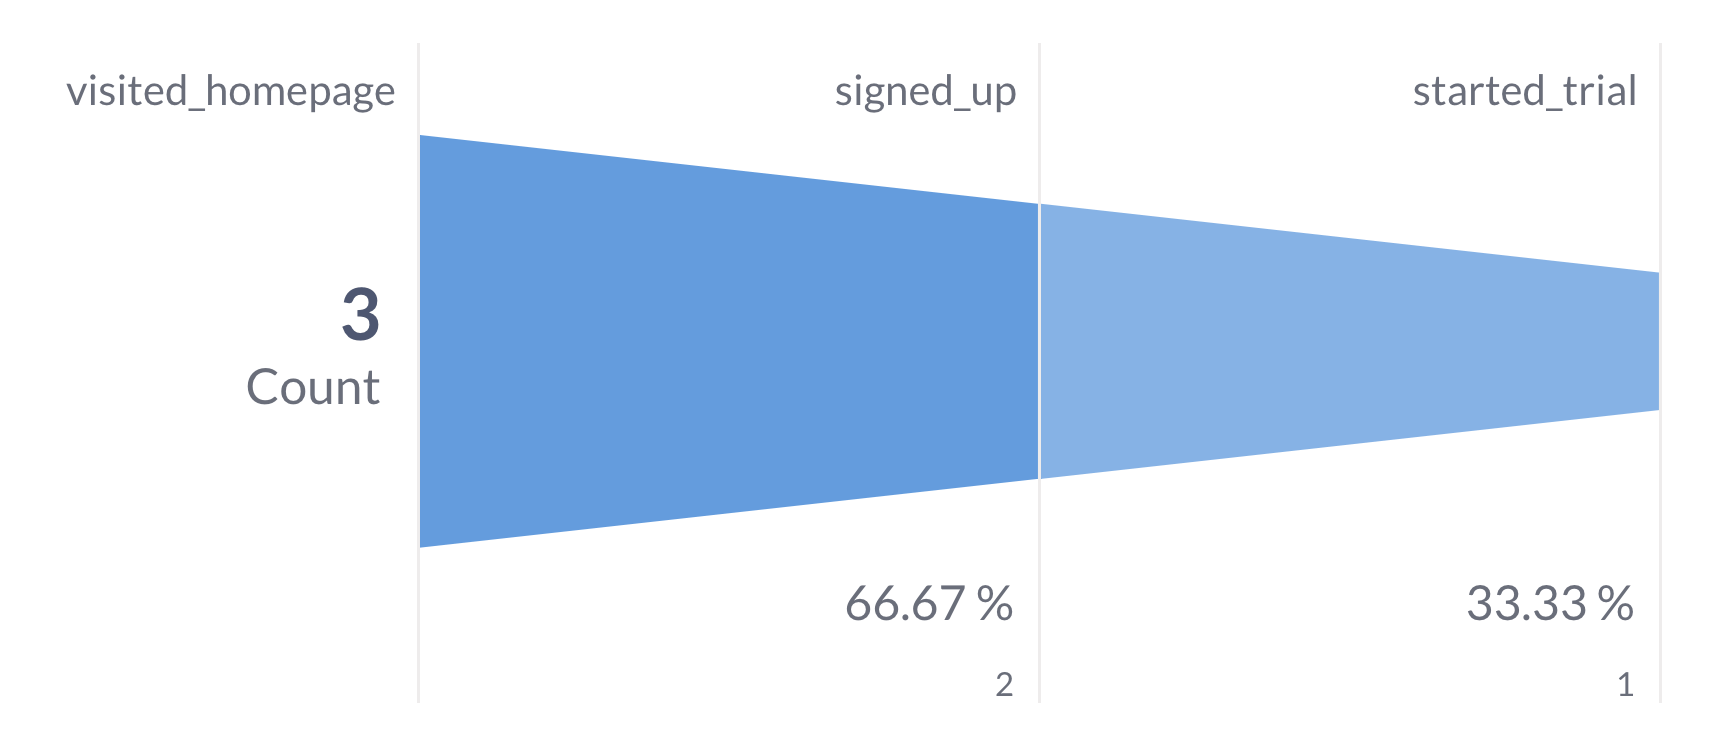
This simple math is the foundation of every funnel chart, no matter how complex your data gets.
Here’s how those numbers look as a funnel:
Building funnels in Metabase
To build a funnel chart in Metabase, you can use the query builder or SQL.
Start by identifying the events that represent each step in your funnel, things like visited_homepage, signed_up, or started_trial.
Then:
- Summarize your events by counting
user_id - Group by the funnel step, like
event_nameto count users at each stage - Visualize as a funnel chart.
For more advanced setups (like combining steps from different tables or using SQL), check out our Funnel charts guide.
Try it yourself: Sample CSV
Ready to put funnel analysis into practice?
We’ve prepared a sample dataset you can download and explore on your own.
This CSV contains user event data like user_id, event_name, and event_time so you can practice building funnels in Metabase using the steps you learned.
Download the sample funnel dataset
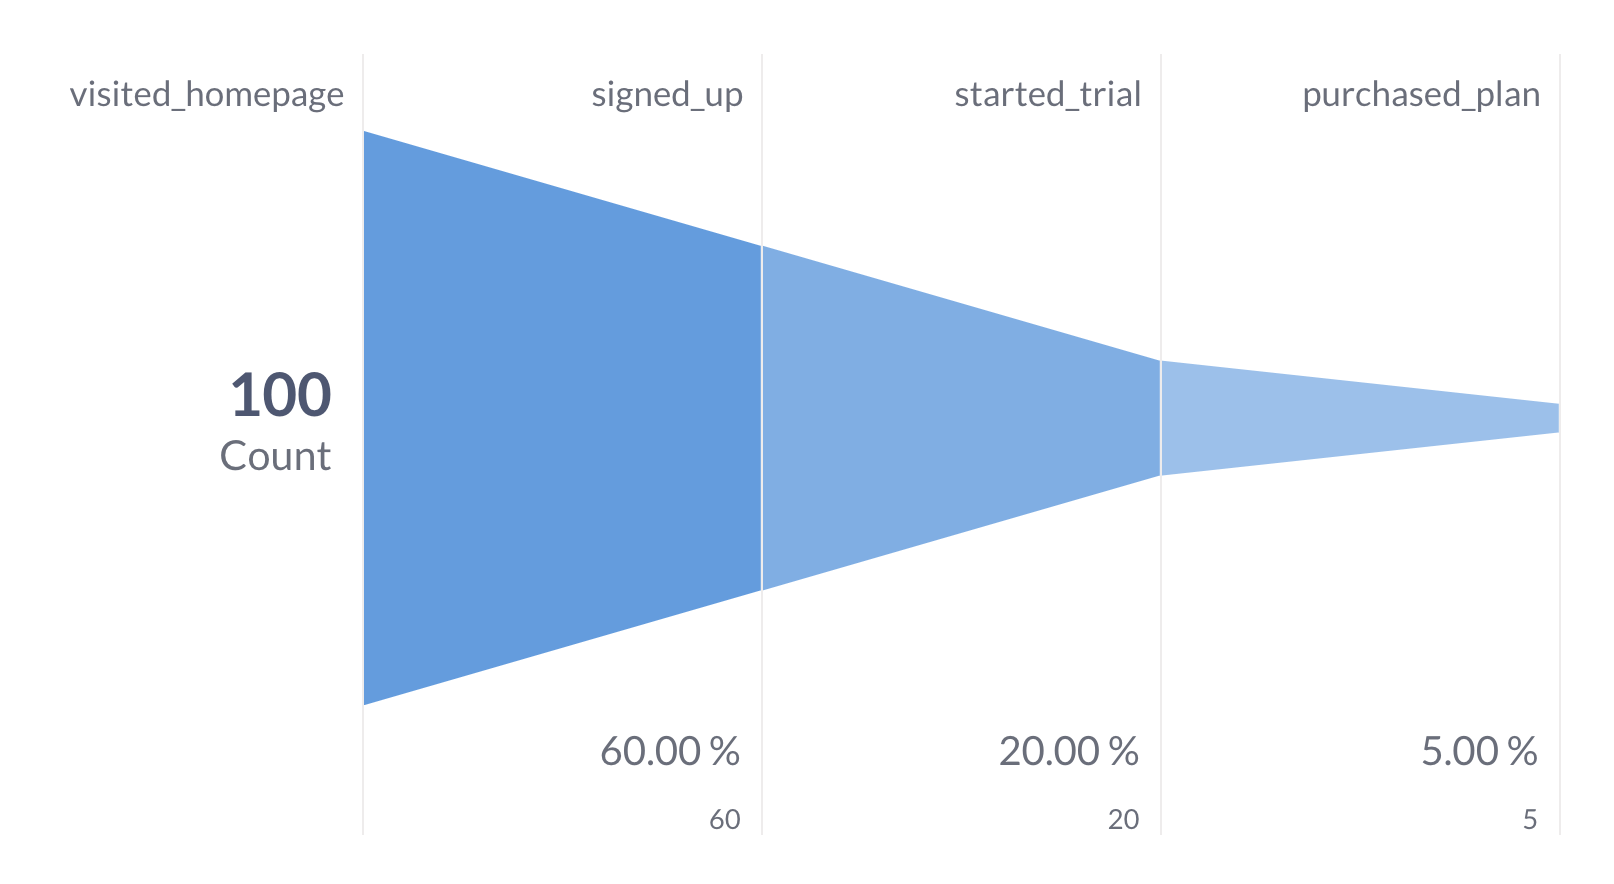
Upload the CSV to Metabase and build a funnel chart to see where users drop off and how conversion rates change.
You should end up with a funnel that looks something like this:
This practice relies on the predefined sample dataset, but you can also generate your own practice data using the AI dataset generator.
Bonus: Common data issues (and what to do about them)
Here’s what usually goes wrong and how to fix it:
- Missing timestamps: You need them to know step order. If missing, try using creation dates or approximating from user ID.
- Wide format: One row per user with multiple columns (like
signup_date,trial_date,purchase_date) is harder to analyze. You’ll need to reshape this into long format with one event per row. - Events in separate tables: Your signup data is in one table, trial data in another, purchases in a third. Join them together into a single events table before starting your analysis.
- Inconsistent event names: Some events are called
signed_up, otherssignup_success,signup_done, orsignup_win. Pick one naming convention and stick with it.