


A tour of Metabase
Metabase is a deep product with a lot of tools to simplify business intelligence and embedded analytics.
This is the “what comes in the box when you install Metabase” article. Metabase has a lot of tools in its toolkit (and we can’t cover everything here), but even seasoned Metabasers will benefit from a tour of its feature set - especially since we add major new features at a regular clip.
What is Metabase?
Metabase is an open-source business intelligence tool that you can connect to many popular databases. Metabase lets you ask questions about your data, and displays answers in formats that make sense, whether that’s a bar chart or a detailed table.
You can save your questions, and group questions into handsome dashboards. Metabase also makes it easy to share questions and dashboards with the rest of your team.
At a high level, we’ll walk through the features that let you:
- Query and visualize your data
- Build dashboards and documents
- Ask AI to get answers
- Clean up and curate analytics
- Share your results
- Embed questions, dashboards, AI chat, and more
- Find things and stay organized
- Manage who can see what
- Customize your Metabase
Query and visualize your data
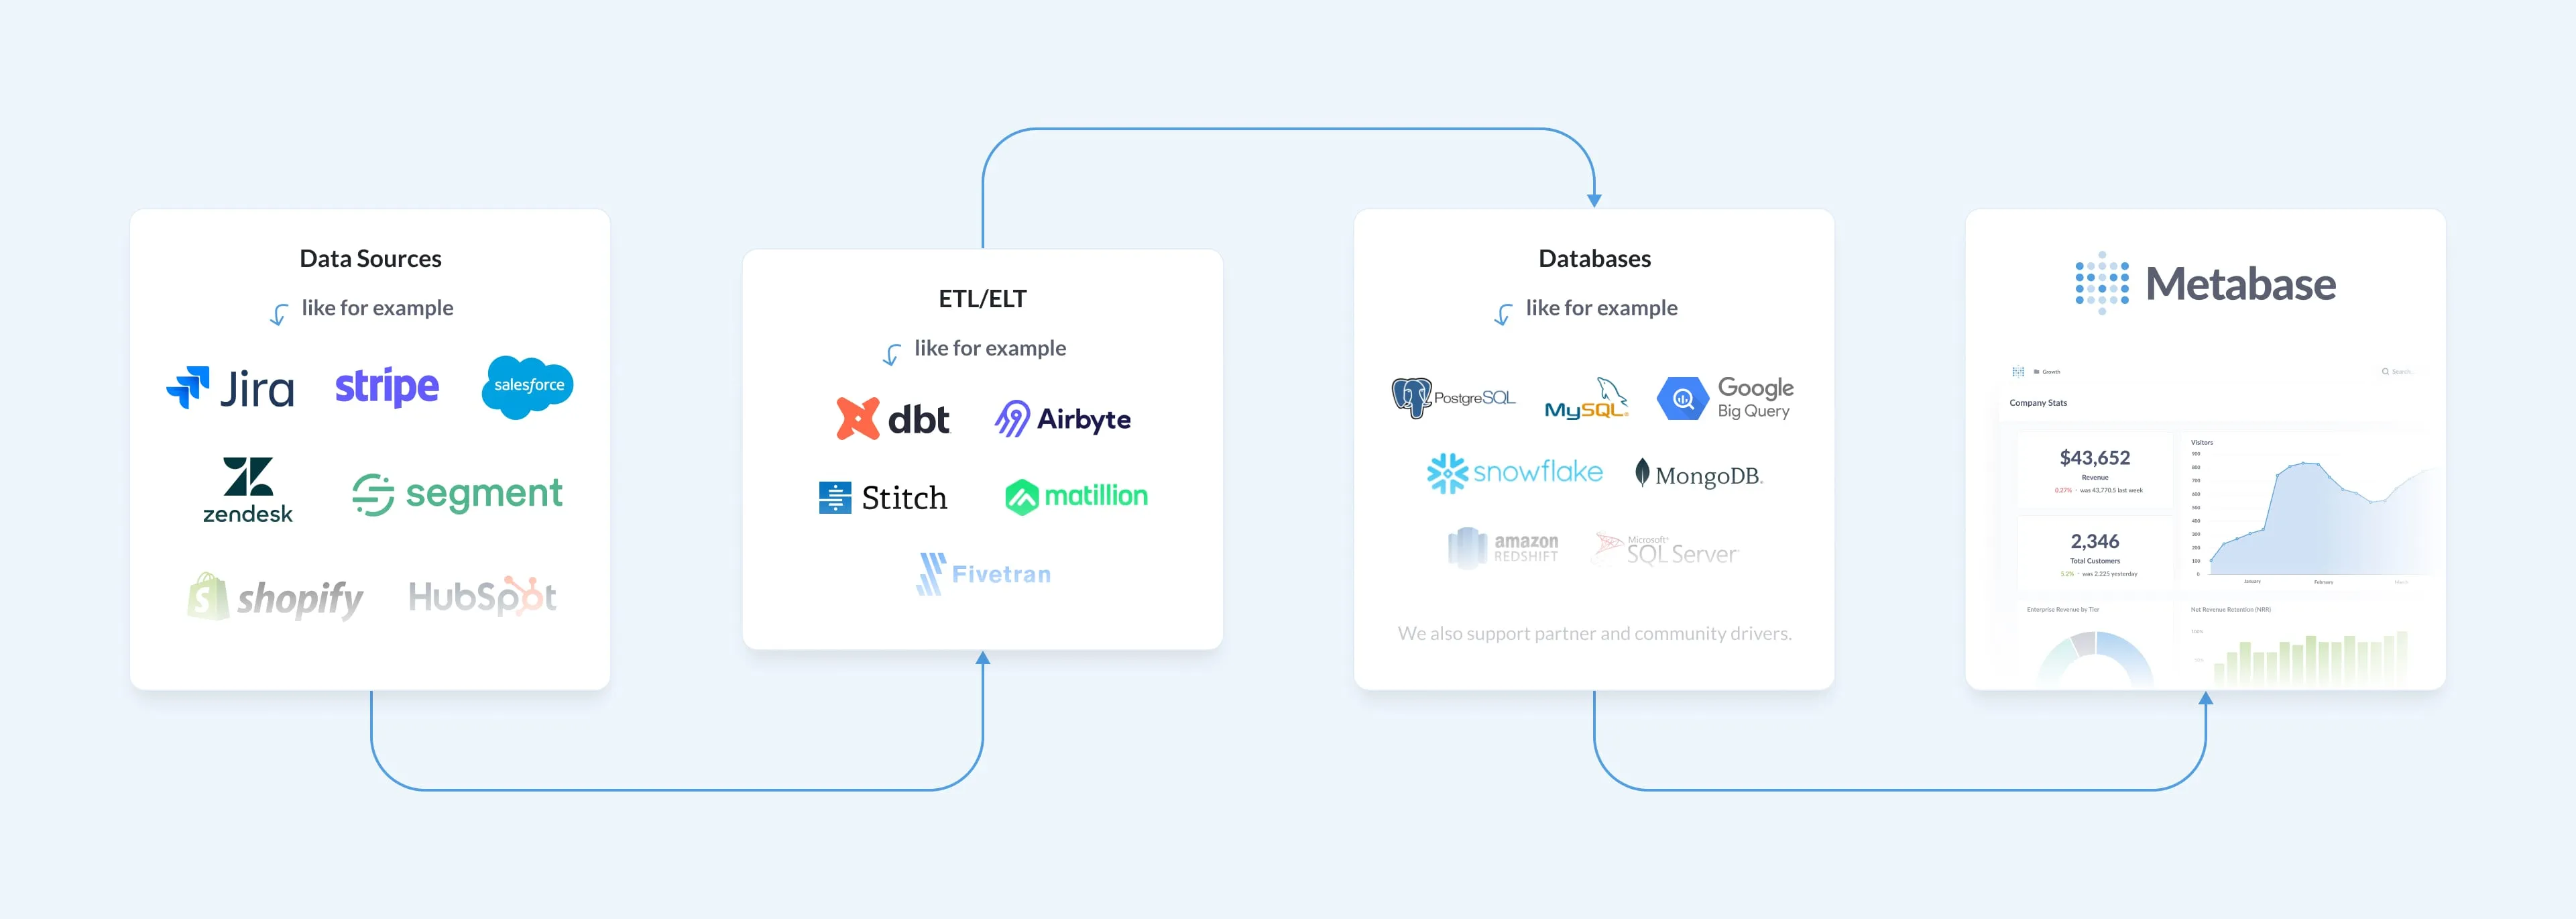
Connect a database
Metabase supports a lot of different databases, and ships with a Sample Database for you to play around with. And once you’ve connected your data sources, Metabase gives you a lot of tools to explore them.
Upload spreadsheets
You can upload CSVs to query and visualize in Metabase. This feature is handy for quick ad hoc analysis of spreadsheet data.
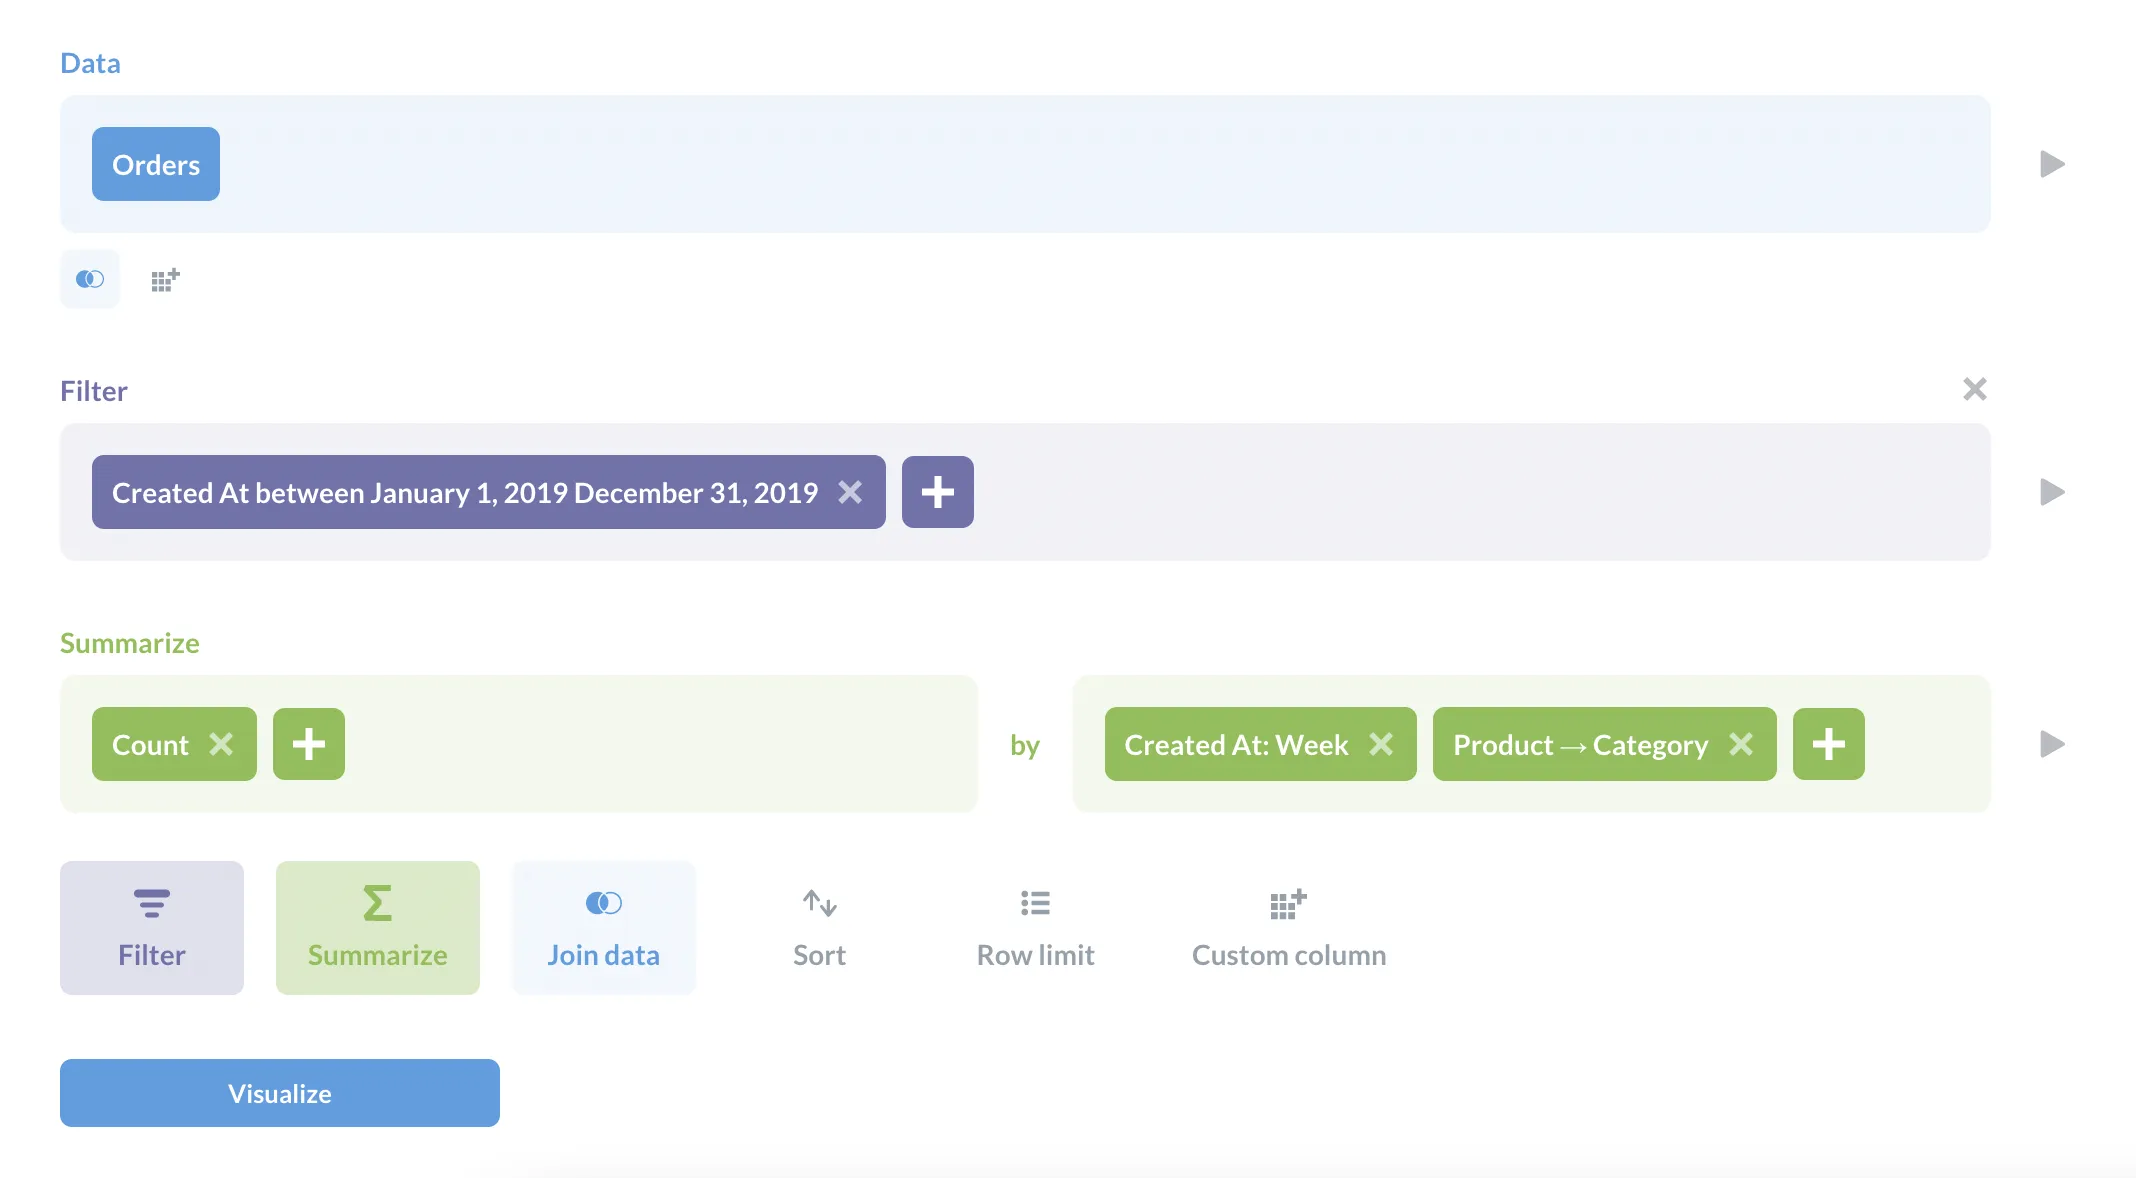
Query builder
You can use Metabase’s query builder to filter and summarize data.
With custom expressions, you can accomplish pretty much anything you’d be able to do with SQL: join tables, create custom columns, filter and group results, compare time series, and more. Plus, people who don’t know SQL can duplicate your question and use it as a starting point for another question.
Query builder questions automatically get a drill-through menu applied to their visualizations, allowing people to click on a table or chart to drill through the data.
Questions asked with the query builder can start with a model, a raw table, or with the results of a saved question, and you can convert them to native SQL at any time.
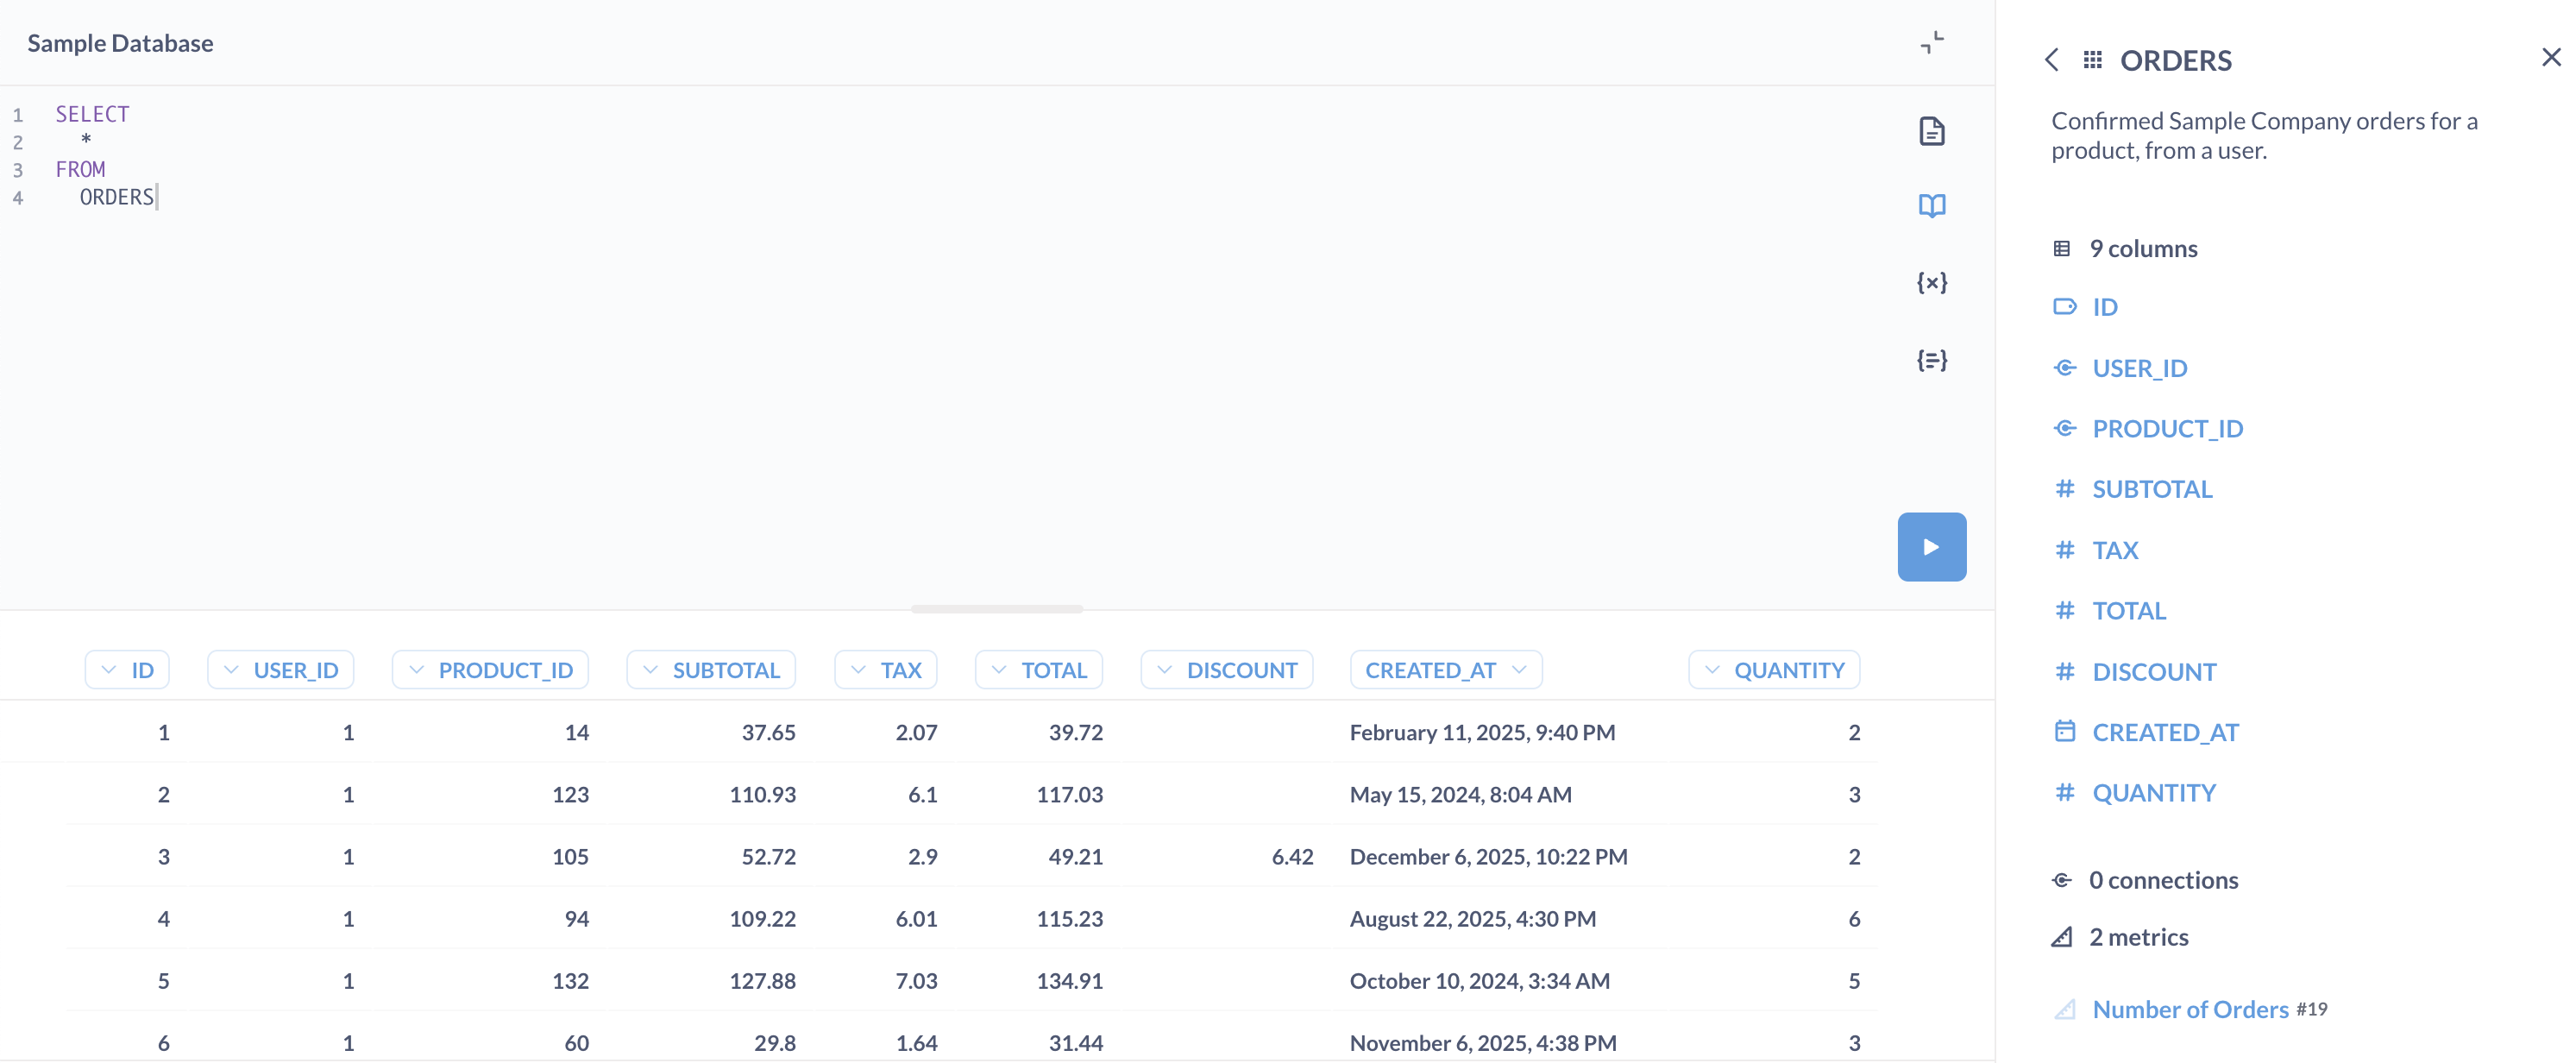
Native queries
Use the native query editor to compose questions in the database’s native query languages (typically SQL for relational databases, but also other query languages for data sources like MongoDB). For questions written in SQL, you can use variables in your code to create SQL templates, including field filter variables that can create smart dropdown filters.
Like query builder questions, you can use the results of models or saved questions as starting points for new questions, just as you would a table or view. For example, to reference question 123 like so:
WITH gizmo_orders AS {{#123}}
You can also save reusable SQL as snippets. Snippets can include variables so a single snippet adapts to different filters and parameters wherever it’s used. You can even compose snippets from other snippets.
Visualize results
When you ask a question, Metabase will guess at the most appropriate visualization type for the results, but you can select from a variety of visualization types.
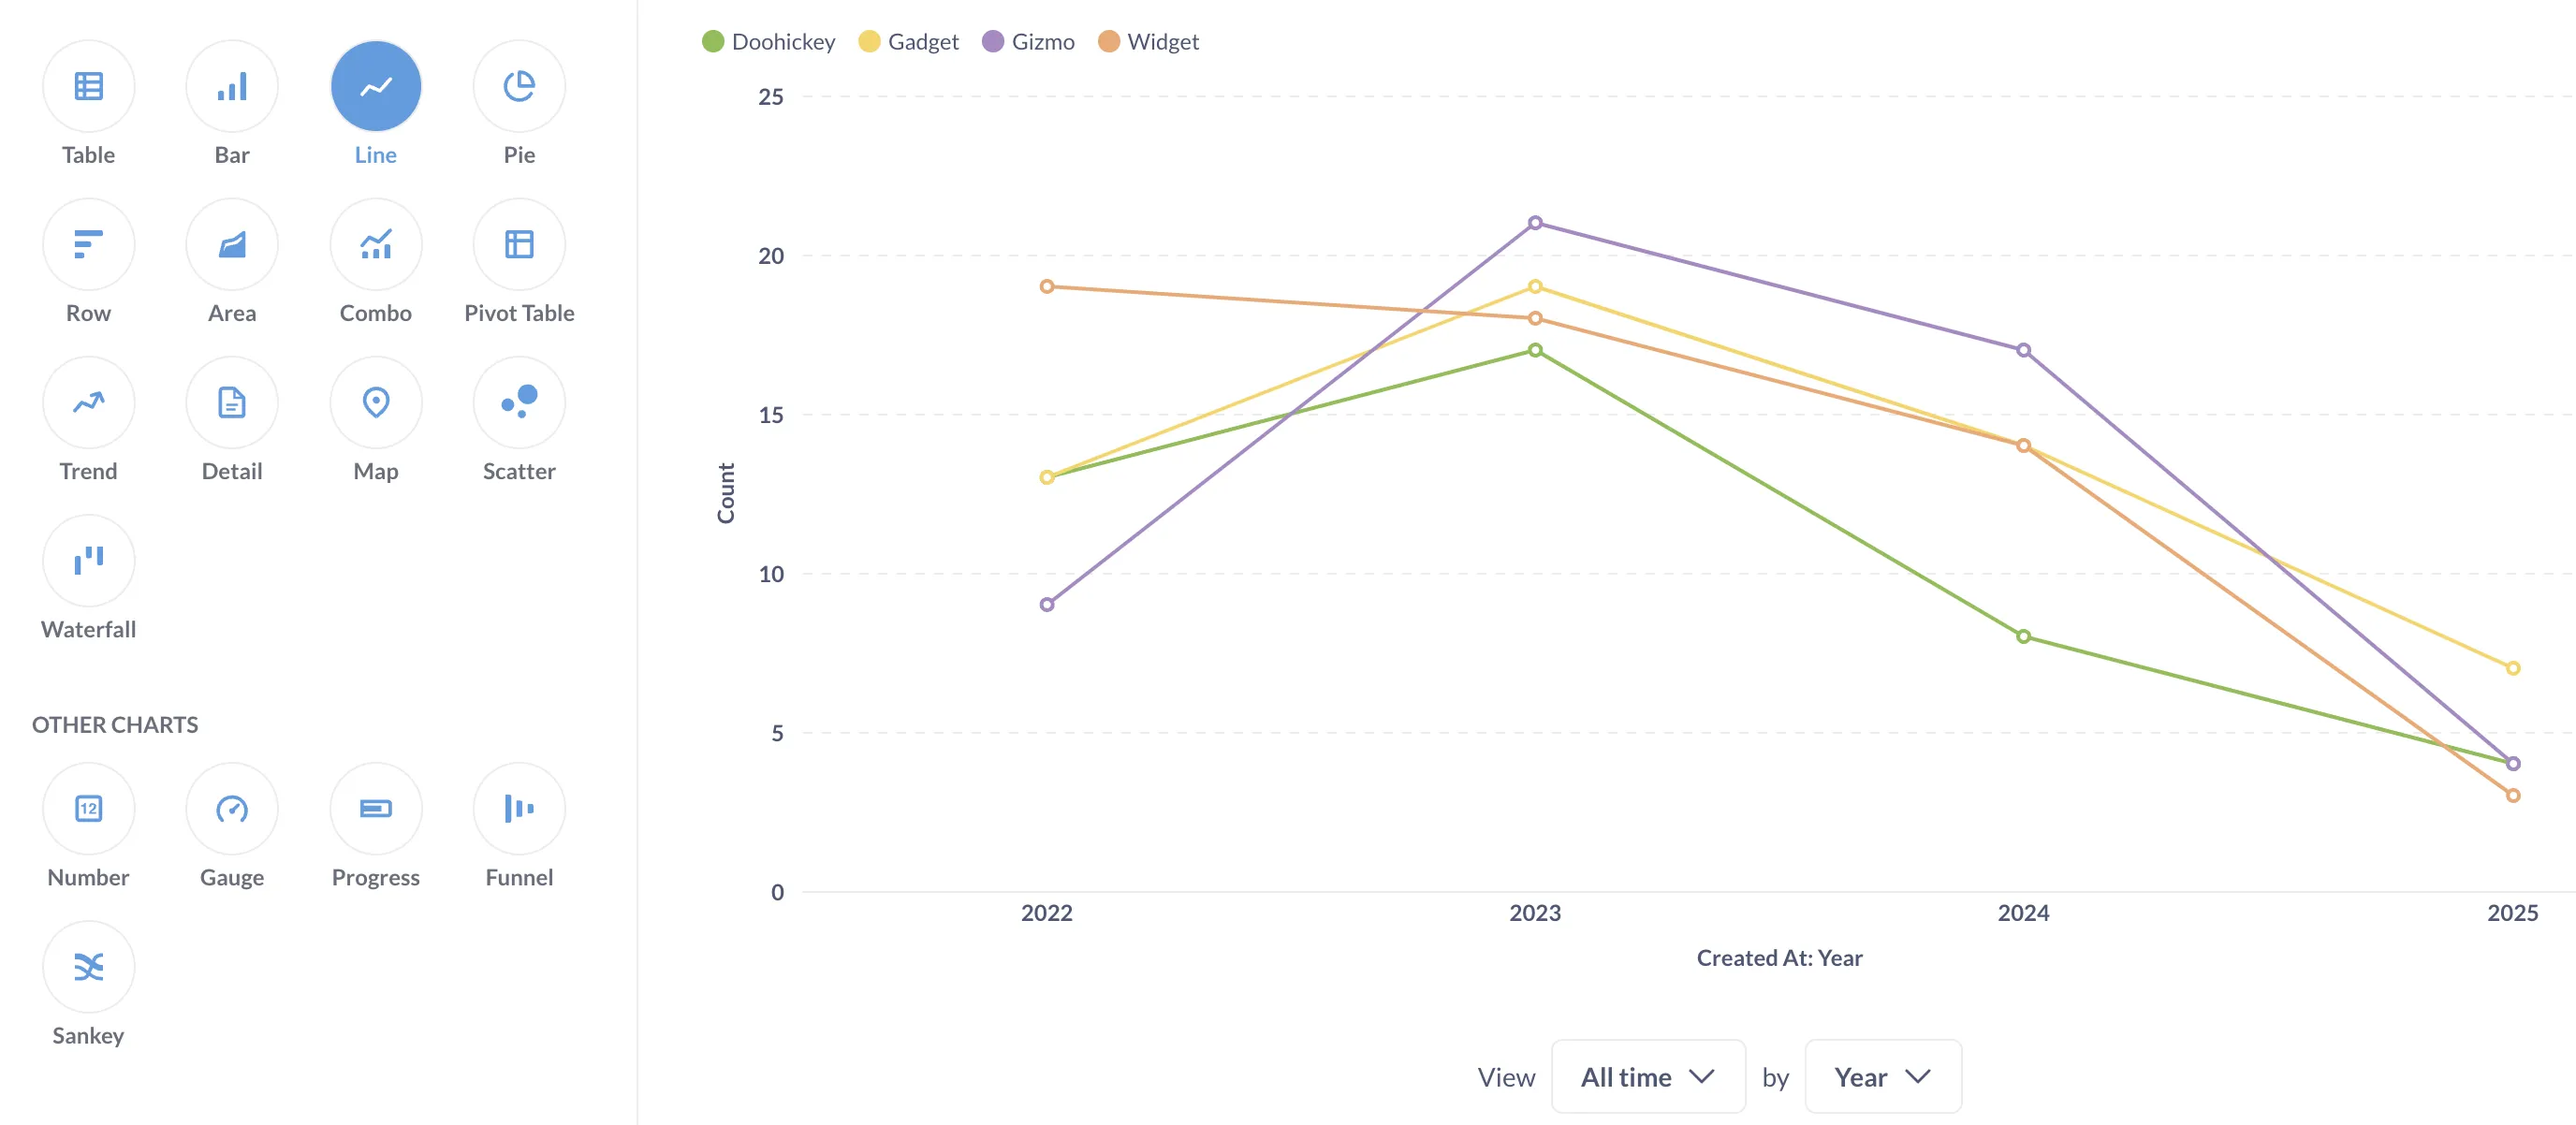
Additionally, each visualization type has their own set of options to customize.
Metrics
Create metrics to define reusable calculations (like revenue) that standardize how important numbers are computed across your team.
Ask AI to get answers
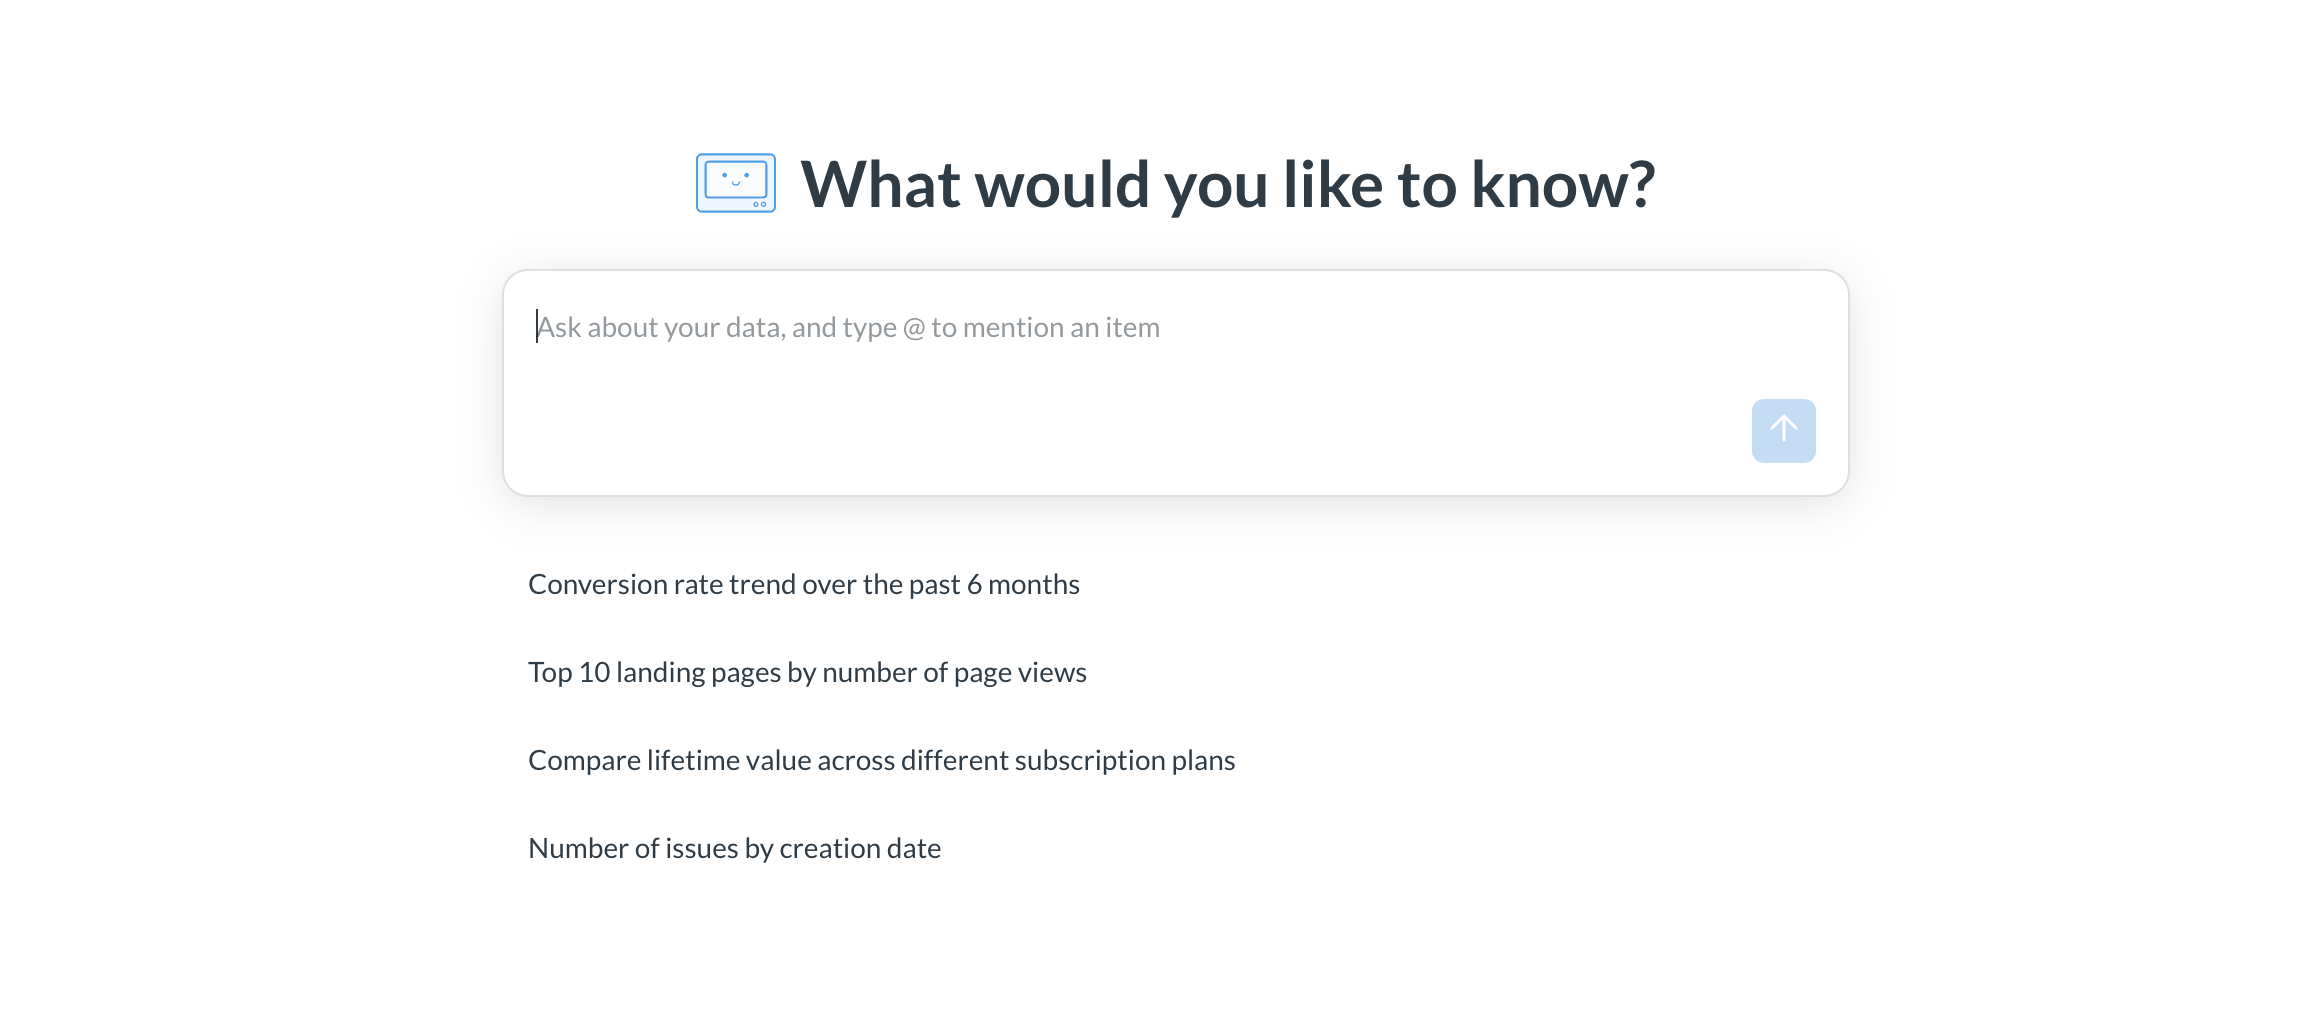
Metabot for full-service AI
Metabot lets people query data in natural language, generate and debug SQL, and get AI-generated chart summaries.
Build your own AI agent with the Agent API
If you need a custom agent to work with your semantic layer in Metabase, you can build your own using the Agent API.
SQL generation for OSS self-hosted instances
On self-hosted OSS Metabases, you can use your own API key to generate SQL from natural language directly in the native editor.
Create dashboards and documents
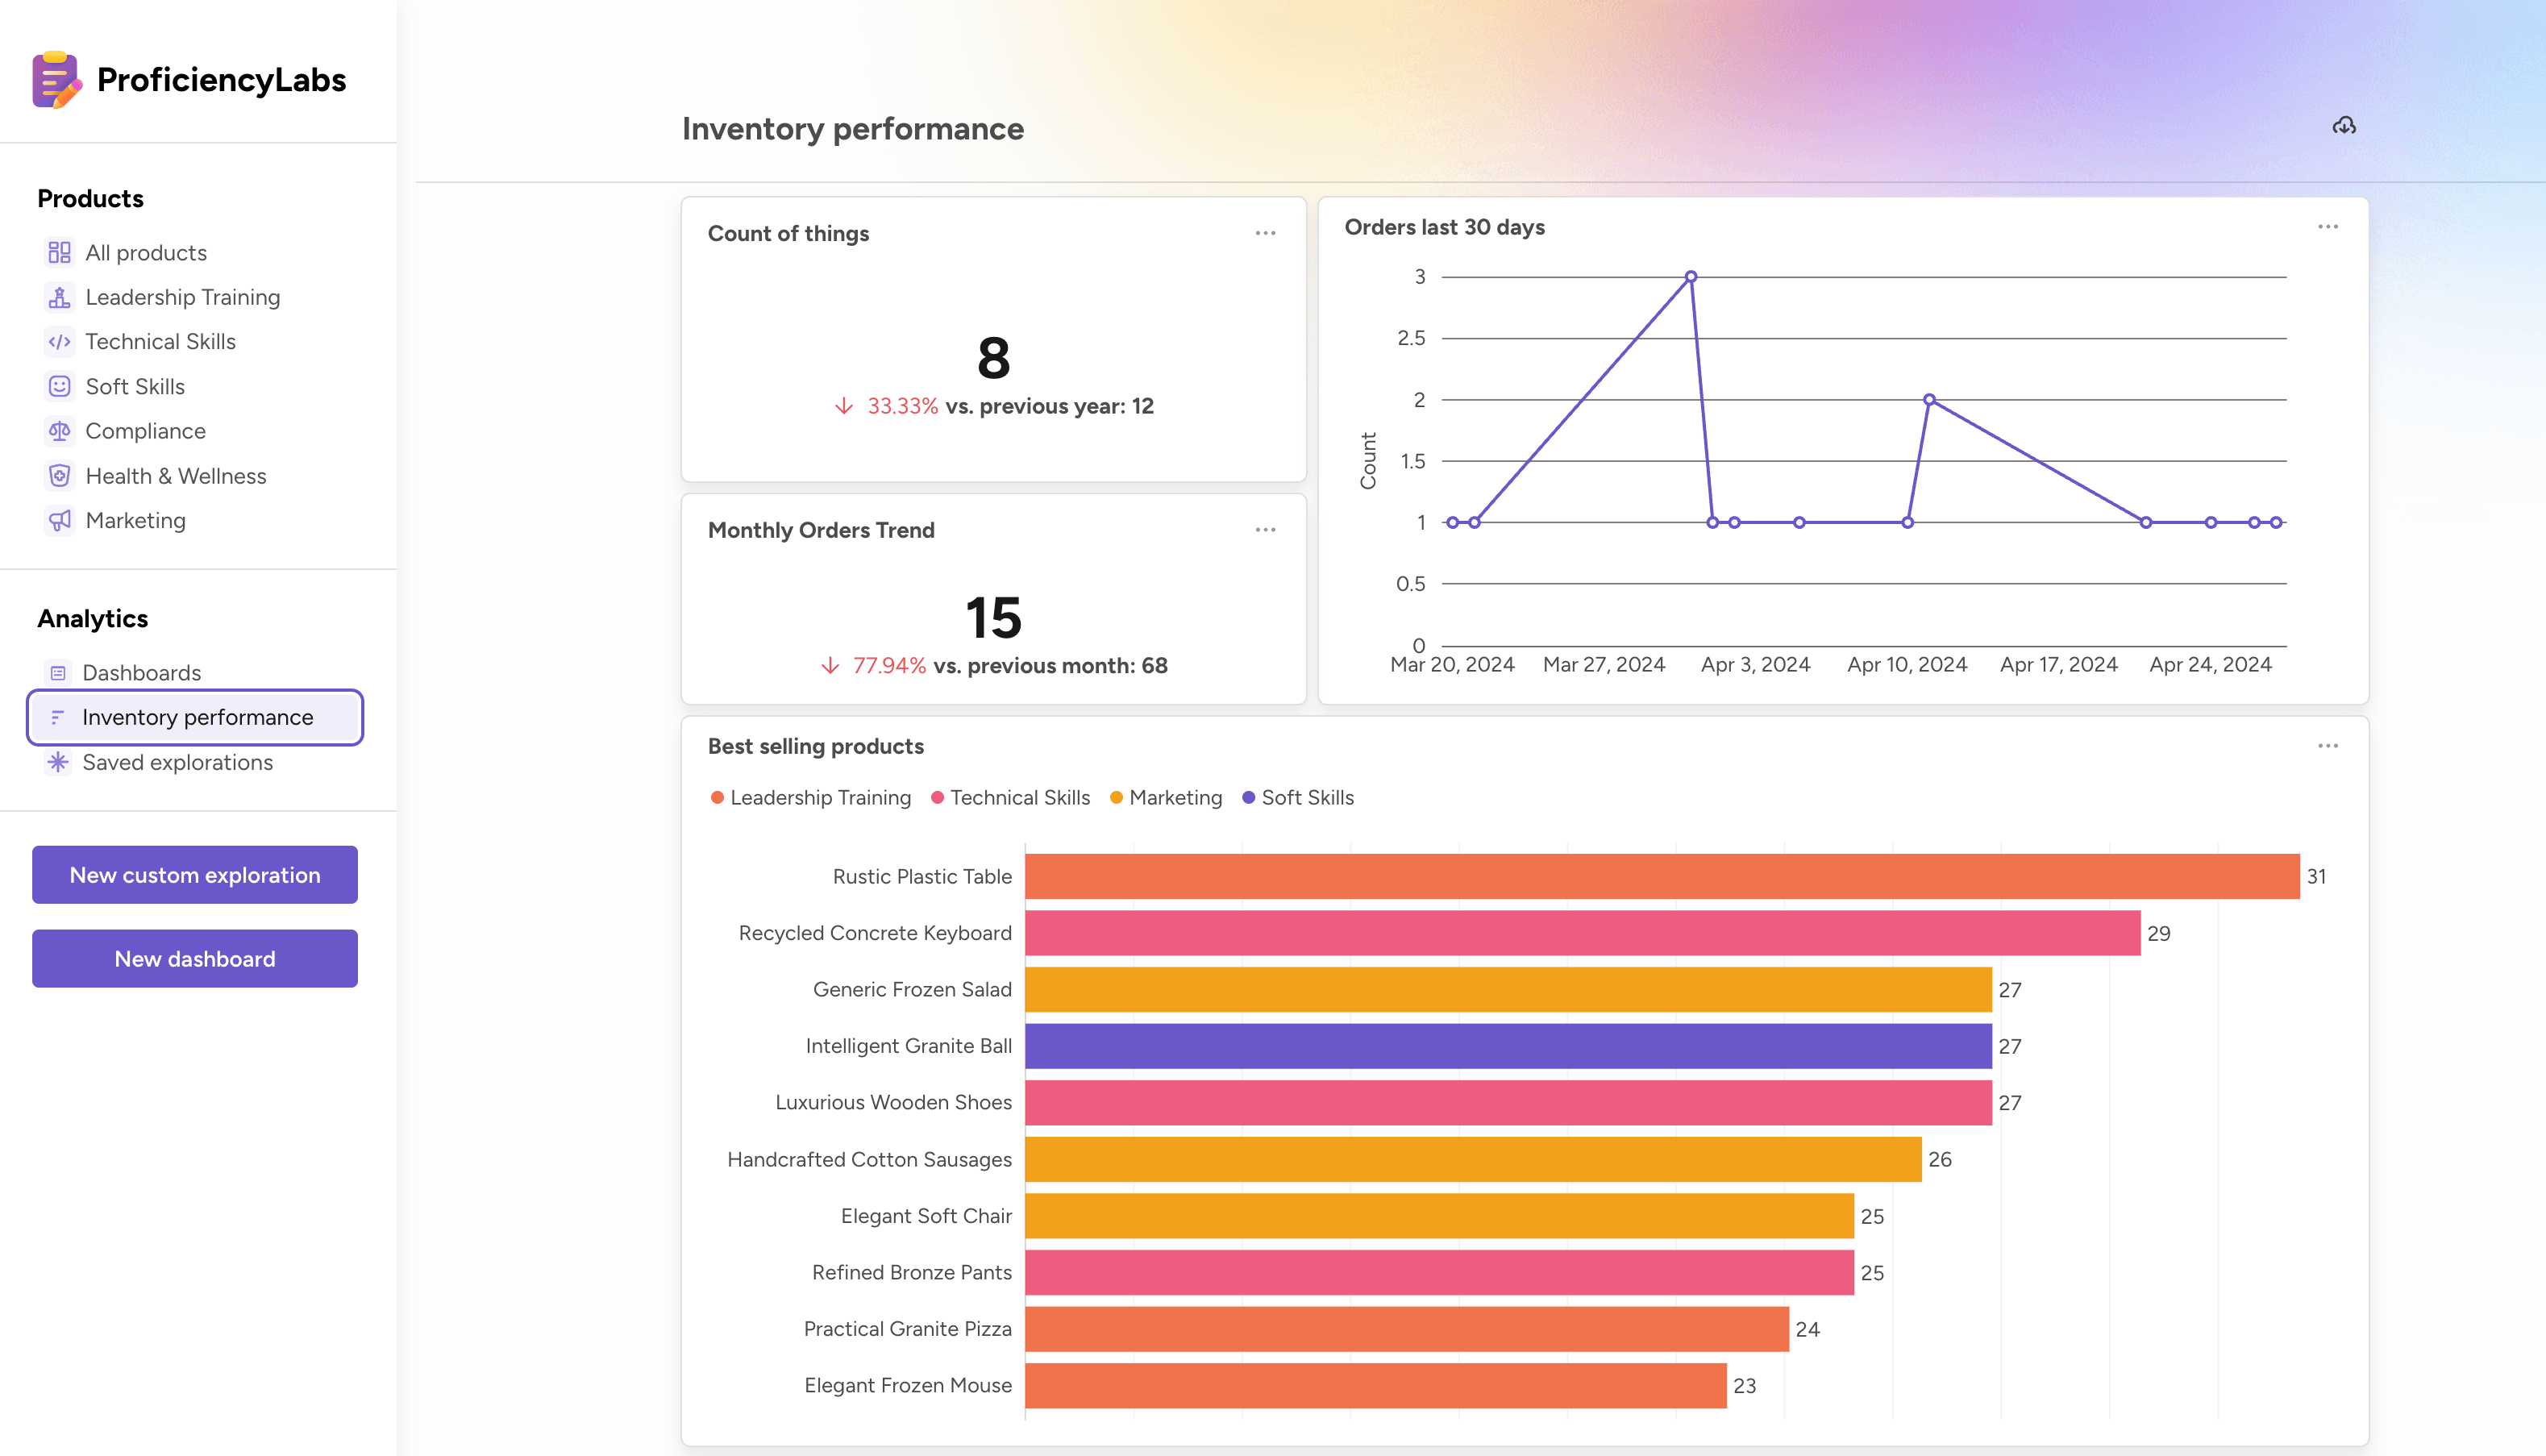
Dashboards
You can organize questions and models into a dashboard with tabs, and contextualize them with Markdown text cards, link cards, and iframe cards.
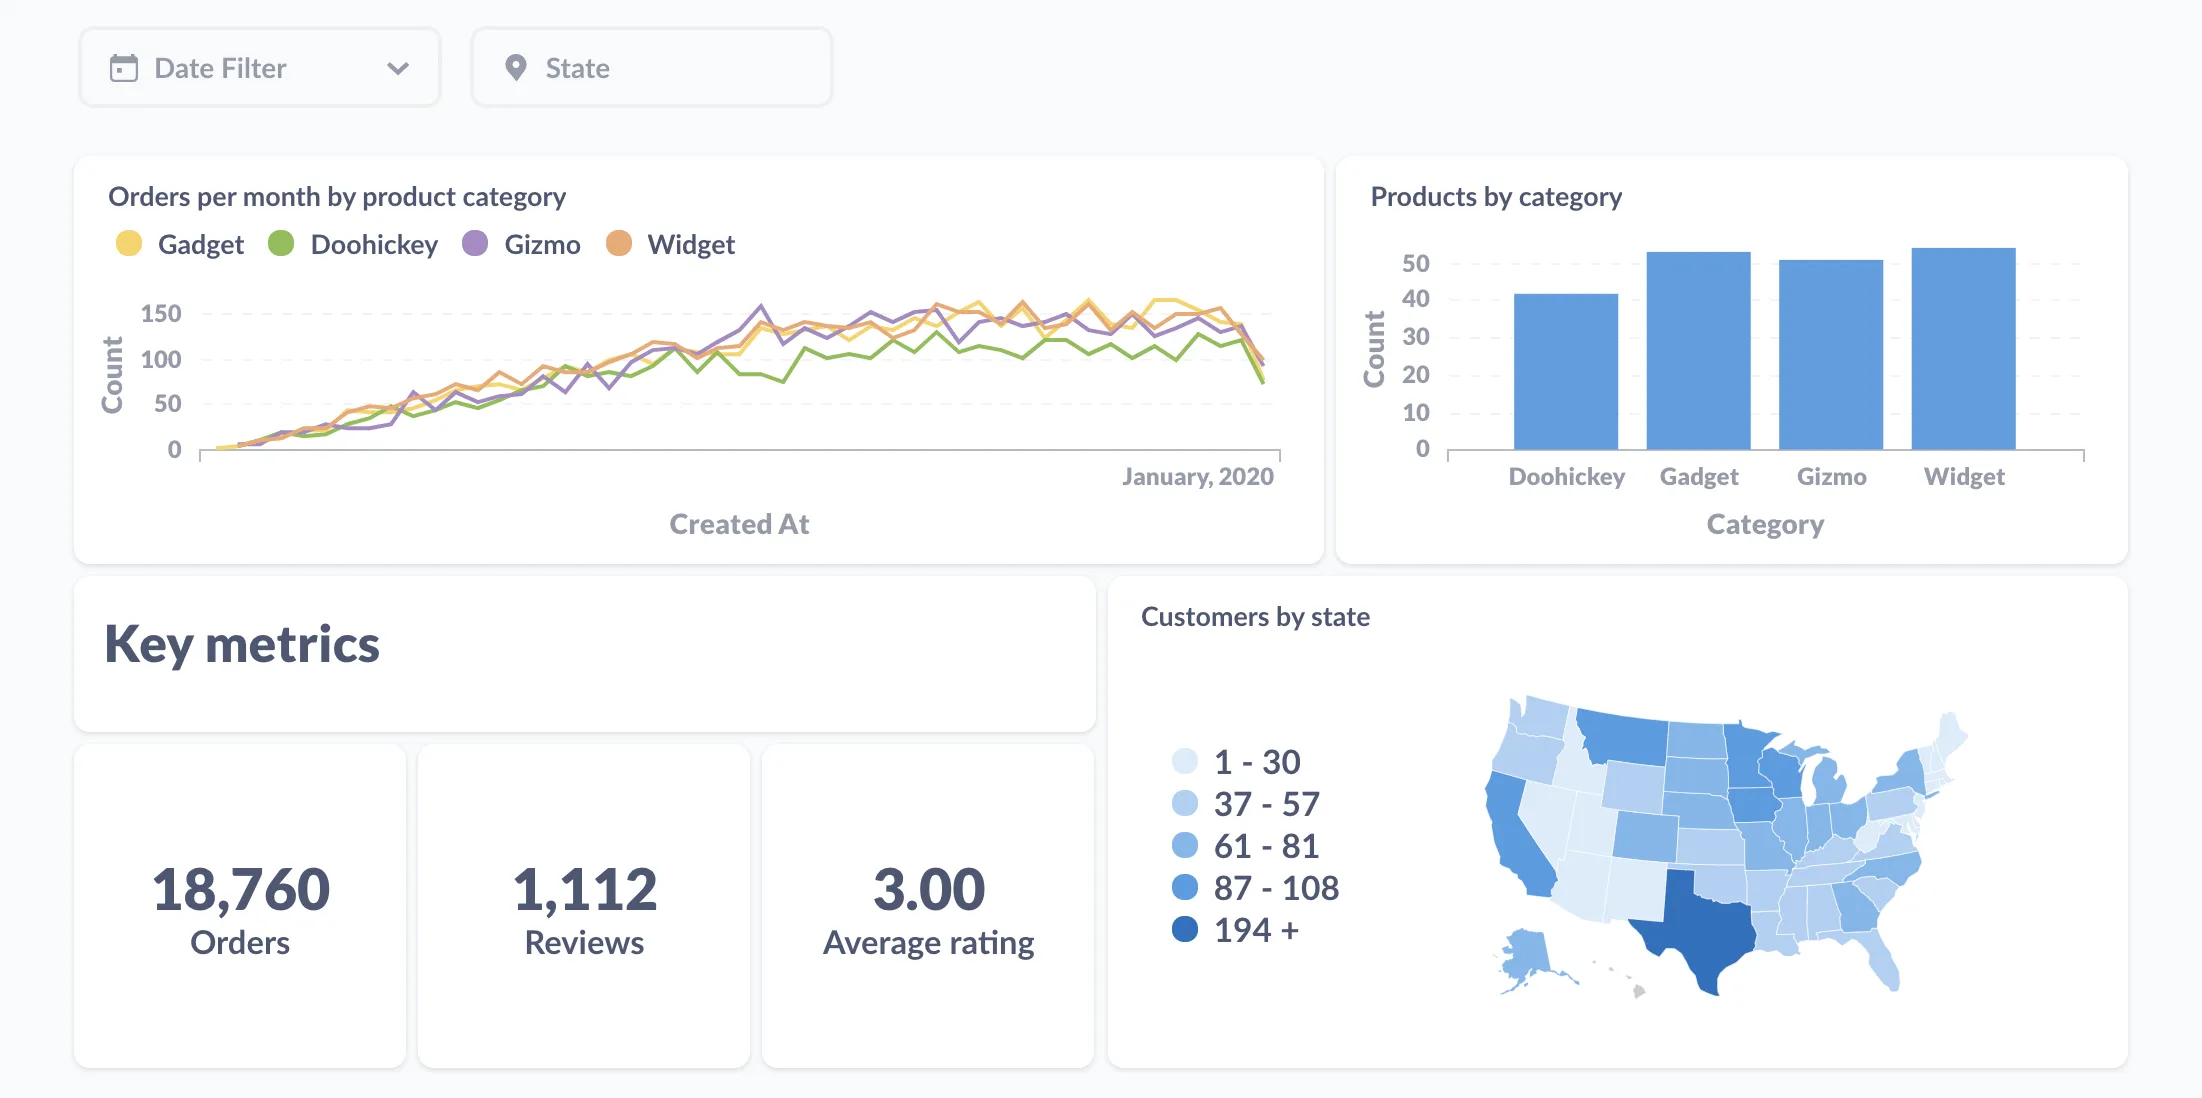
You can add filters to dashboards and connect them to fields on questions to narrow the results.
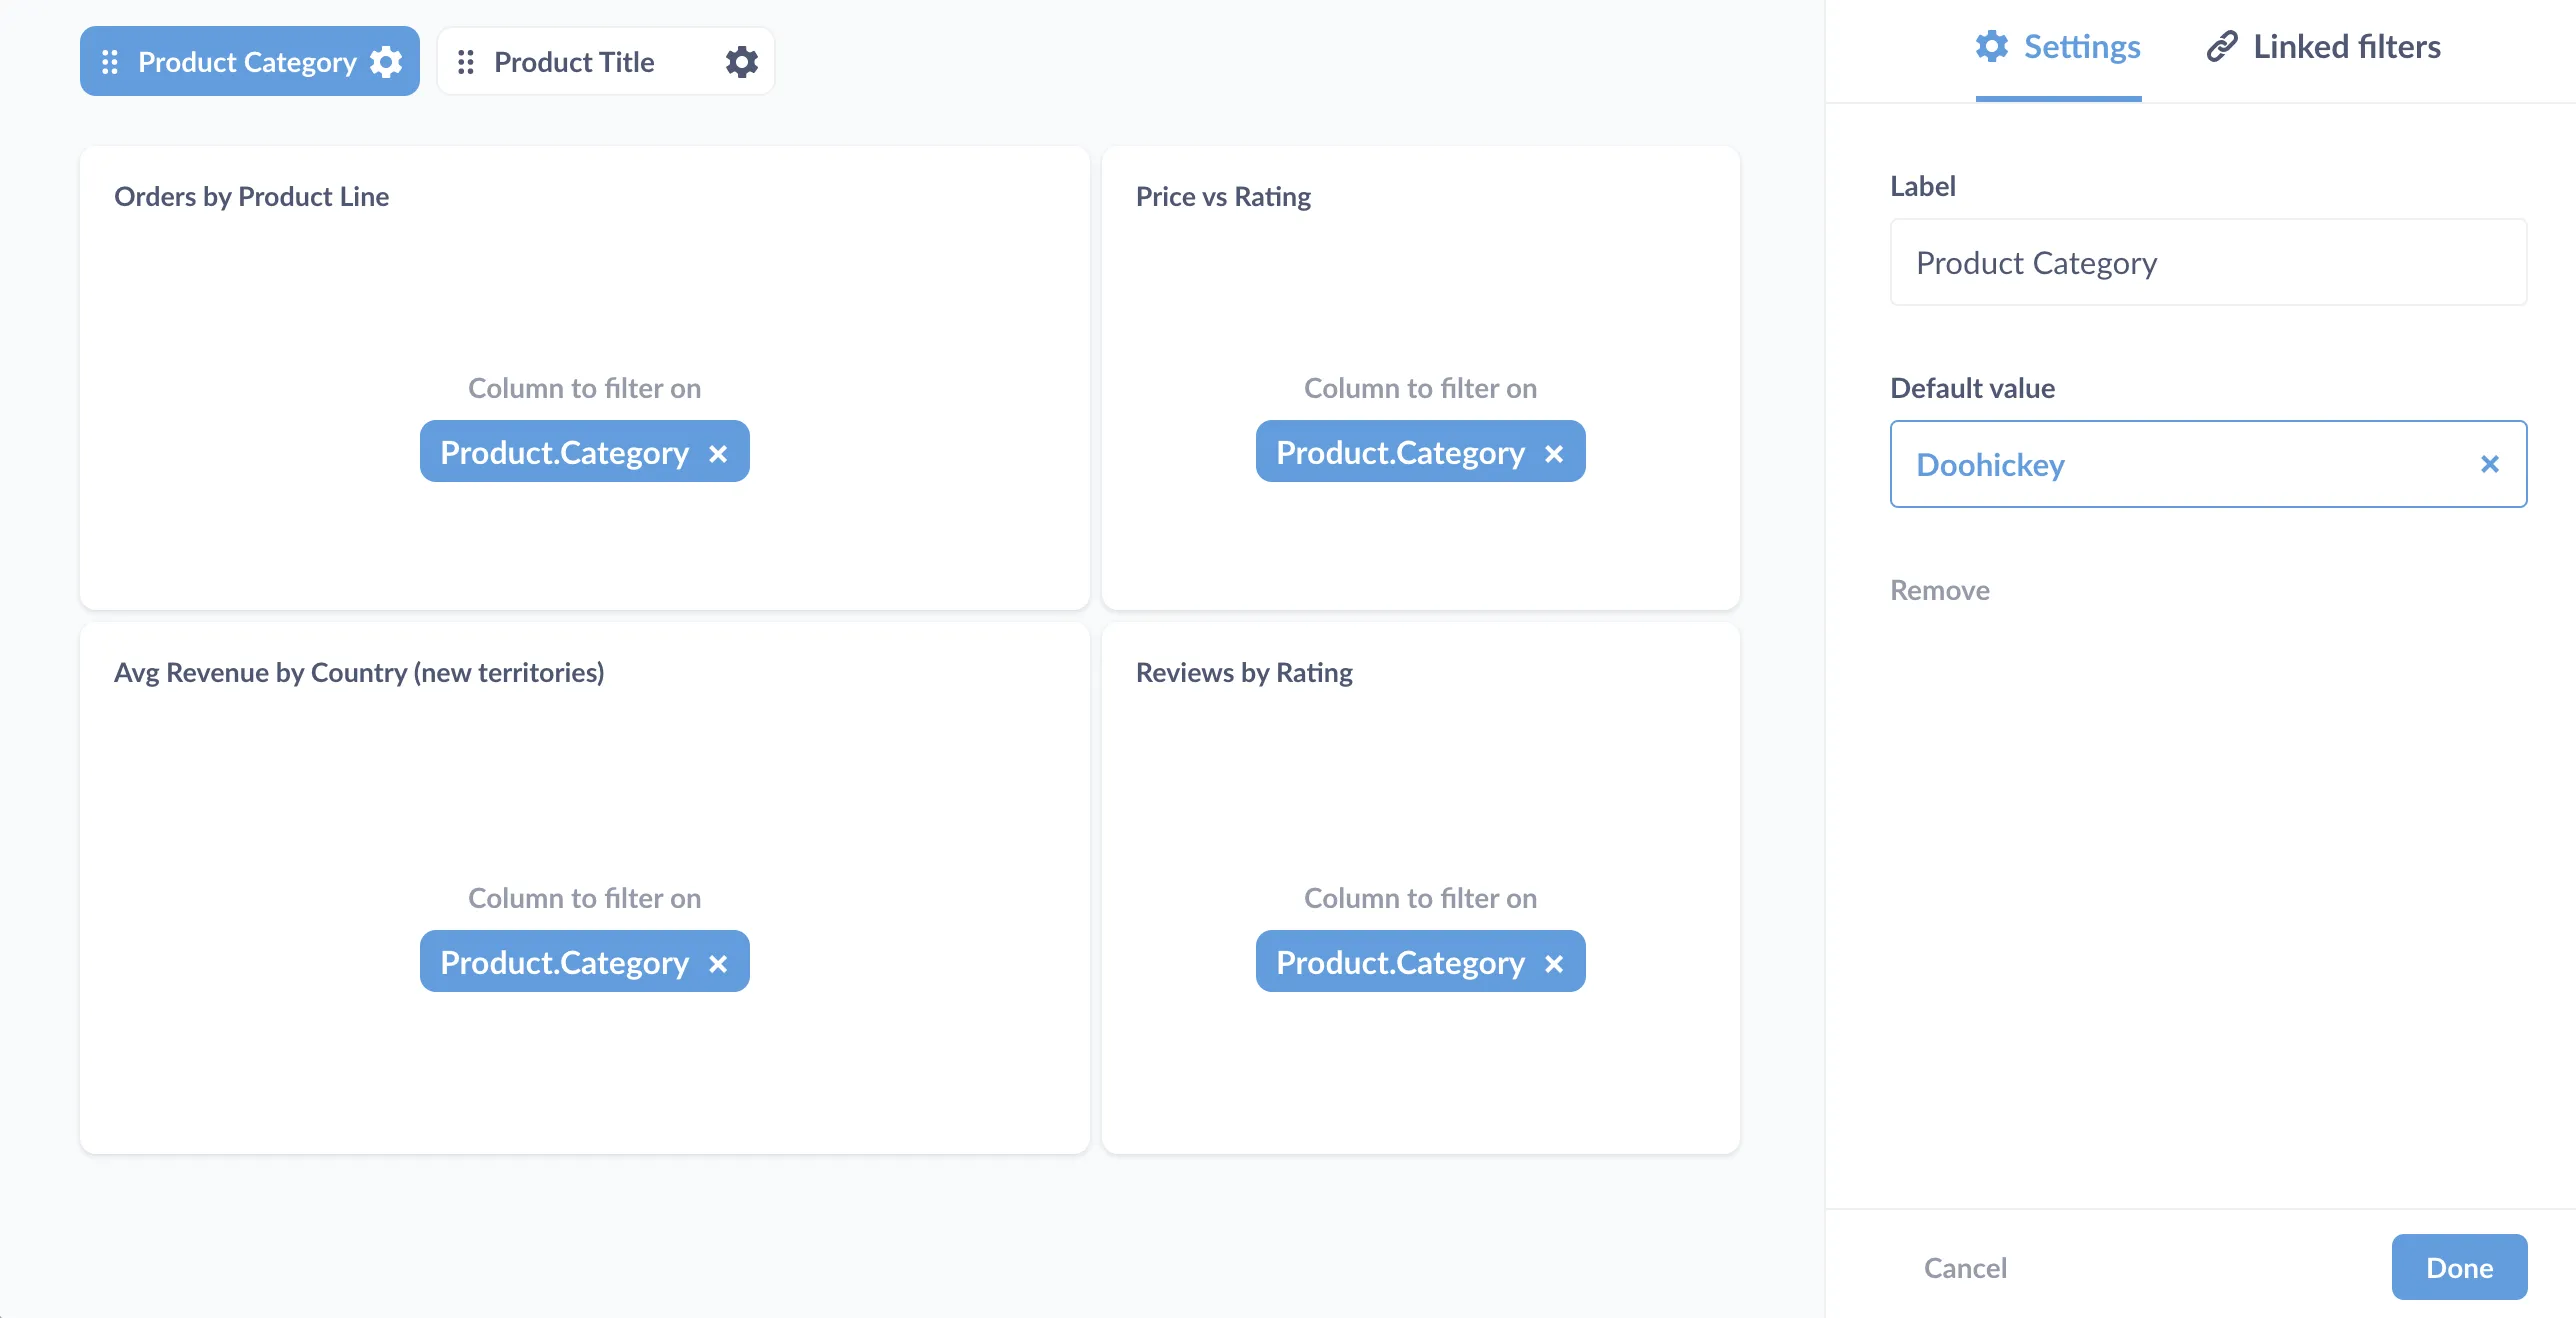
You can link filters, create custom destinations (to send people to another dashboard or external URL), or even have a chart update a filter on click.
Create, update, and delete records
Write back to your databases with actions. You can combine dashboards, models, and actions and other Metabase items to build basic CRUD apps.
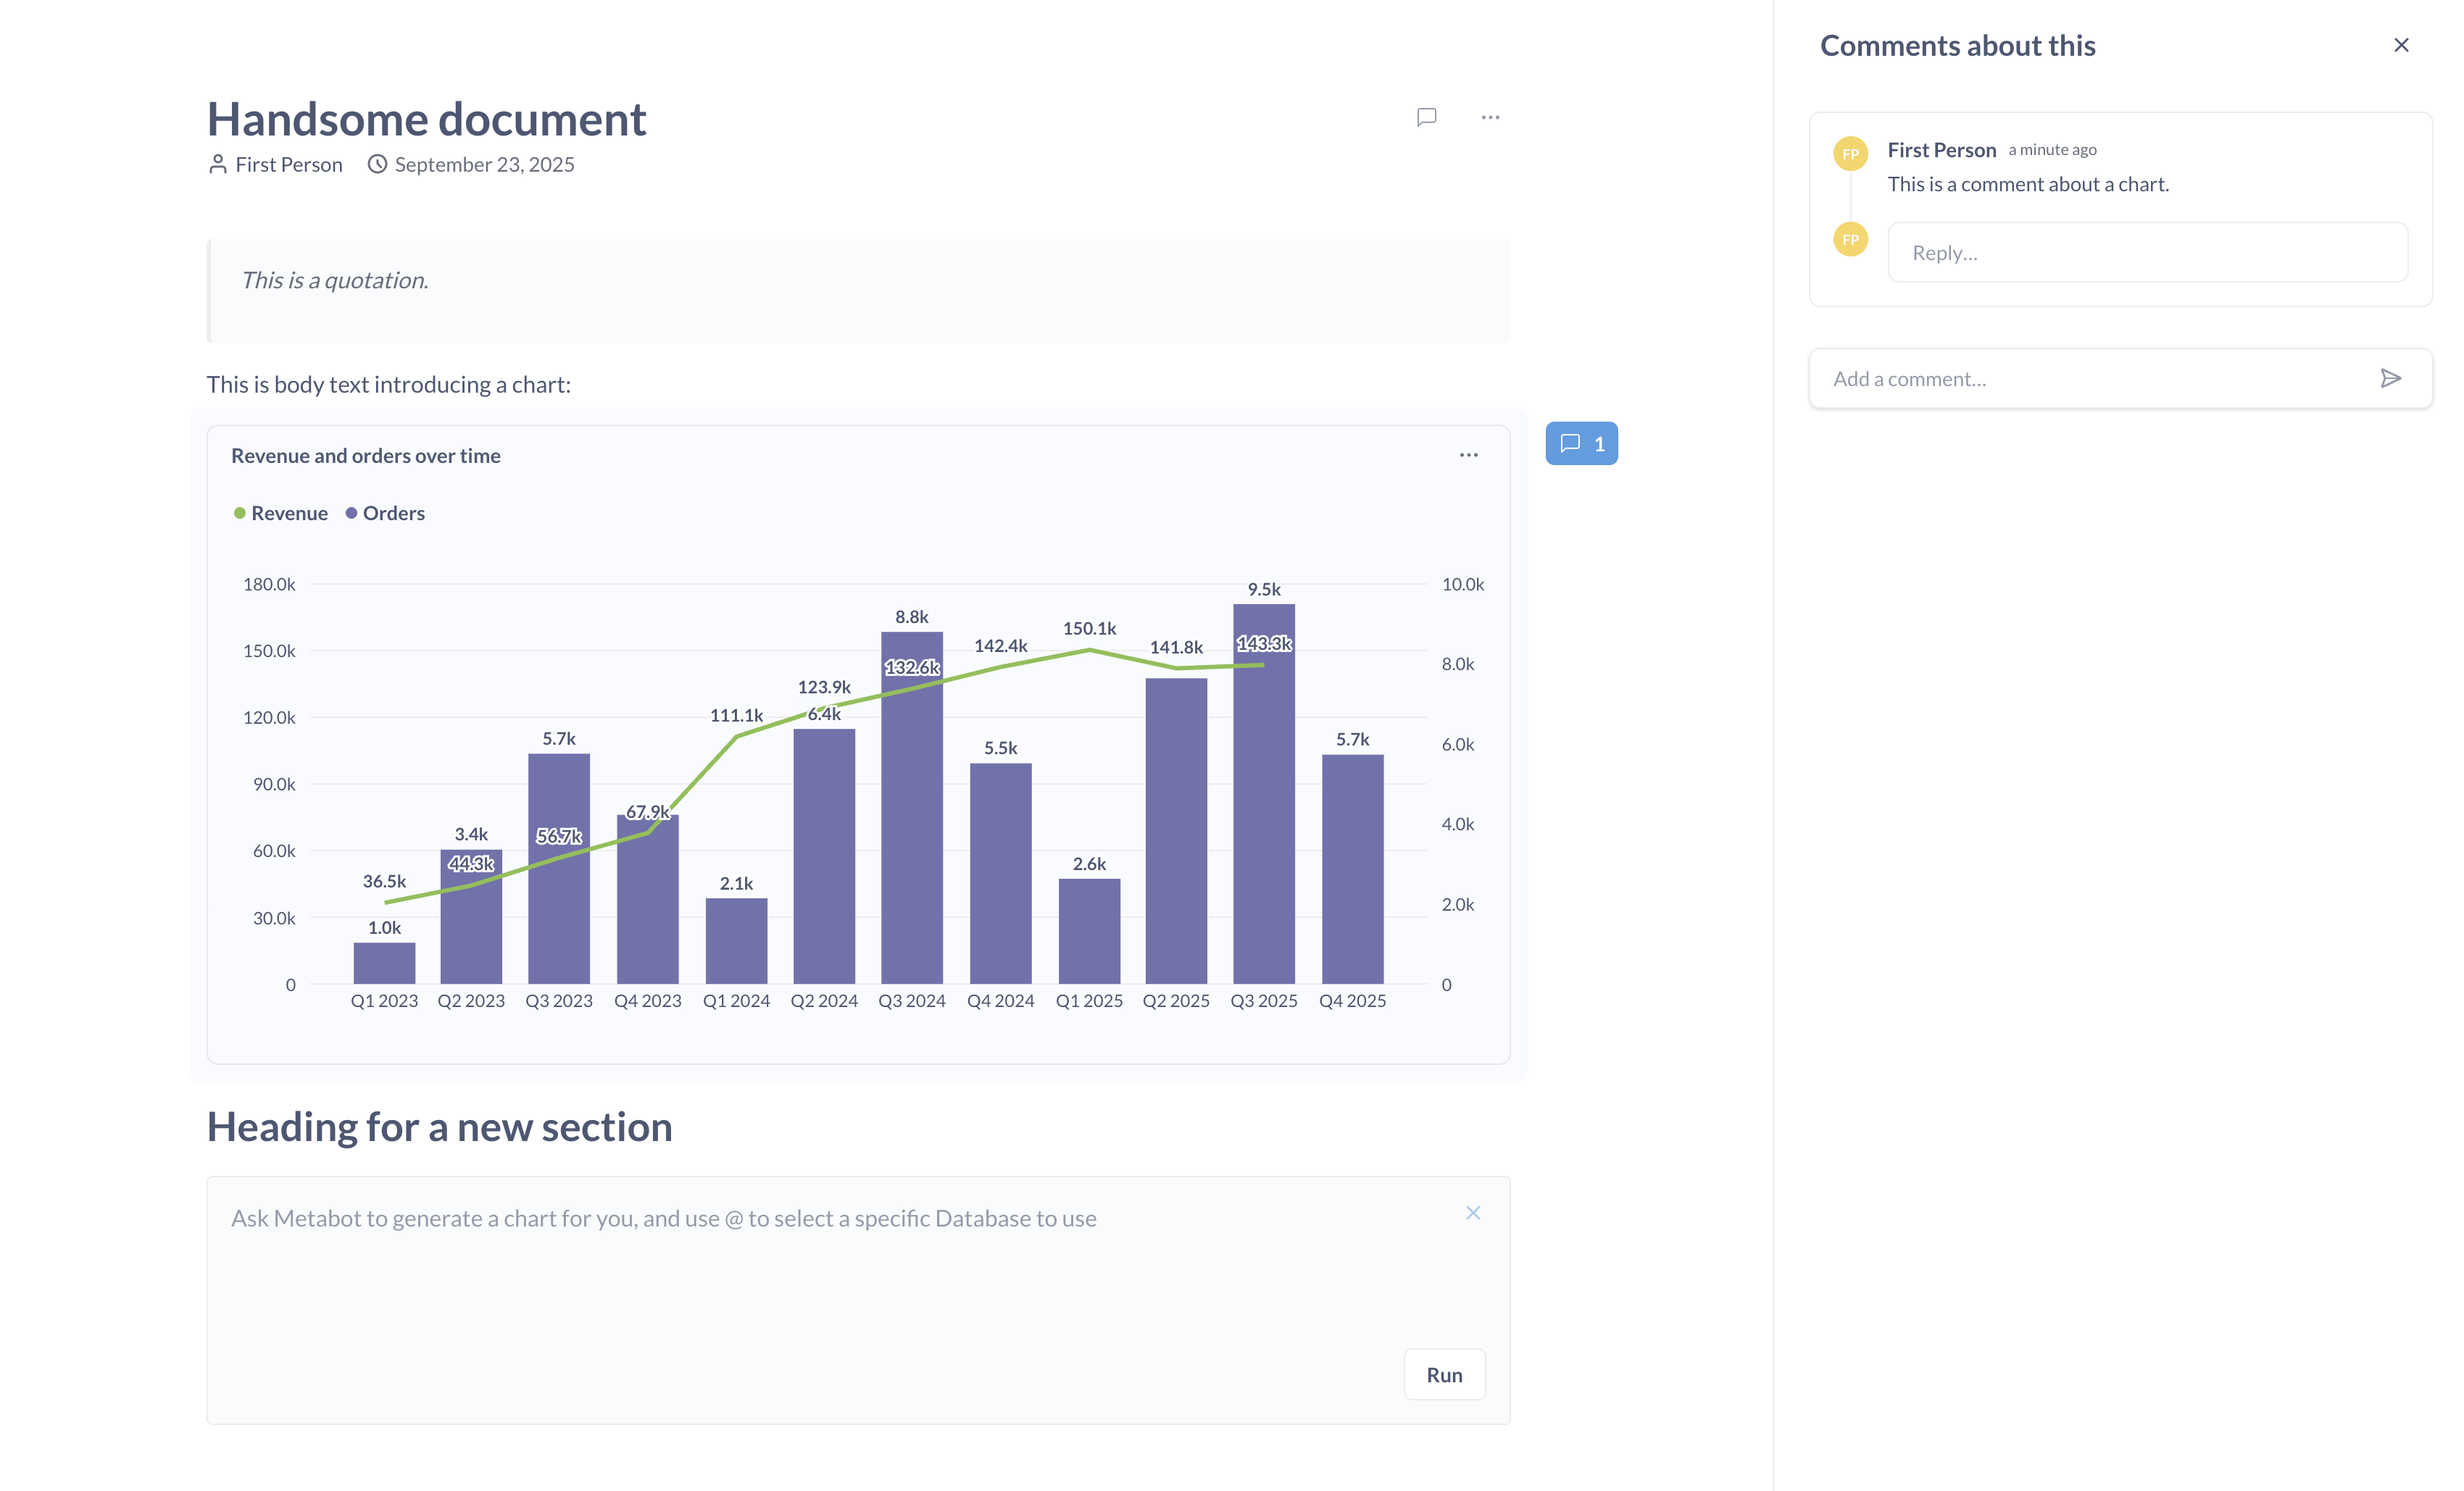
Documents
Use Documents to write long-form analysis. Collaborate through comments with mentions and reactions.
Clean up and curate analytics
Data Studio is the analyst workbench for structuring data and building a semantic layer. It gives data teams a set of tools to shape and curate data so that non-technical people (and Metabot) can get reliable answers.
Library
The Library is your source of truth. Publish tables and metrics to the Library, and they’ll be surfaced first as starting data in the query builder, signaling to your team what’s trustworthy and ready for analysis.
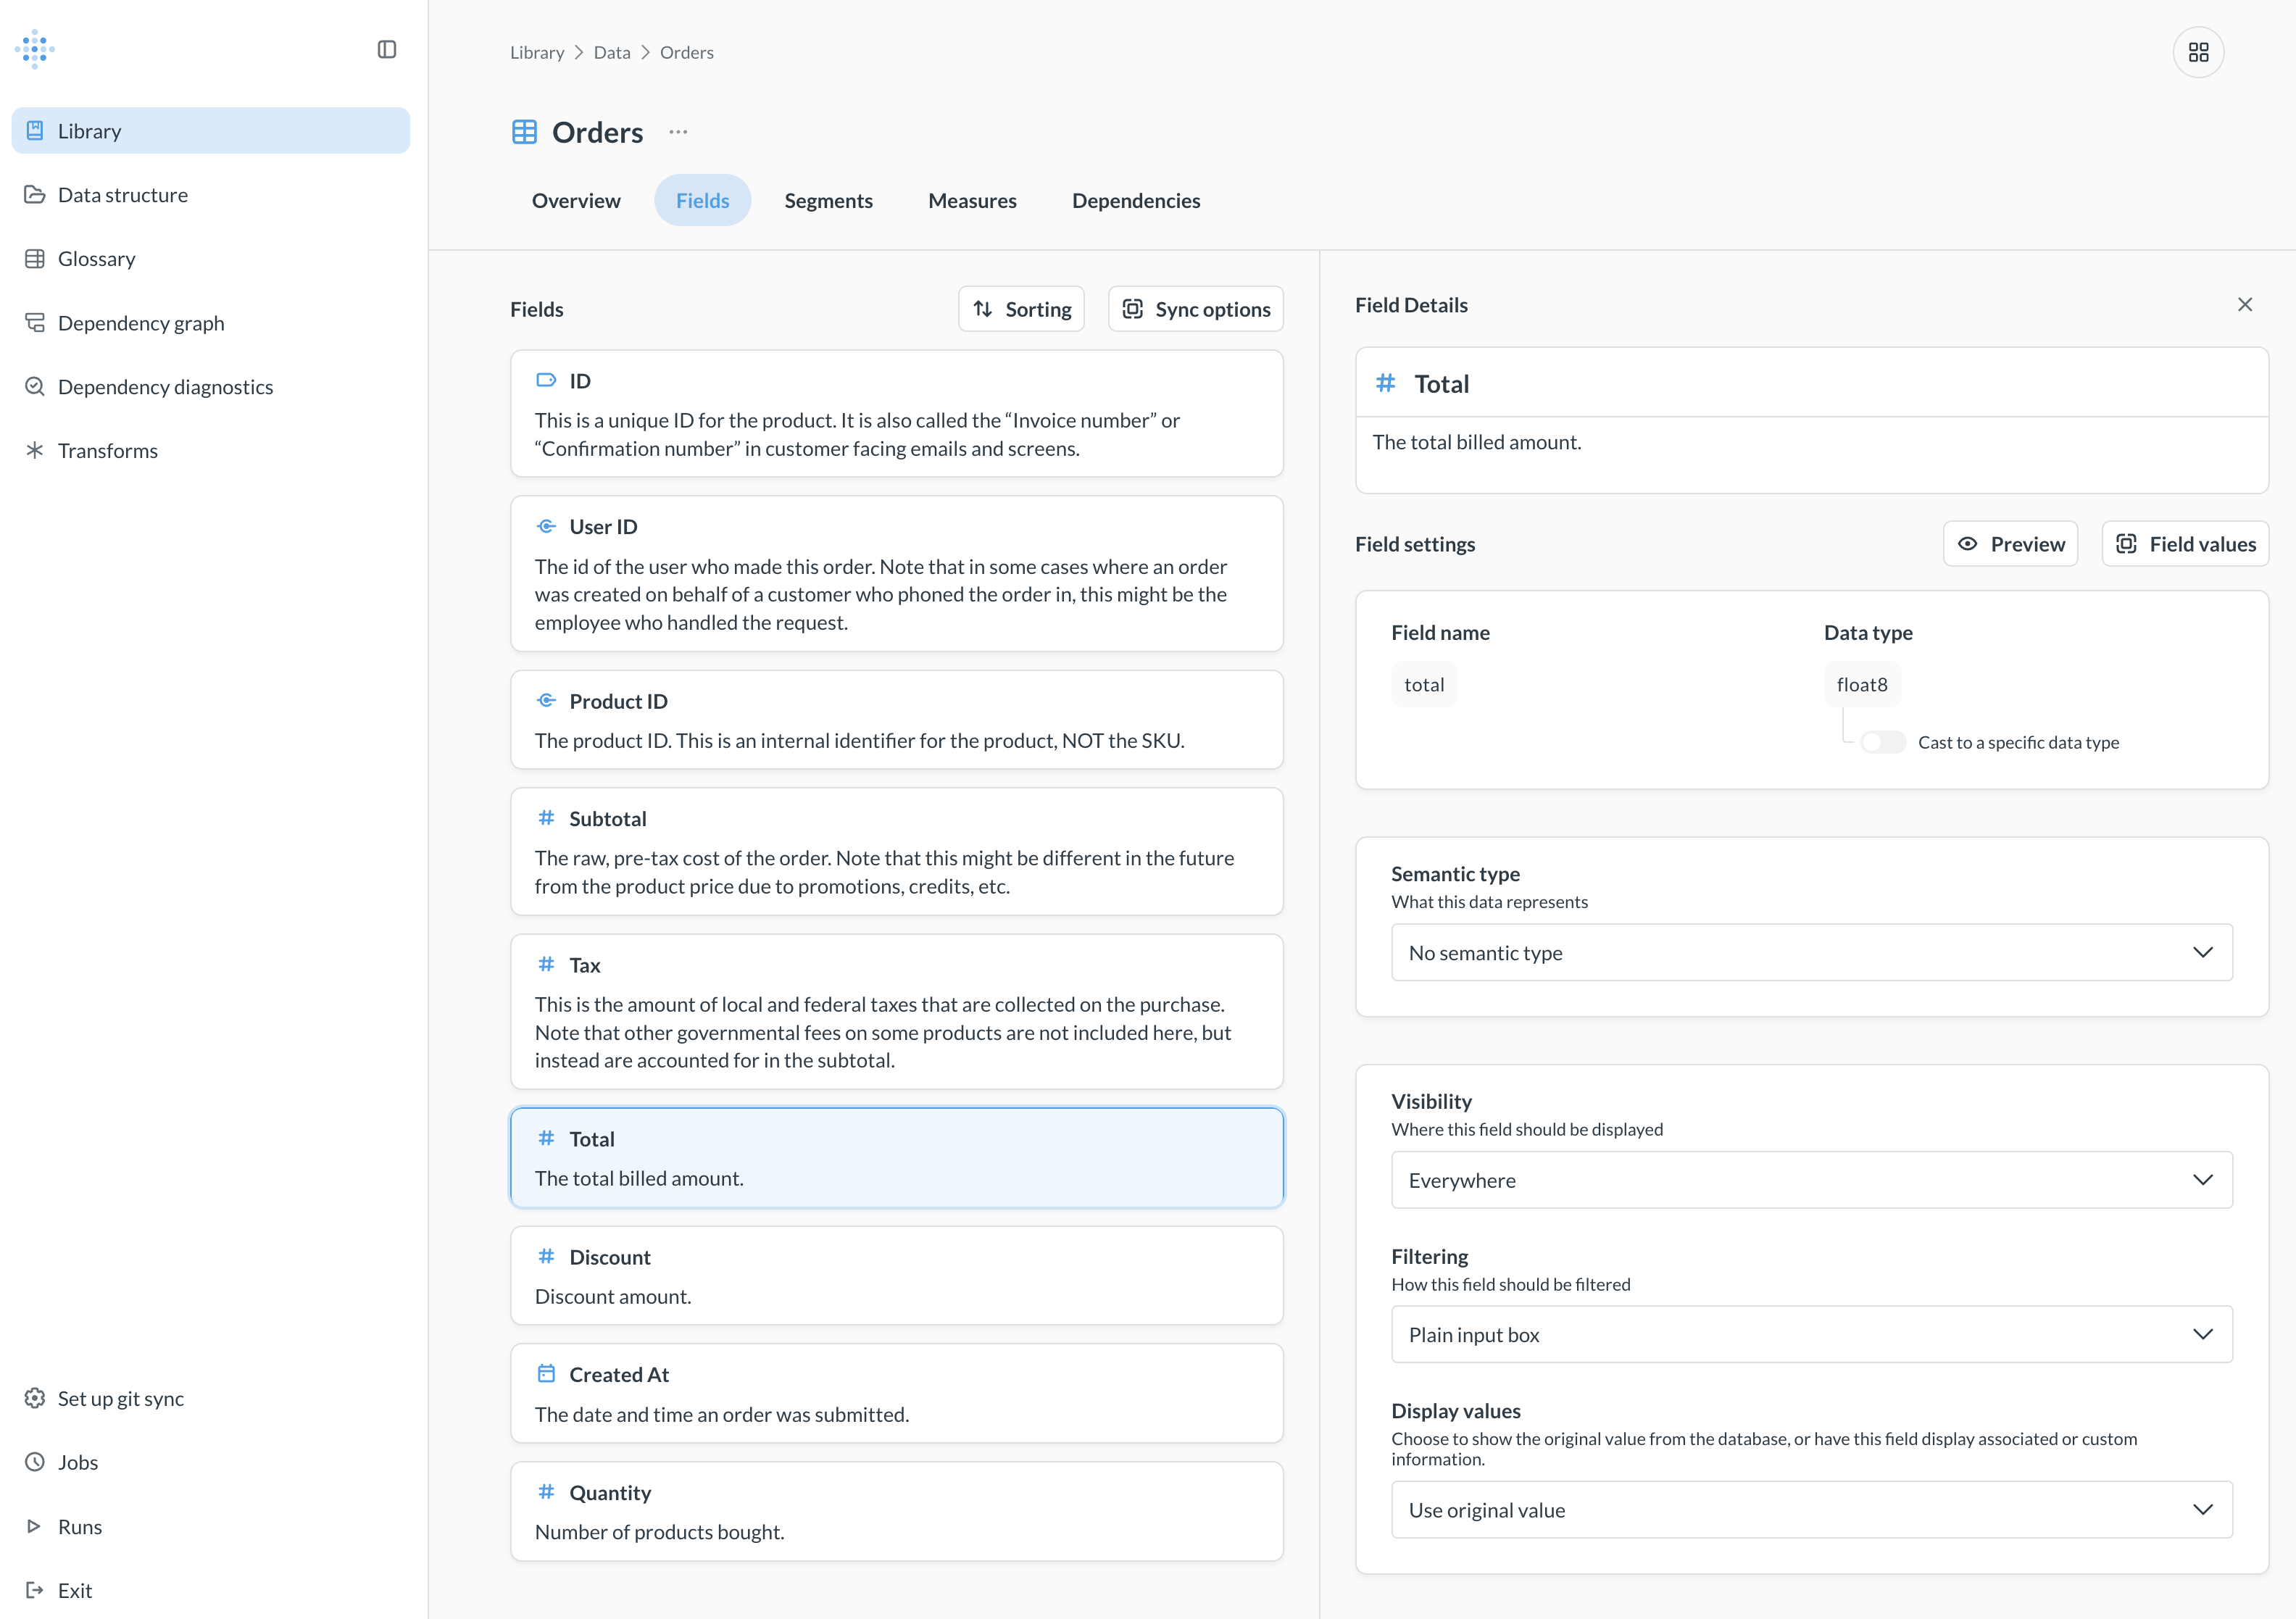
Data structure
Metabase will try to guess how to display the various fields in your tables, but if you want more control, you can visit the Data Structure tab to customize table metadata. Set field visibility, type, formatting, and more.
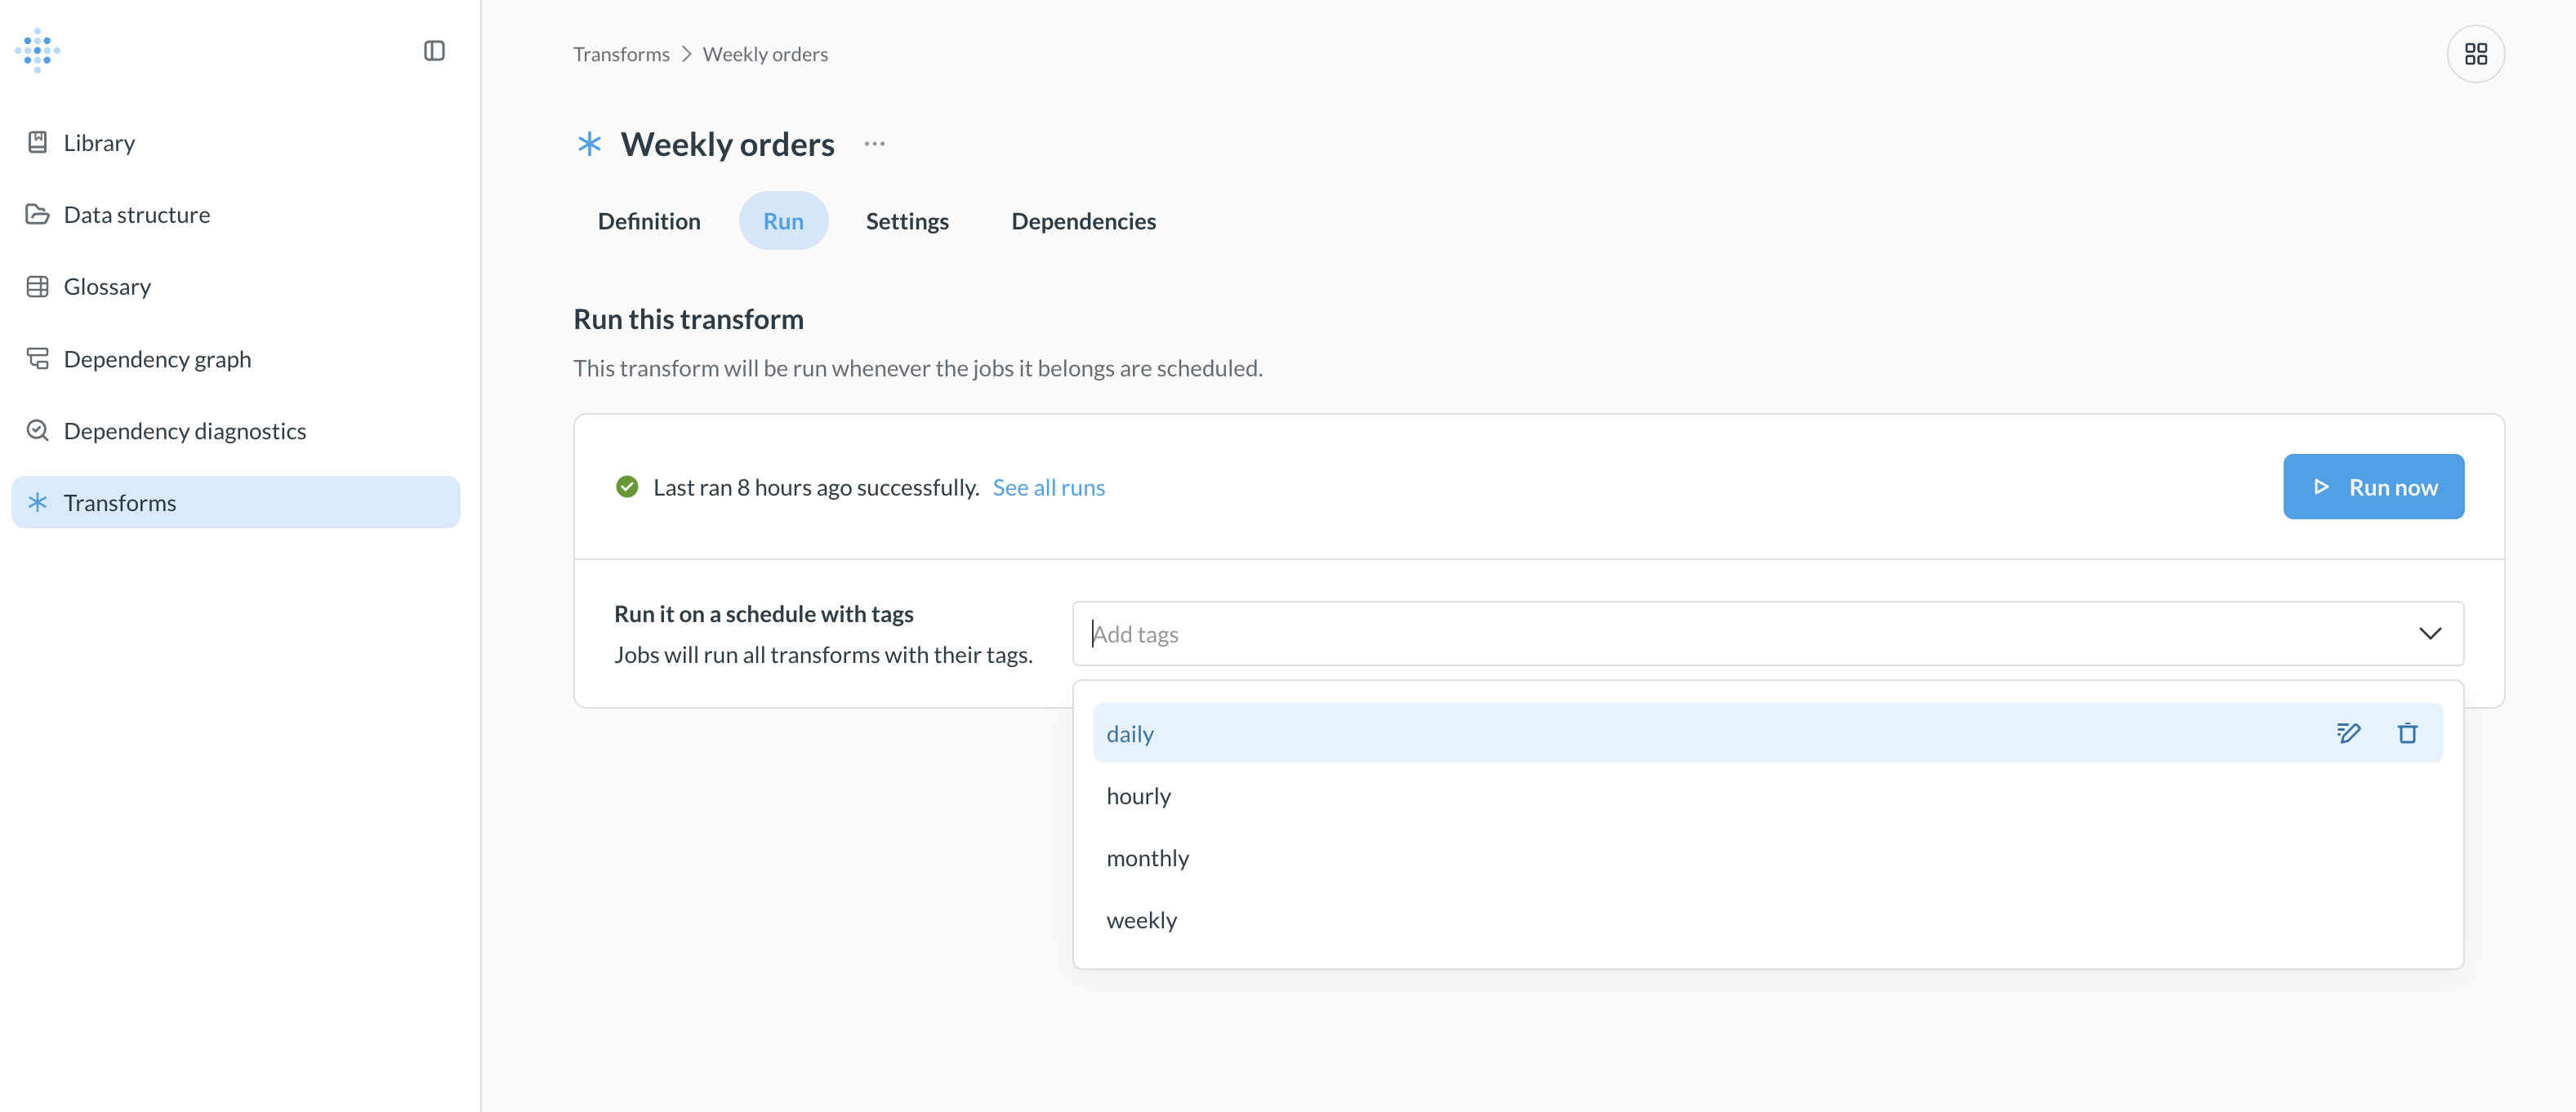
Transforms
Transforms let you use SQL or Python to reshape raw data into analytics-ready tables. Use SQL transforms for straightforward modeling, or opt for Python when you need more complex logic. Transforms are the recommended successor to persistent models.
Segments and measures
Measures are predefined aggregations associated with tables. You can also use segments to predefine filters on a table (like to filter cohorts), which people can select when building new queries.
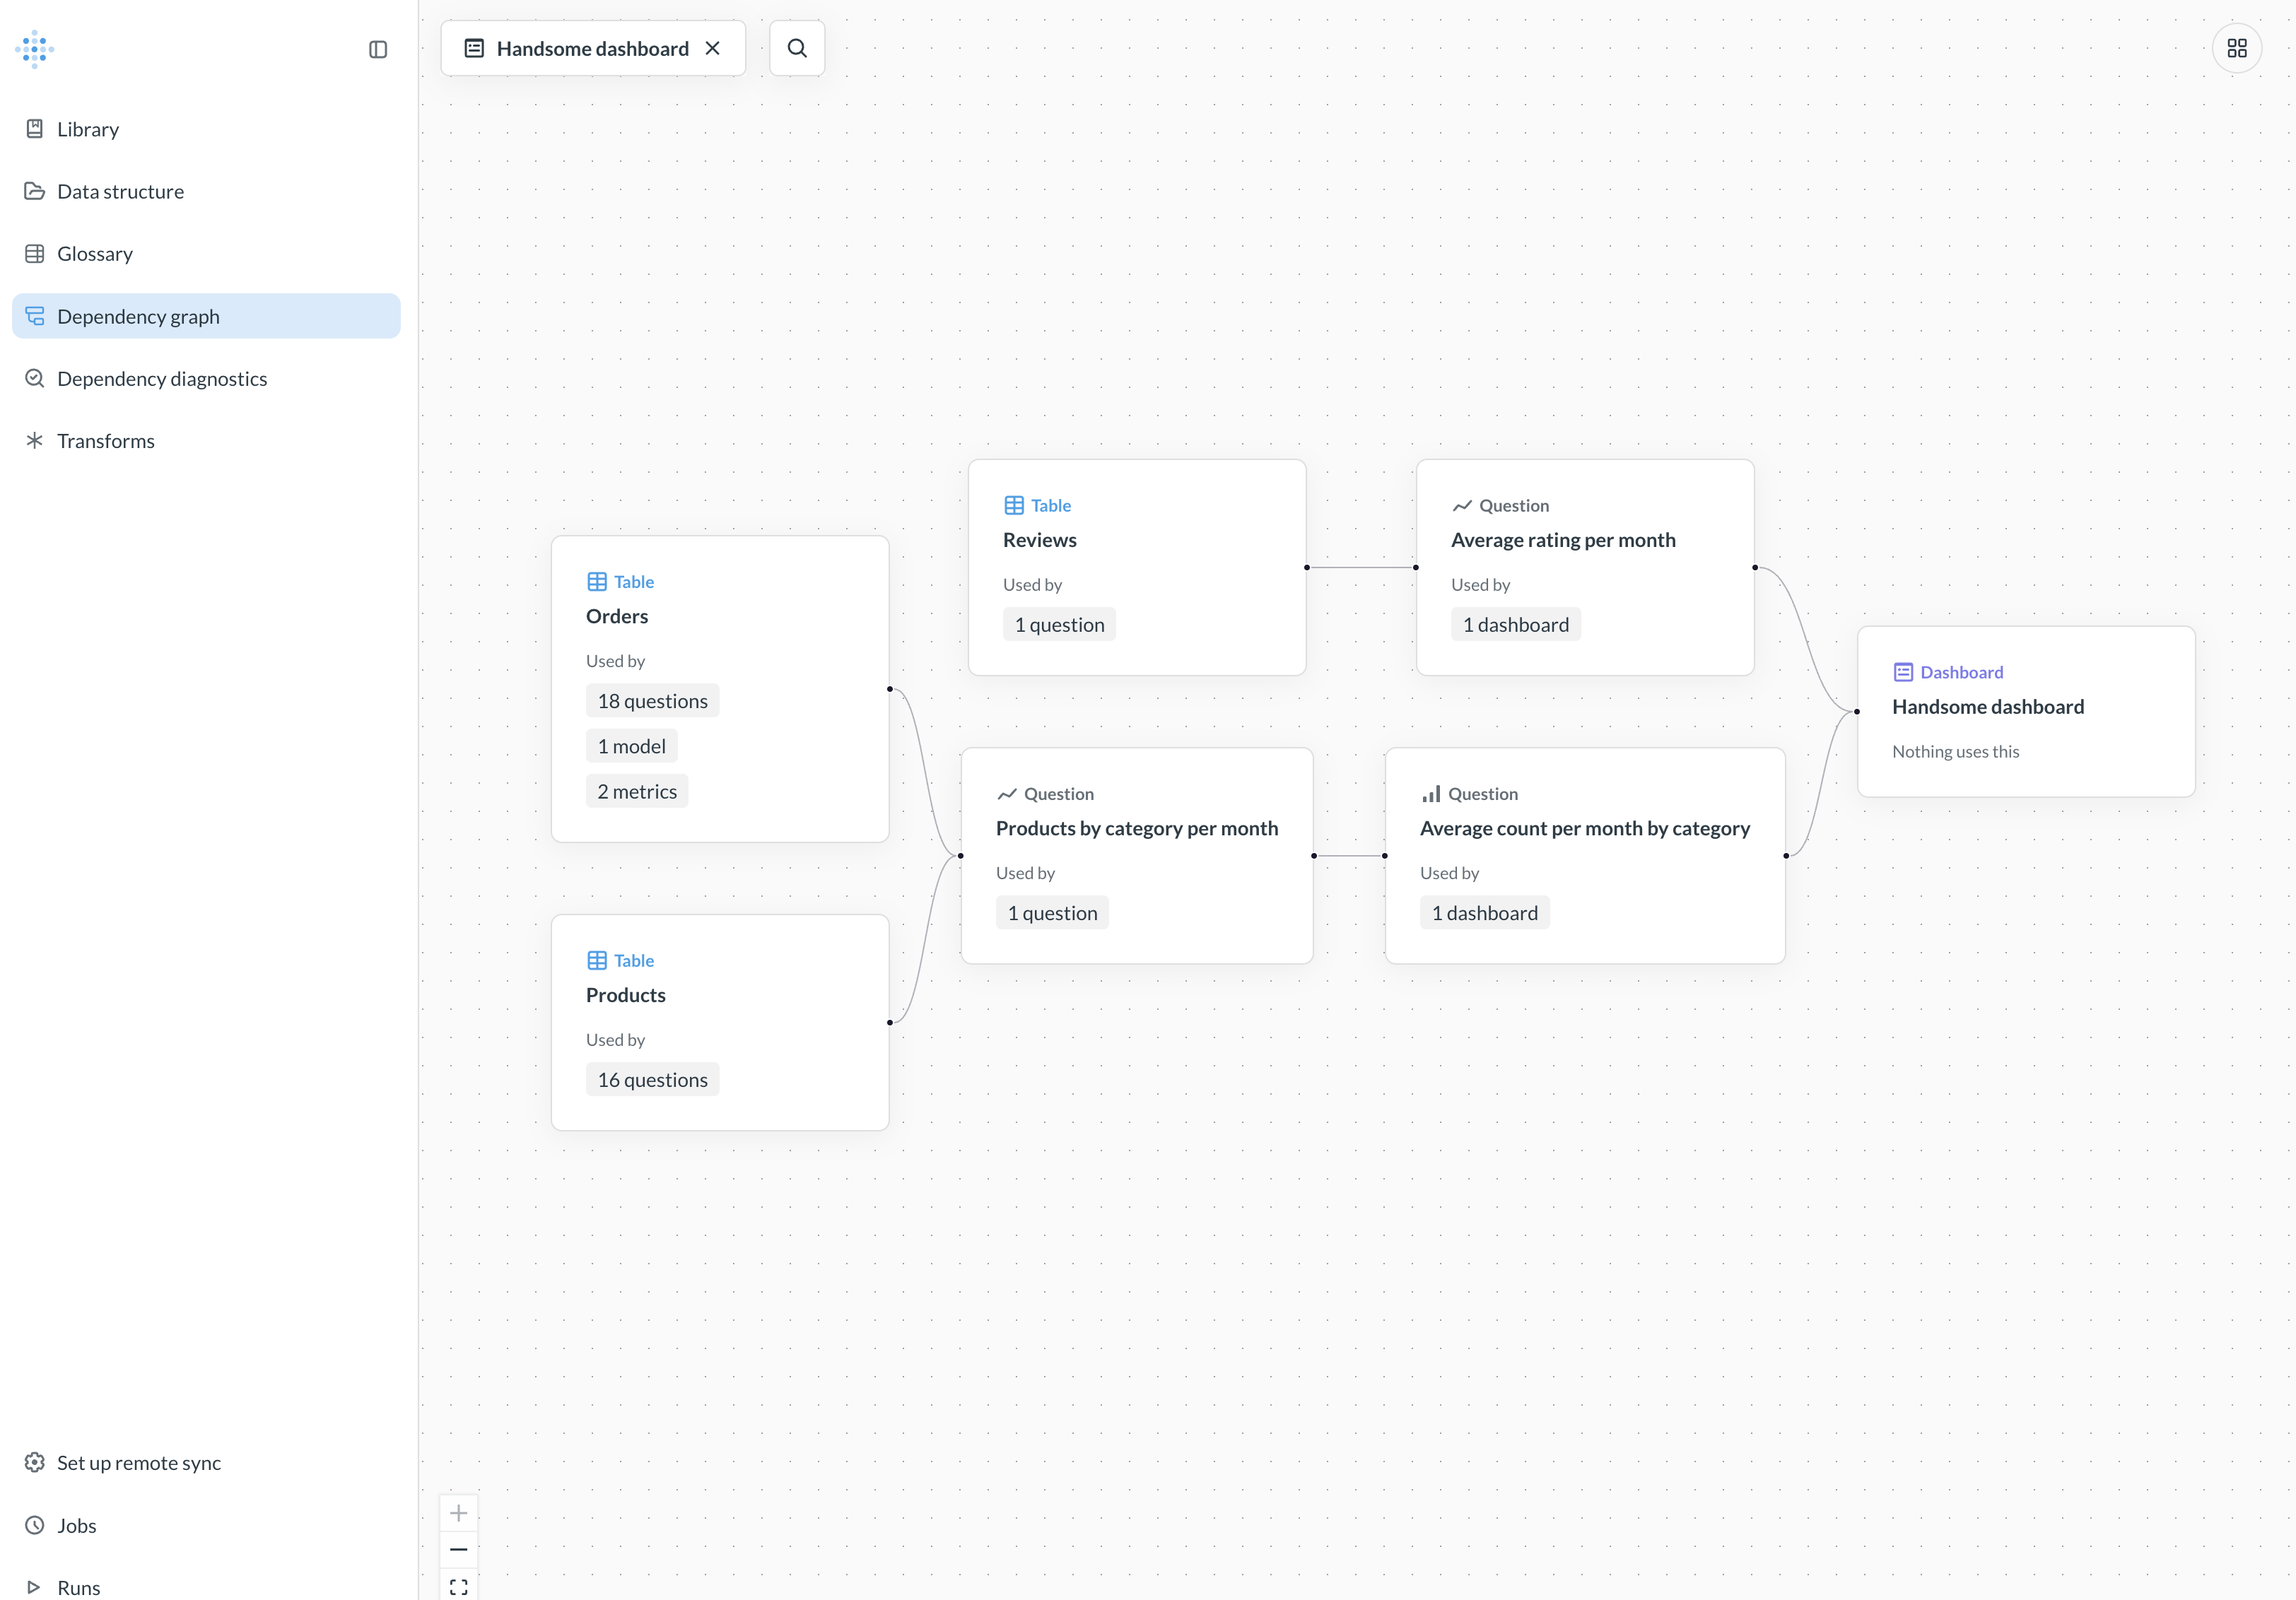
Dependencies and diagnostics
The dependency graph is a visual map of what depends on what, so you can understand the blast radius of a change before you make it. Dependency diagnostics helps you find and fix broken entities and clean up unreferenced items.
Glossary
Define organization-specific terms in the glossary so everyone is on the same page about what your data means.
Remote sync
To version your changes, you can sync your Library to a git repo with remote sync.
Share your results
Once you’ve asked questions and built dashboards, it’s time to share your analysis.
Alerts
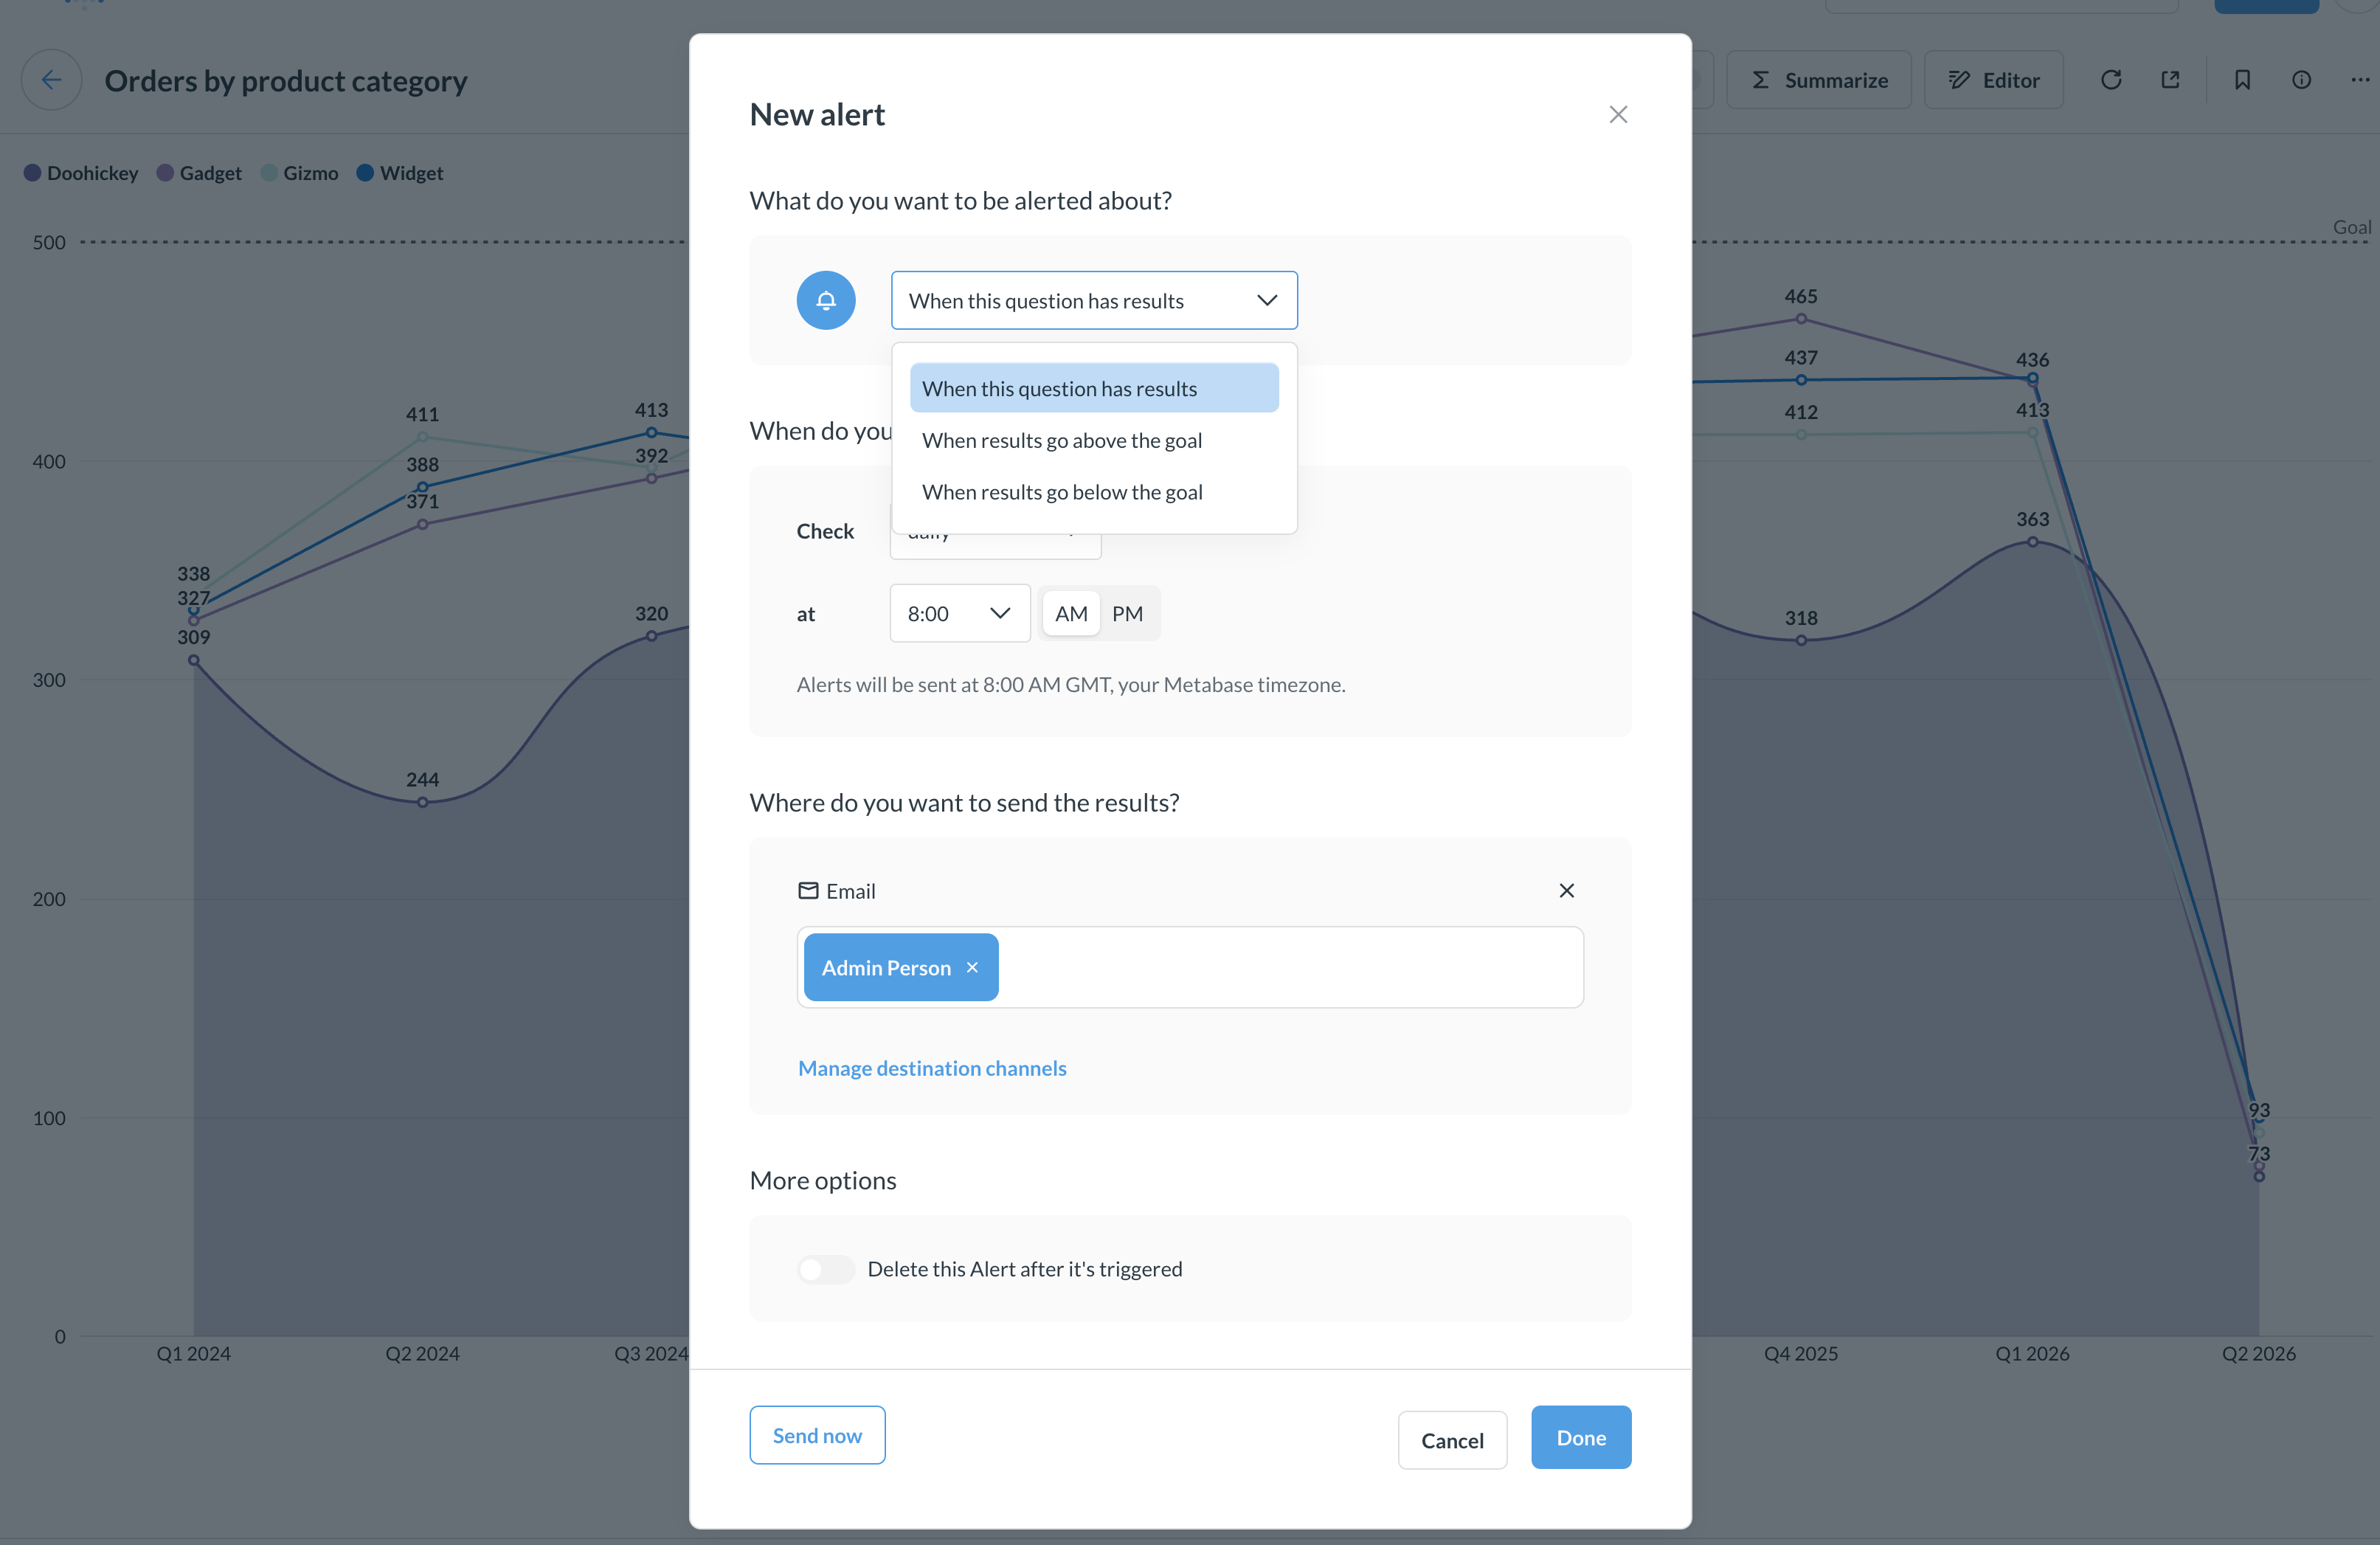
Set up an alert to notify people when the results meet a goal. You can send out alerts via email or Slack, or to a webhook.
Dashboard subscriptions
To keep people posted on key metrics, you can set up dashboard subscriptions via email or Slack - even to people who lack an account in your Metabase.
Embed questions, dashboards, AI chat, and more
Metabase offers several ways to embed charts and dashboards in your applications:
- Modular Embedding: Individual components via JavaScript snippets or the React SDK, with full styling and interactivity control. Use Guest Embeds for simple charts in your app, or couple with SSO to give people drill-through, AI chat, and more.
- Full-app Embedding: The entire Metabase application in an iframe for multi-tenant, self-service analytics.
Tenants
Tenants help you manage multi-tenant isolation setups, which make sure each customer only sees their data.
Sample app
Check out a sample repo, Shoppy, that uses the Modular Embedding SDK, or mess around with the playground.
Find things and stay organized
You’re going to make a lot of stuff; Metabase helps you keep track of it.
Search
You know, to find things: data, metrics, segments, dashboards, models, and questions. You’ll probably use the search bar the most often, but the catch here is that you need to know what to search for.
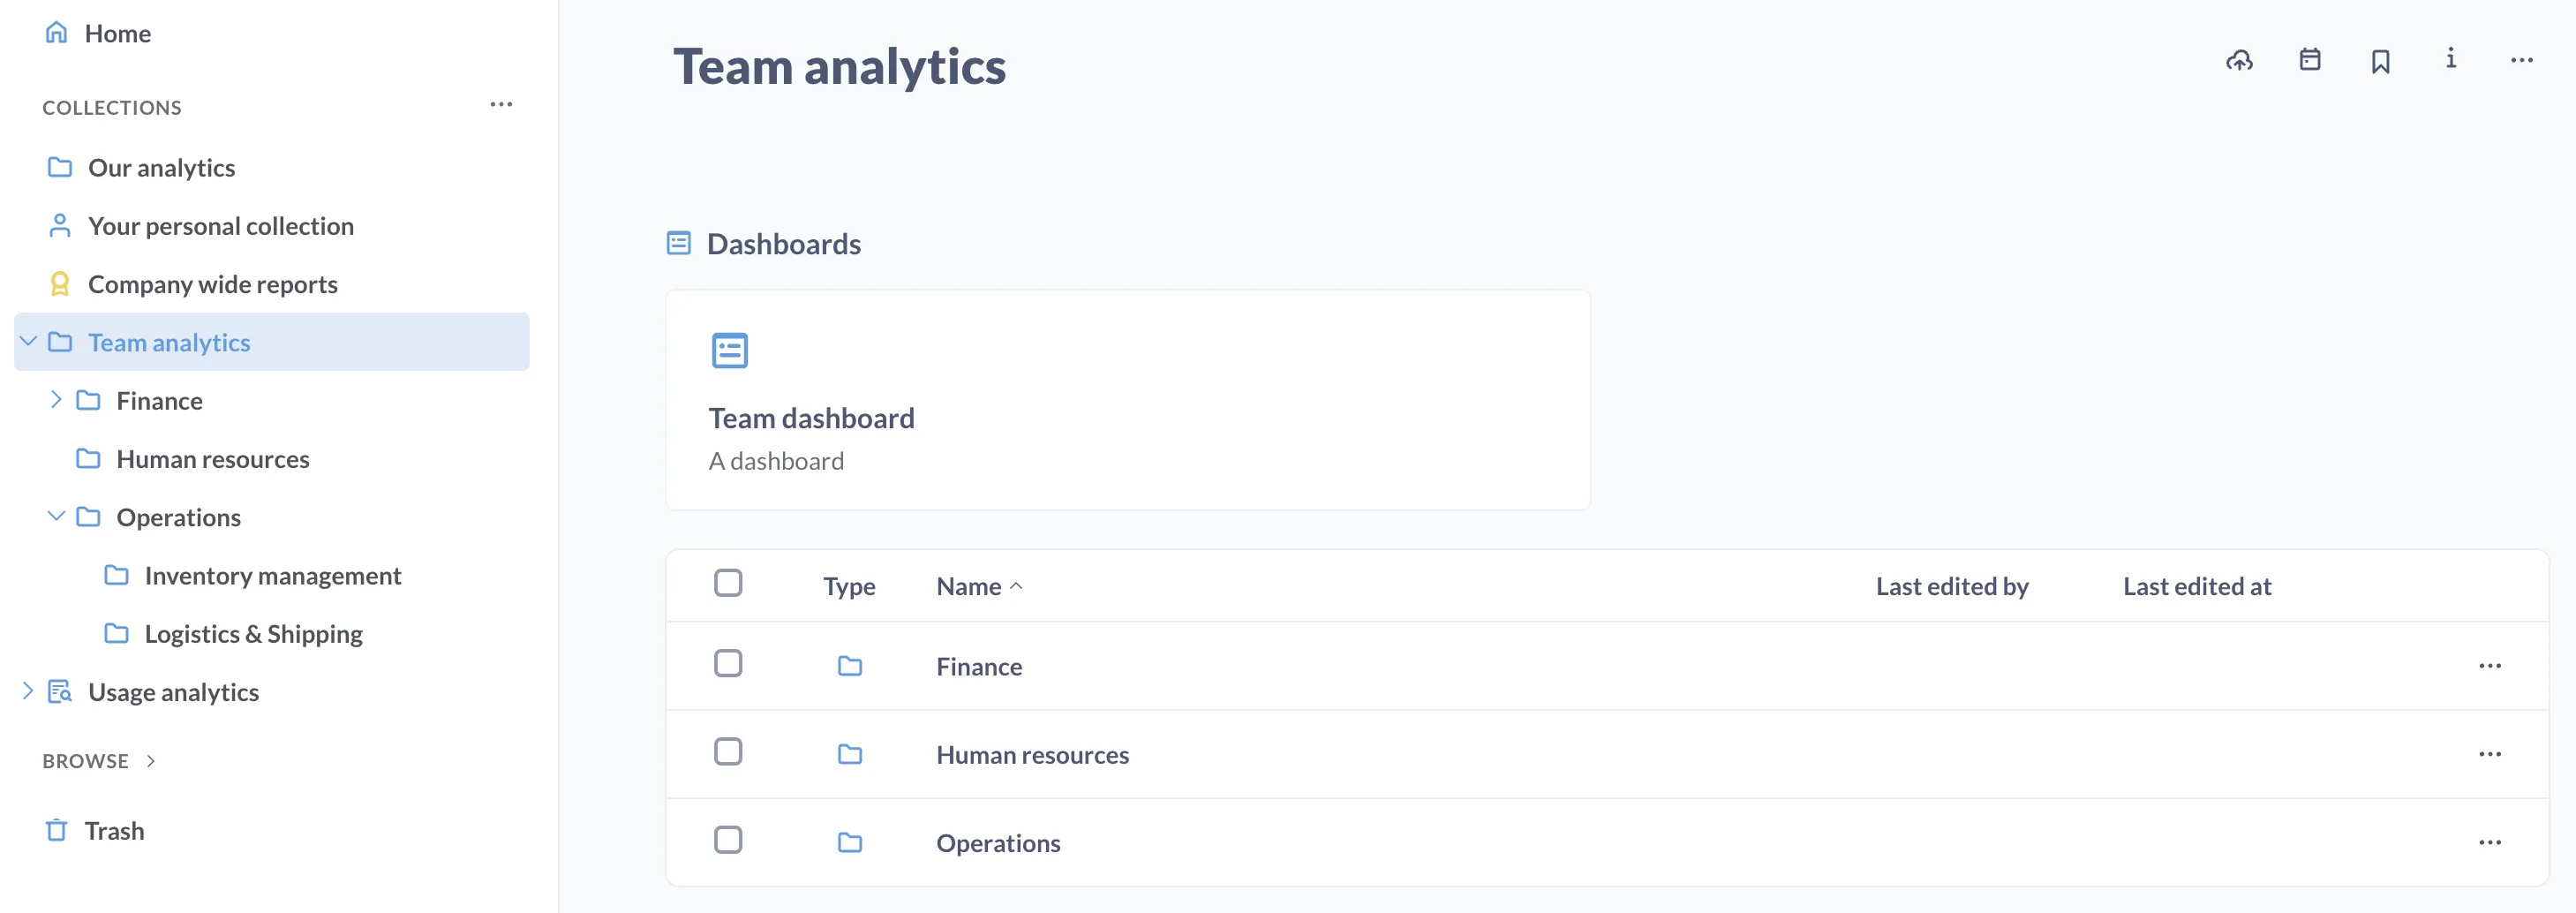
Organize with collections
Collections organize questions, models, dashboards, and other collections. They work like folders on a file system, and you can set permissions on collections, giving some groups edit, view, or no access. Groups with edit access to a collection can pin the most important items to the collection - your “official” dashboards.
Events and timelines
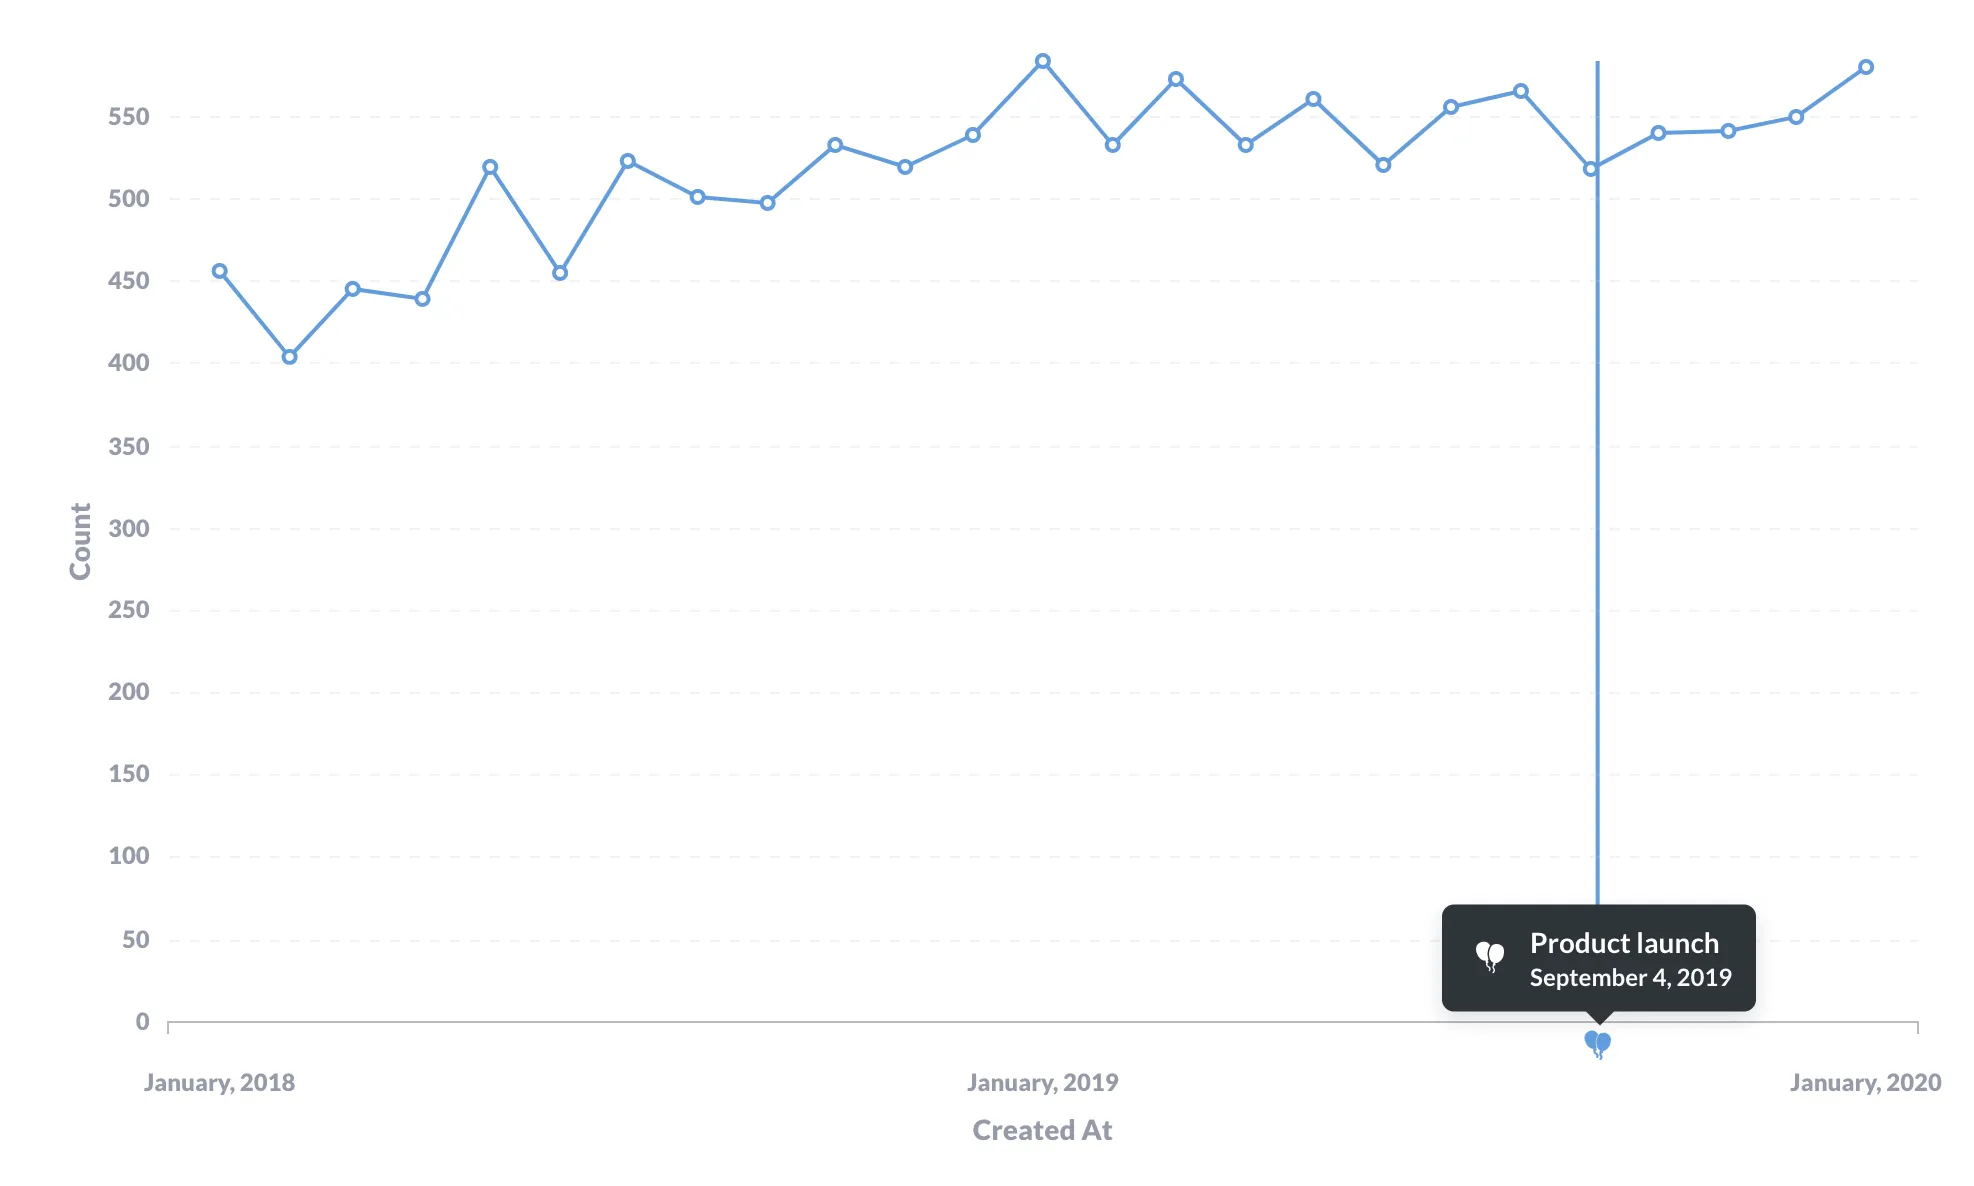
Events and timelines let you capture important dates and make that knowledge available when you need it (that is, when you’re viewing a time series). You can organize events into timelines, and associate those timelines with collections.
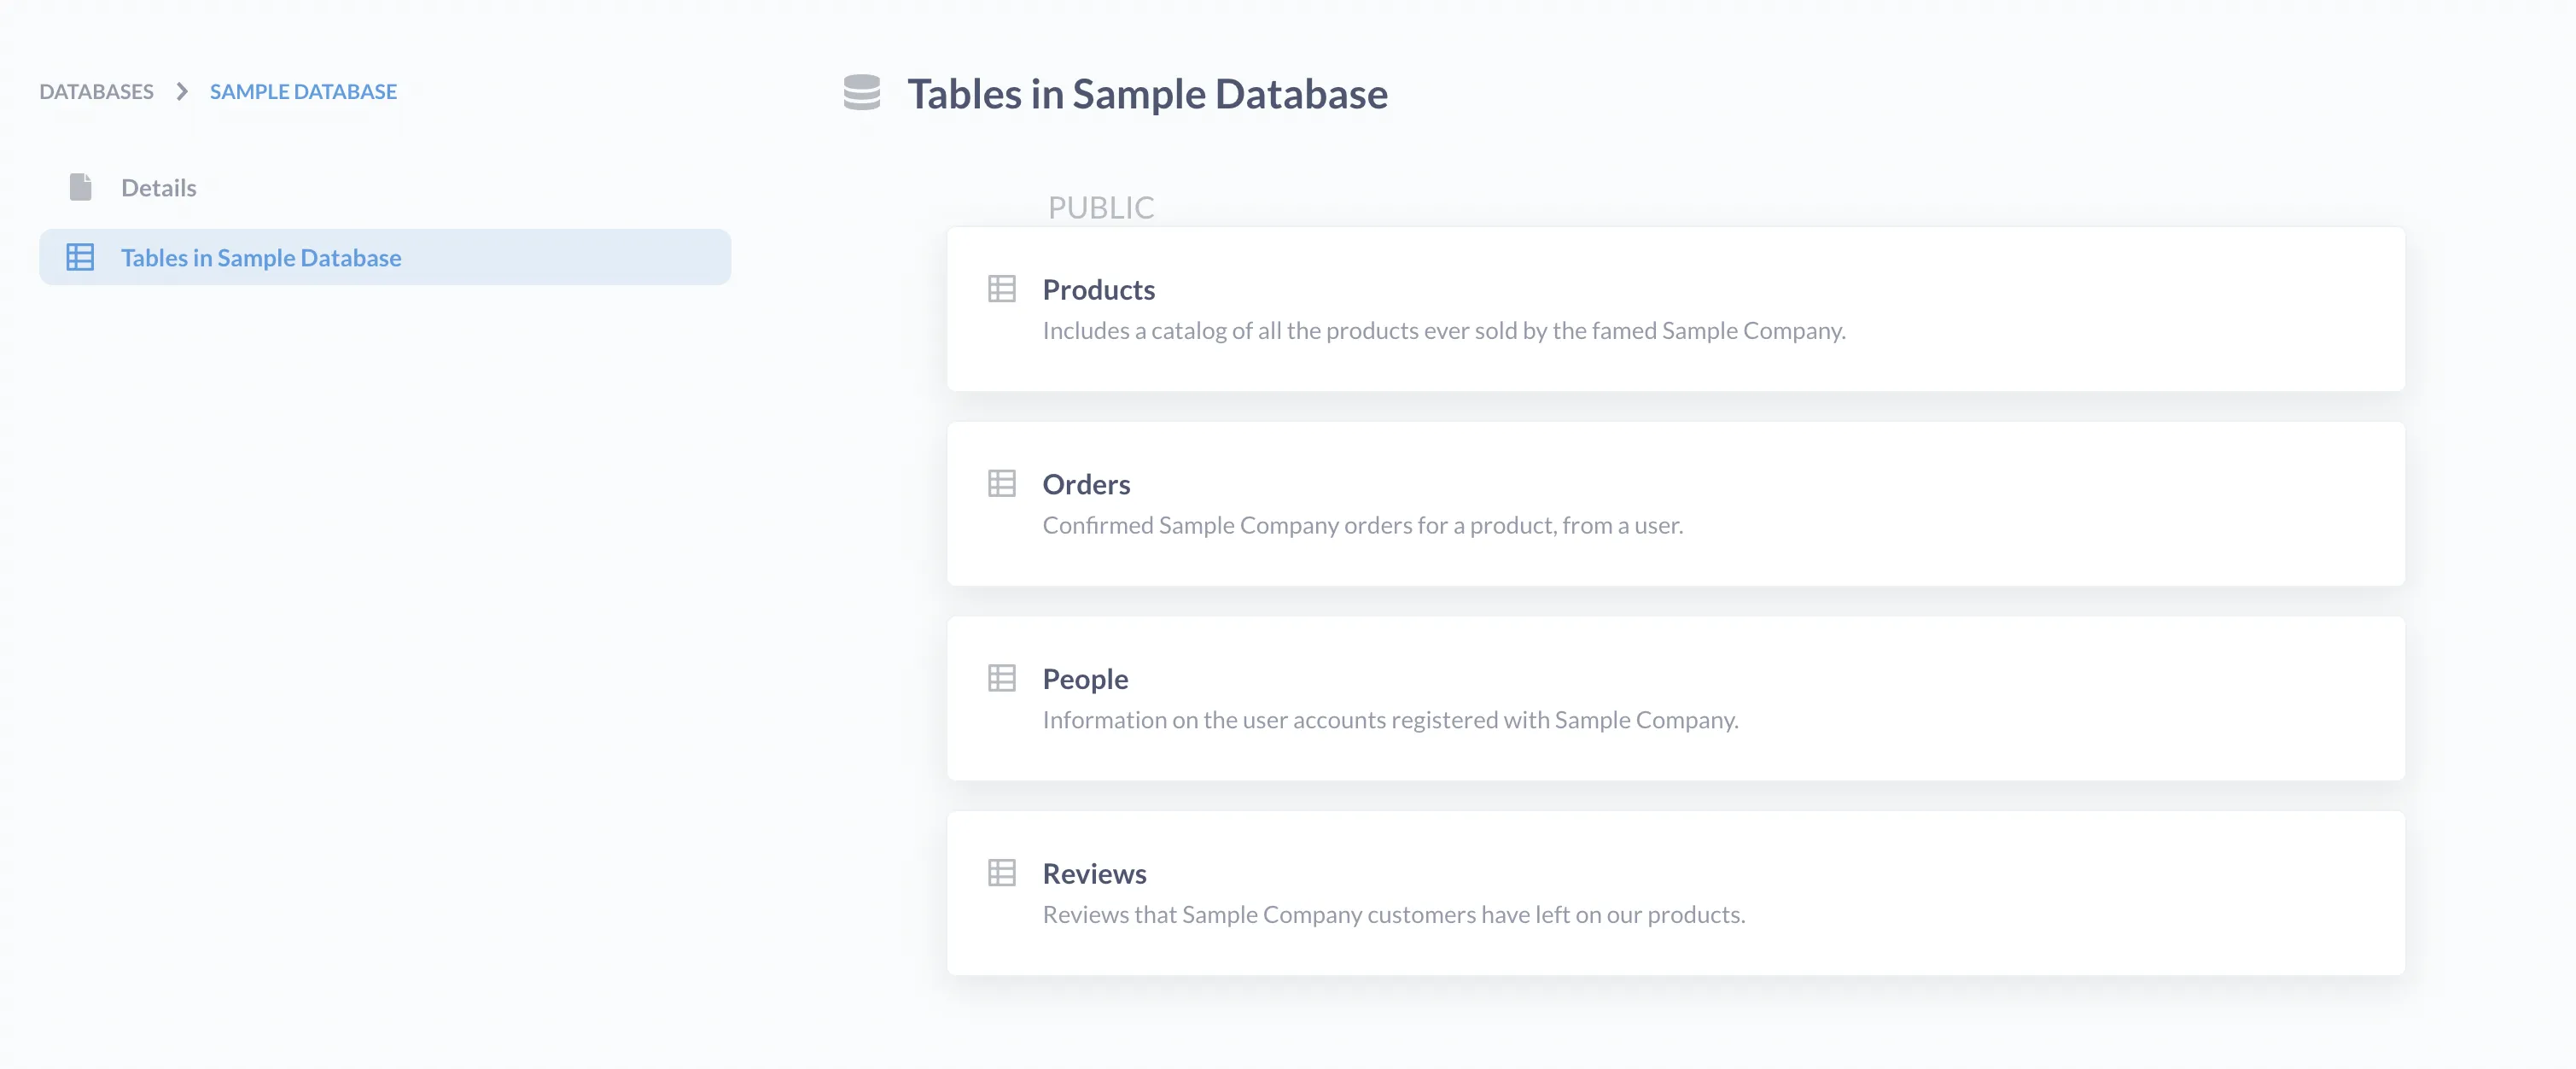
Browse data, models, and metrics
You can browse all the databases, models, and metrics available in your Metabase. If you’ve set up the Library, curated tables and metrics are surfaced first for easier discovery.
You can browse tables and their fields, see sample data, as well as a list of questions that query that data.
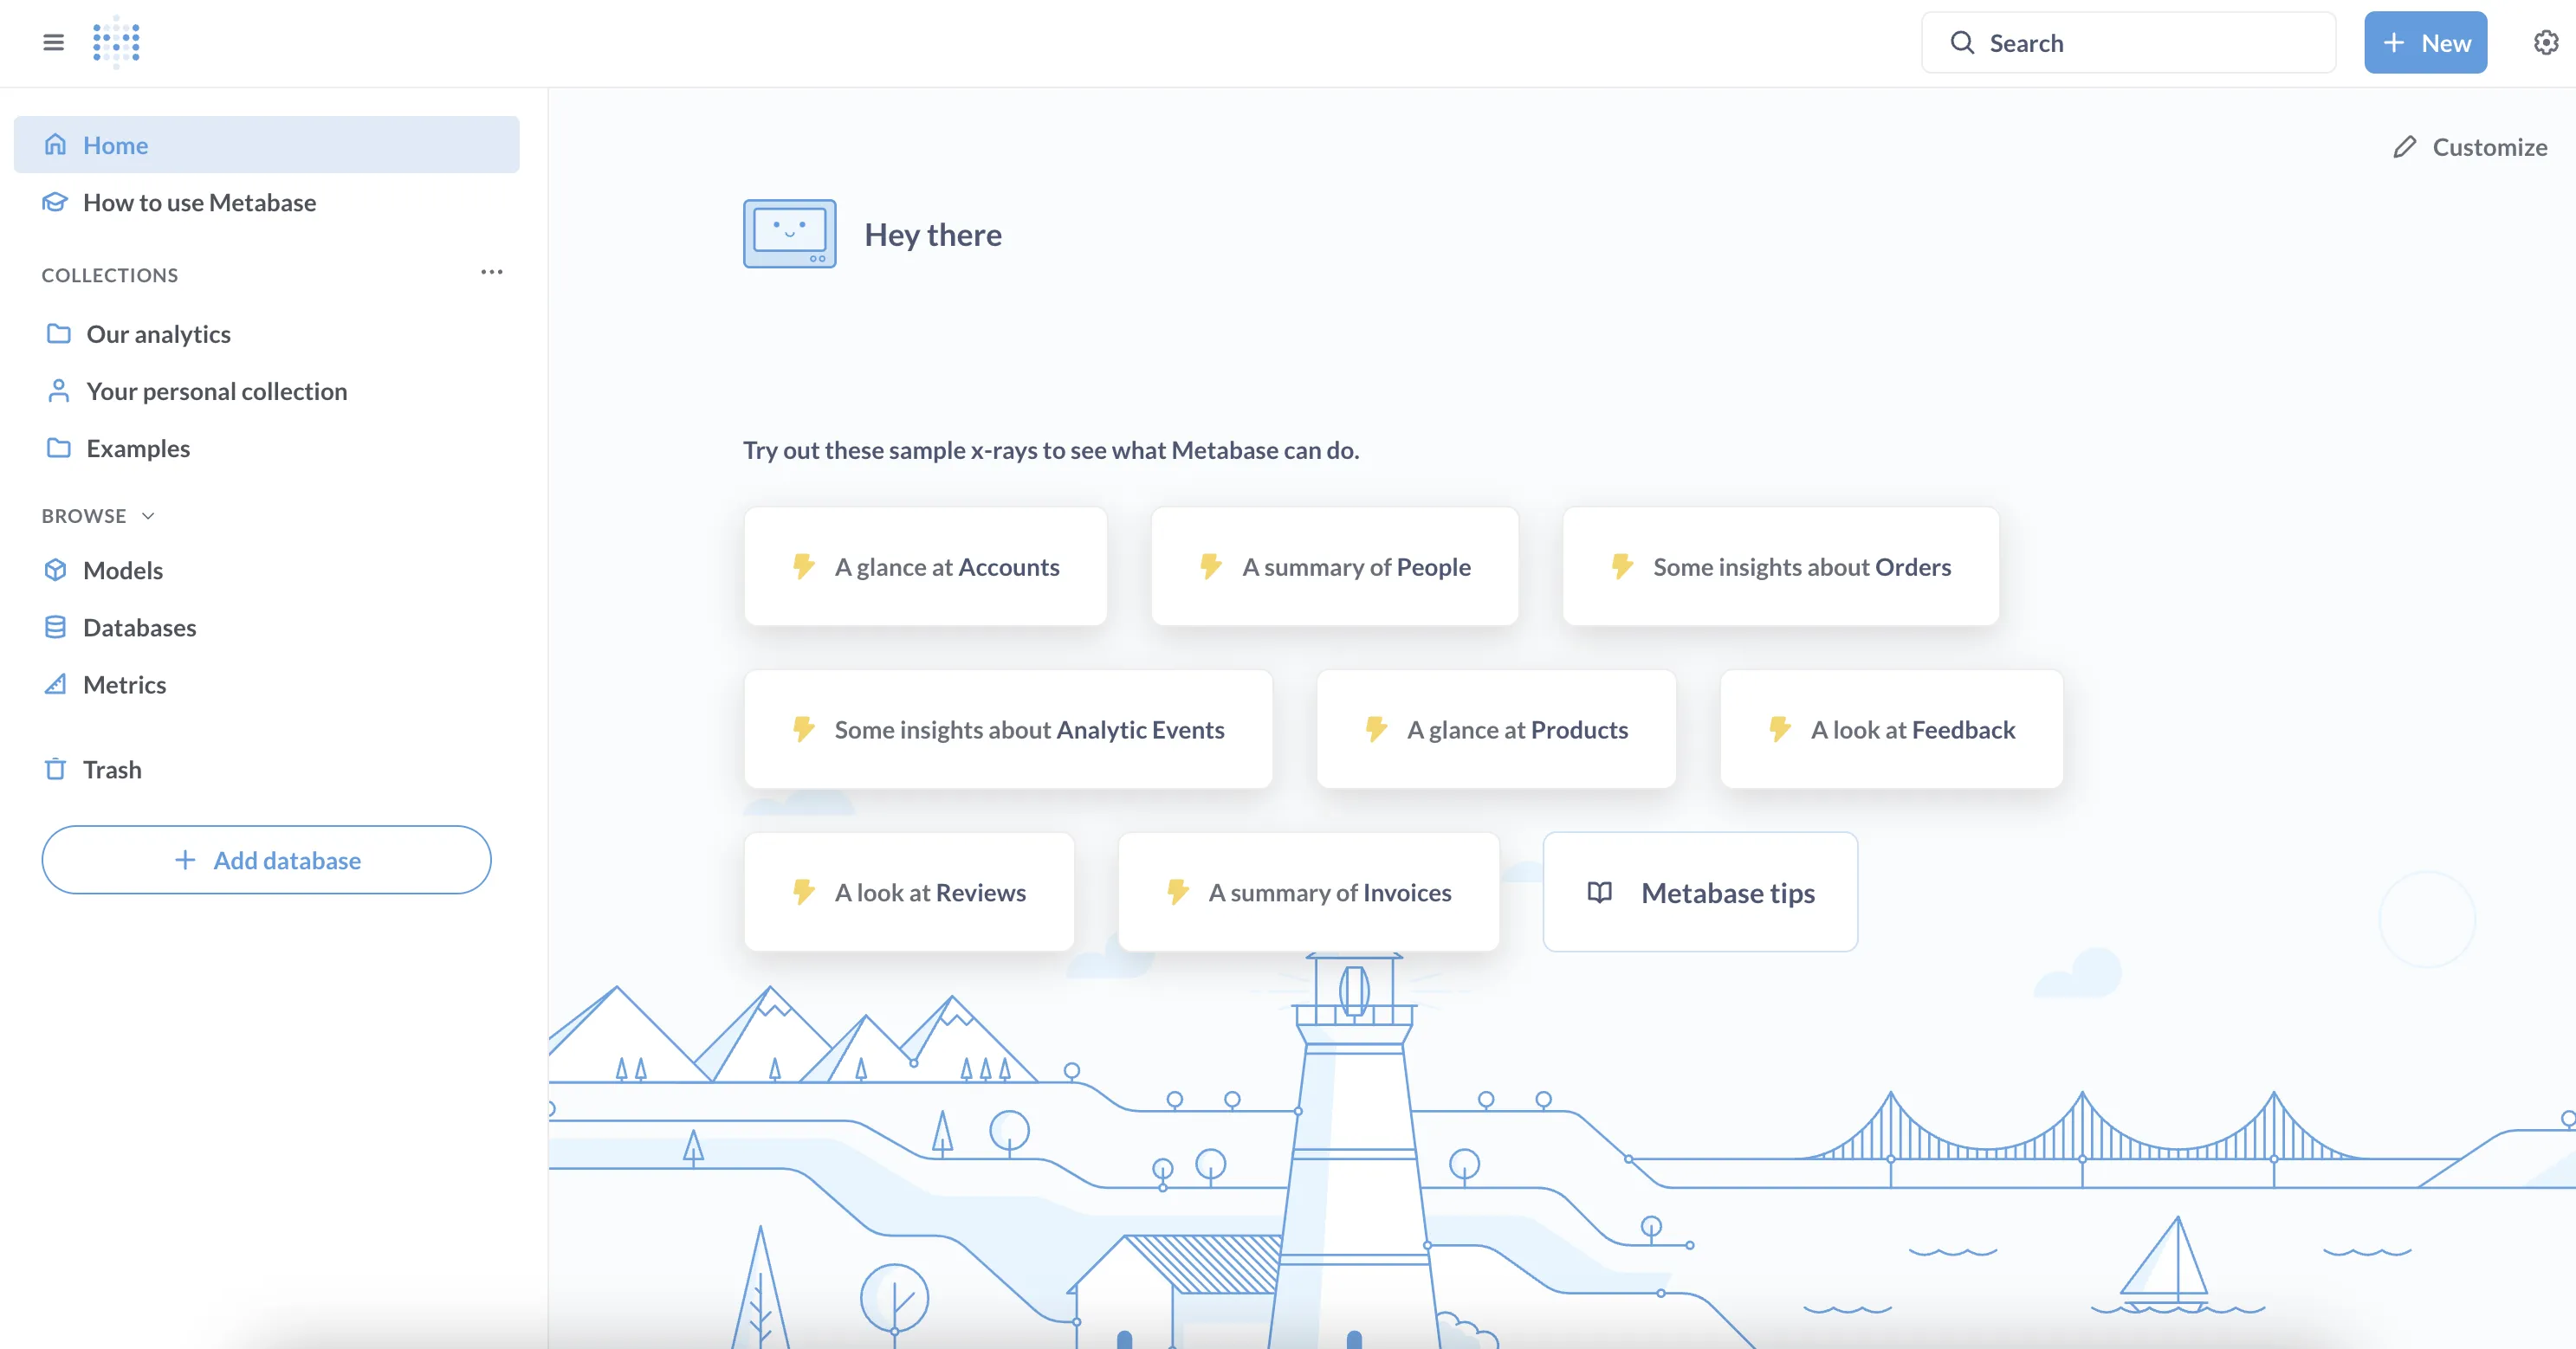
X-rays
To give you a head start on asking questions, Metabase can X-ray a table for you.
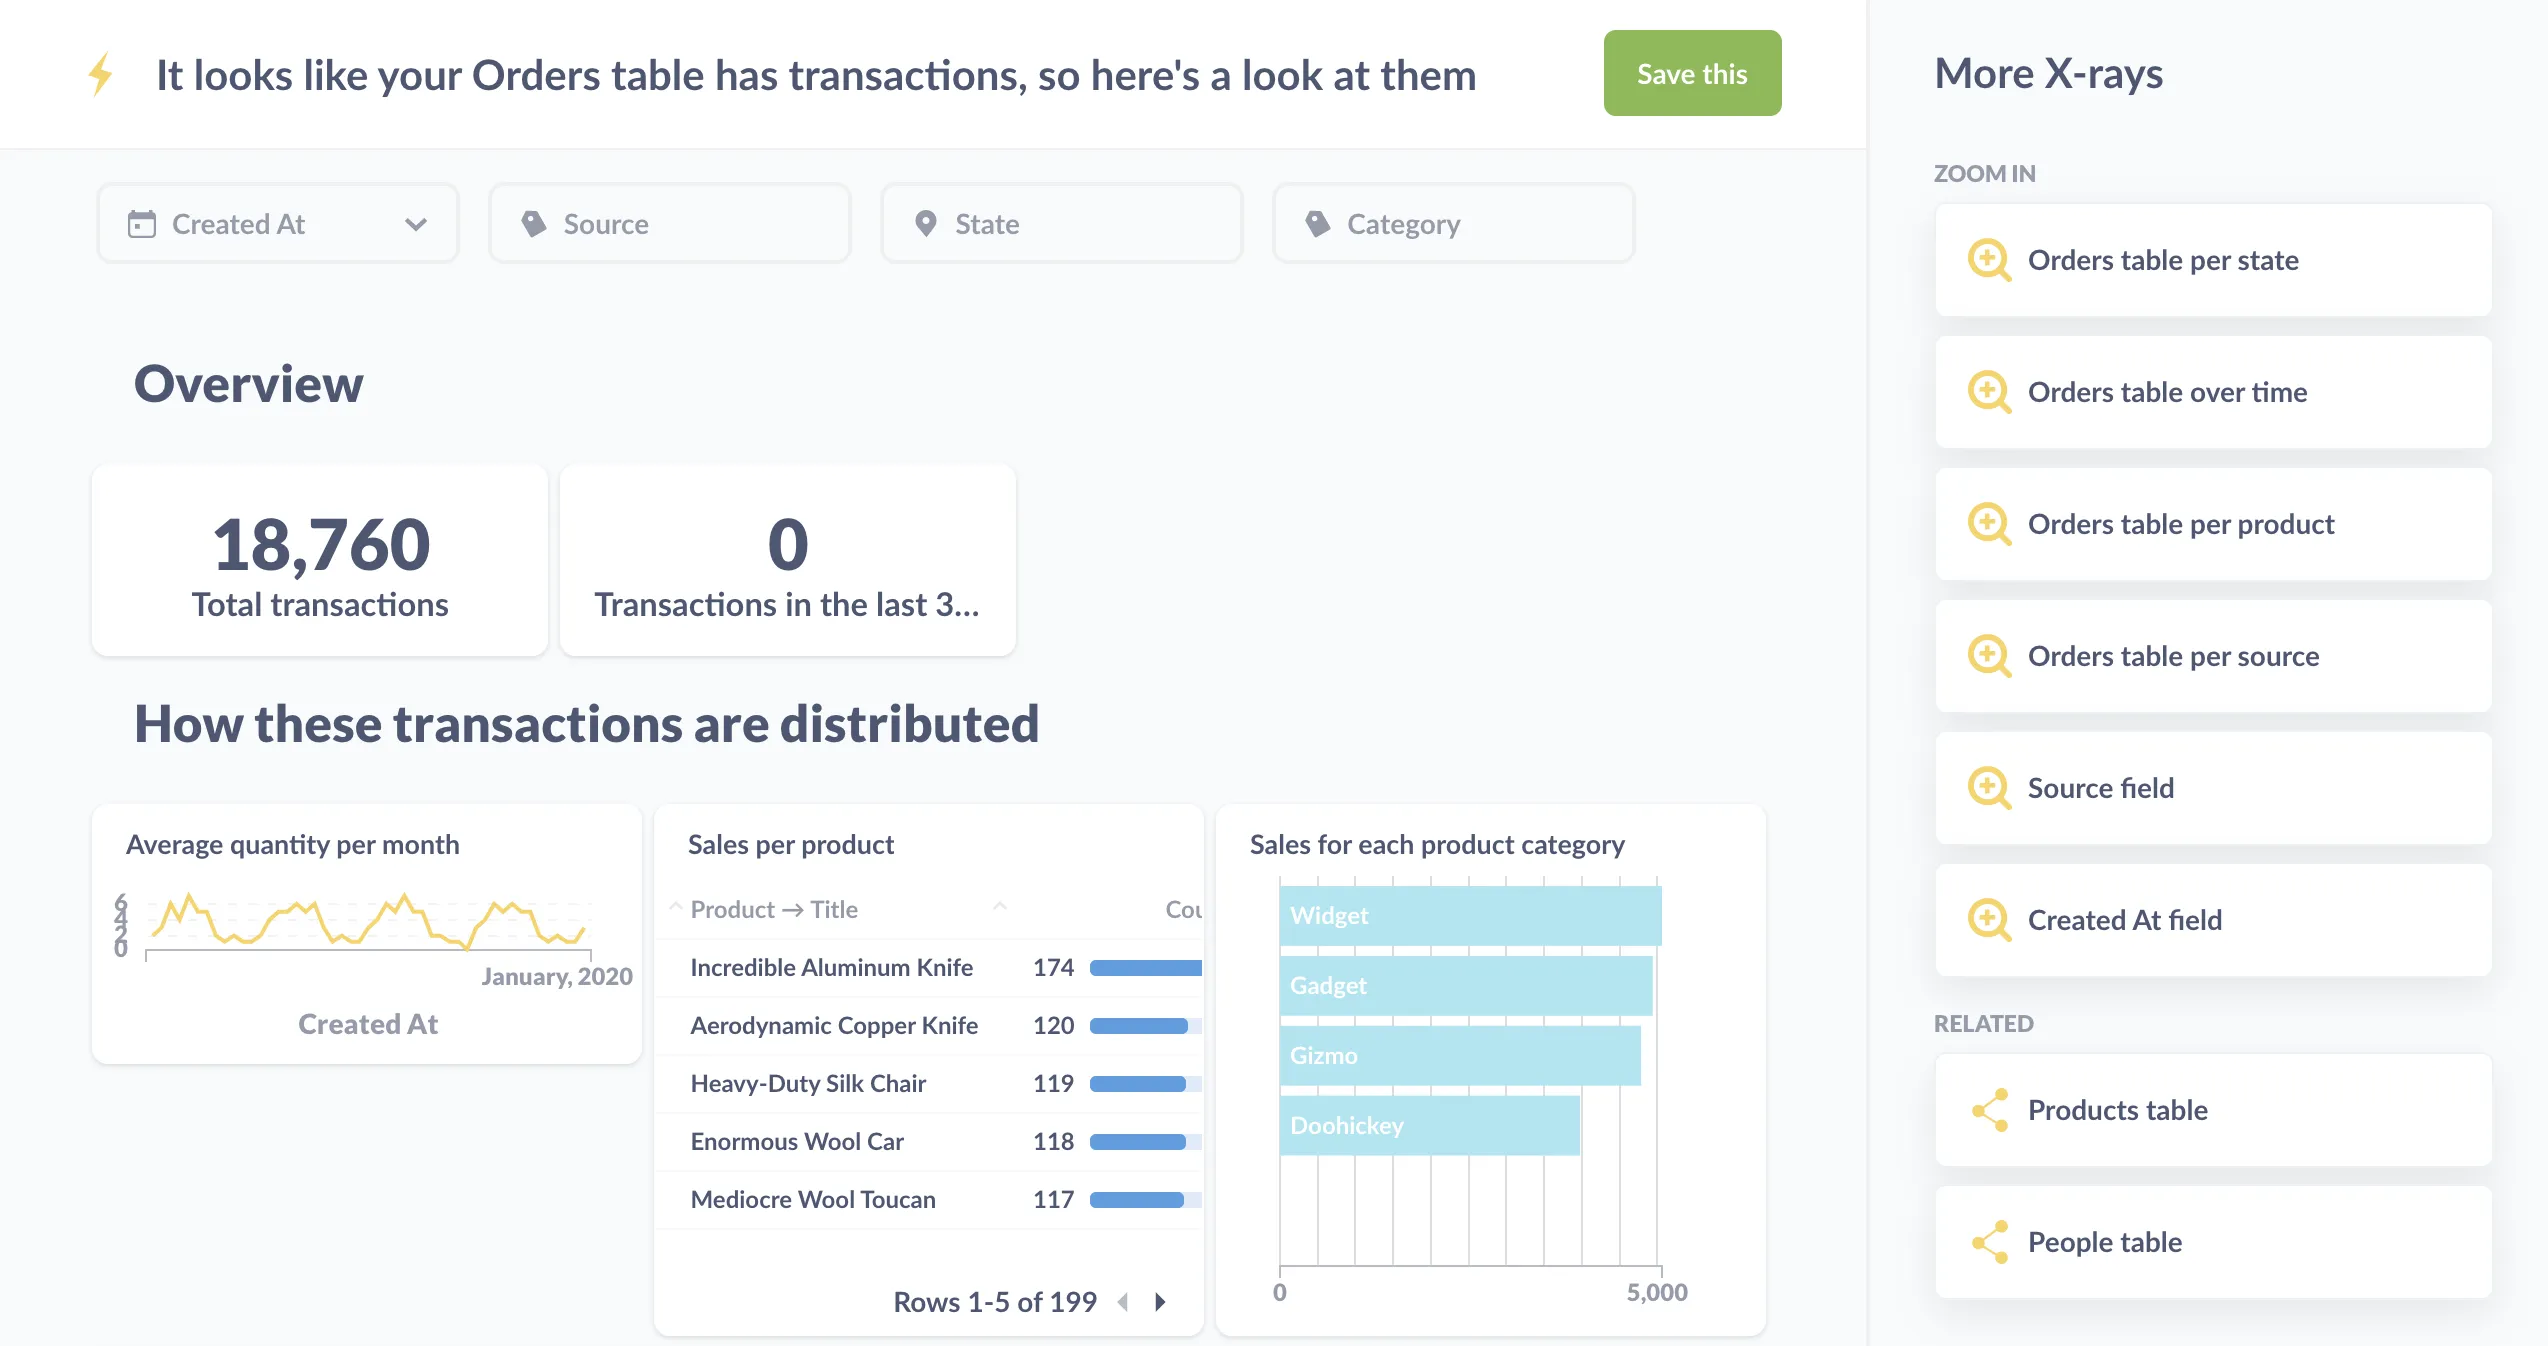
These X-rays will generate a bunch of questions that slice the table’s records in different ways. You can save the X-ray as a dashboard, take out any questions that don’t interest you, add new questions, or just use the X-ray to get a feel for the table.
Manage who can see what
Permissions, authentication, usage analytics: with great power comes great responsibility.
Sophisticated, set-and-forget permissions that work with any setup
Create groups in Metabase, add people to those groups, and give the groups different levels of access to databases and collections.
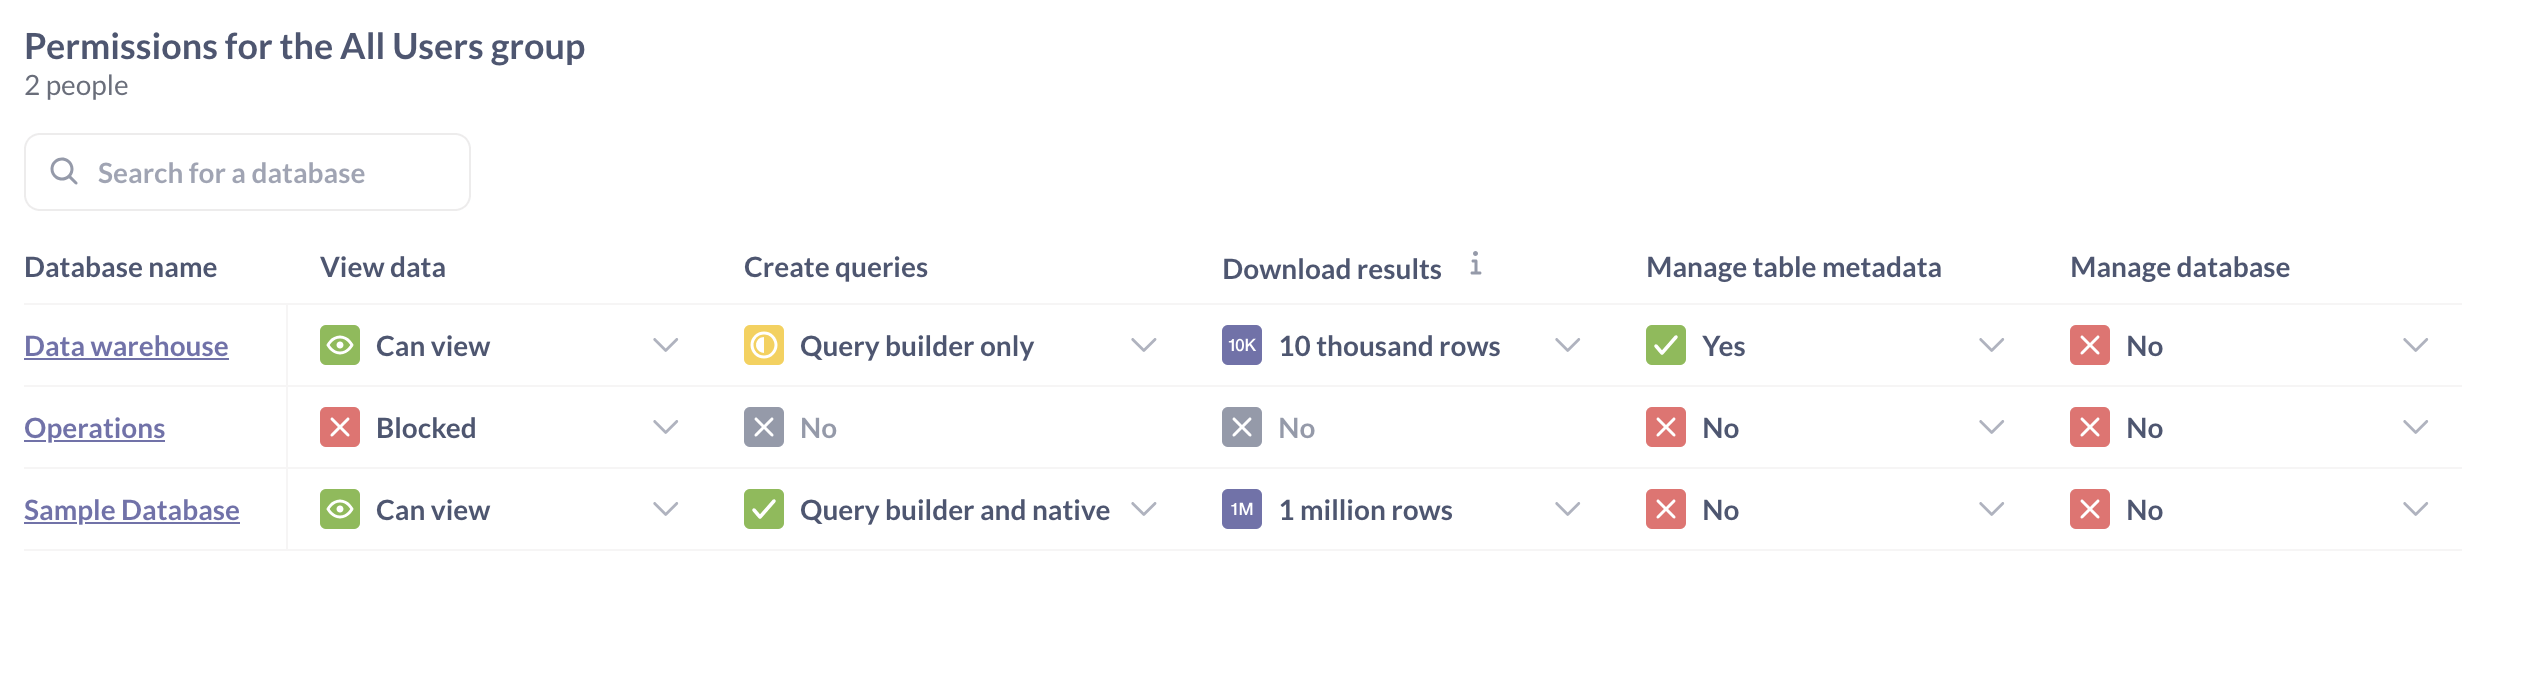
- Row and column security: restrict which rows and columns people can query.
- Connection impersonation: have Metabase use database-defined roles to manage permissions.
- Database routing: route queries to different databases based on who’s logged in.
- Application permissions: define who can manage Metabase settings, view logs and debugging tools, and more.
If you’re embedding, you can also use SSO with tenants to keep your customers completely separate.
View who’s querying which data
Usage analytics is only available on Pro and Enterprise plans (both self-hosted and on Metabase Cloud).
If you need to see what everyone’s looking at, check out How to keep tabs on your data.
Customize your Metabase
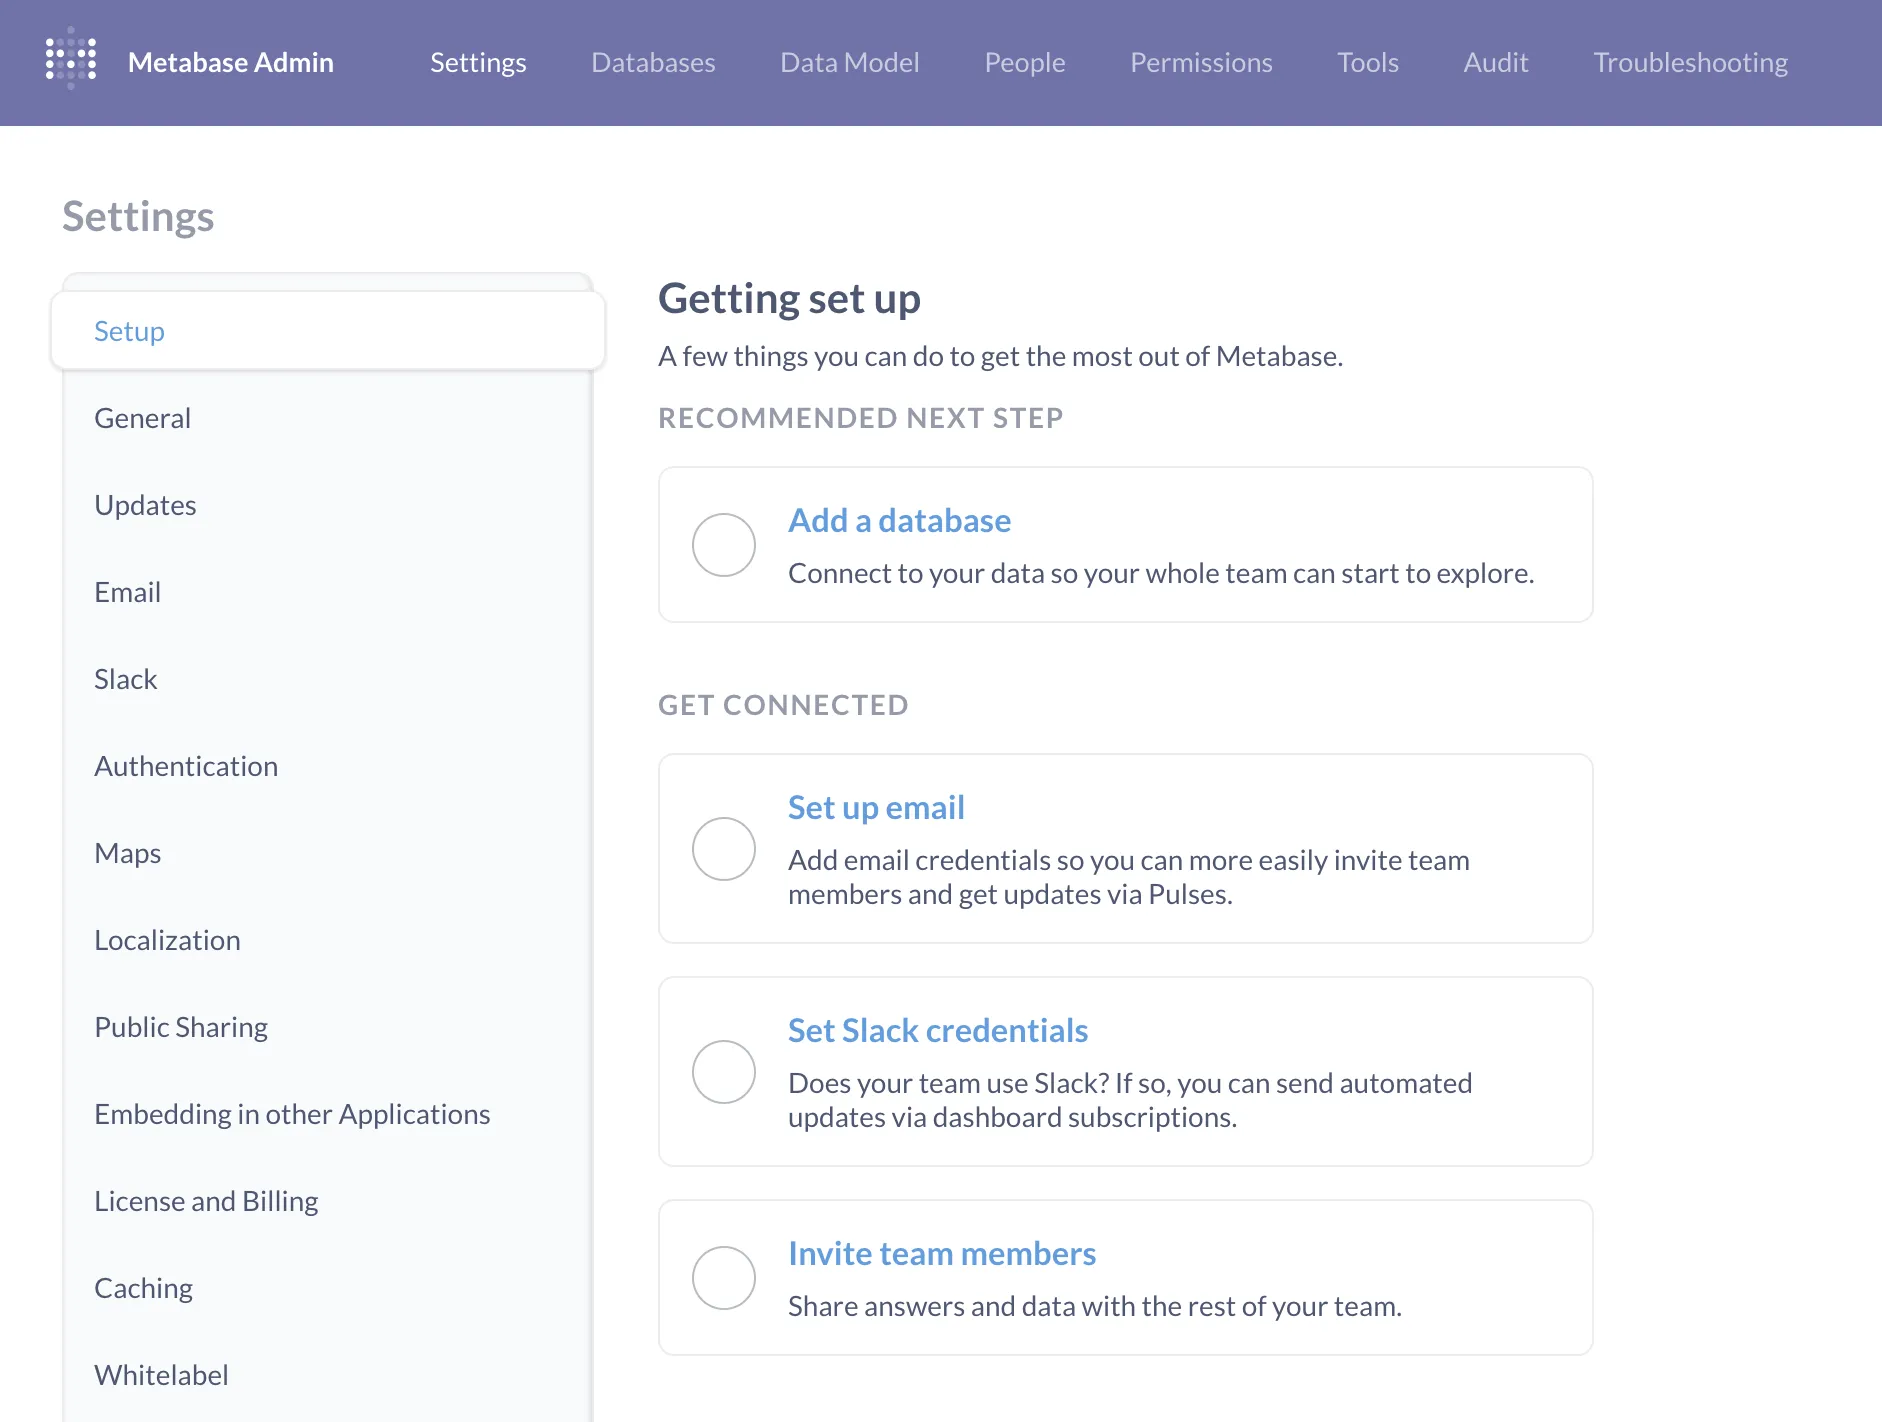
You can set up email and Slack integrations, customize locale settings like language and currencies, switch to dark mode, and configure authentication with Google Sign-In or LDAP, or on Pro and Enterprise plans: JWT or SAML.
Submit a PR, or fork the source code
Metabase is open source, so if Metabase lacks a feature you need, you can always build it yourself. Check out our releases to see the features we’ve added recently, and the roadmap for what we’re working on next.
Further reading
- Stay up to date on our blog.
- Questions? See if they’ve been answered on our forum, or post a question yourself.
- Beyond BI: other problems you can solve with Metabase.