




What goes in a MySQL monitoring dashboard in Metabase?
A MySQL monitoring dashboard tracks statement throughput and latency percentiles alongside the four things that actually take a MySQL server down: index-less queries, buffer pool misses, connection exhaustion, and replication lag. Metabase connects to MySQL natively, so every card is plain SQL over performance_schema and the sys views — no exporter or agent in between.
For: DBAs, platform engineers, and whoever is on call for the application database. Grain: one row per statement digest, plus sampled server counters.
Source:
performance_schema and sys (summaries reset on restart — snapshot on a schedule).
What does a MySQL monitoring dashboard look like?
Here’s the layout this guide builds. Server-level numbers sit at the top; the middle section is the workload — statements by type, latency percentiles, the slow-query trend, and buffer pool efficiency; the bottom section is the three resources that run out, namely connections, locks, and replication headroom.
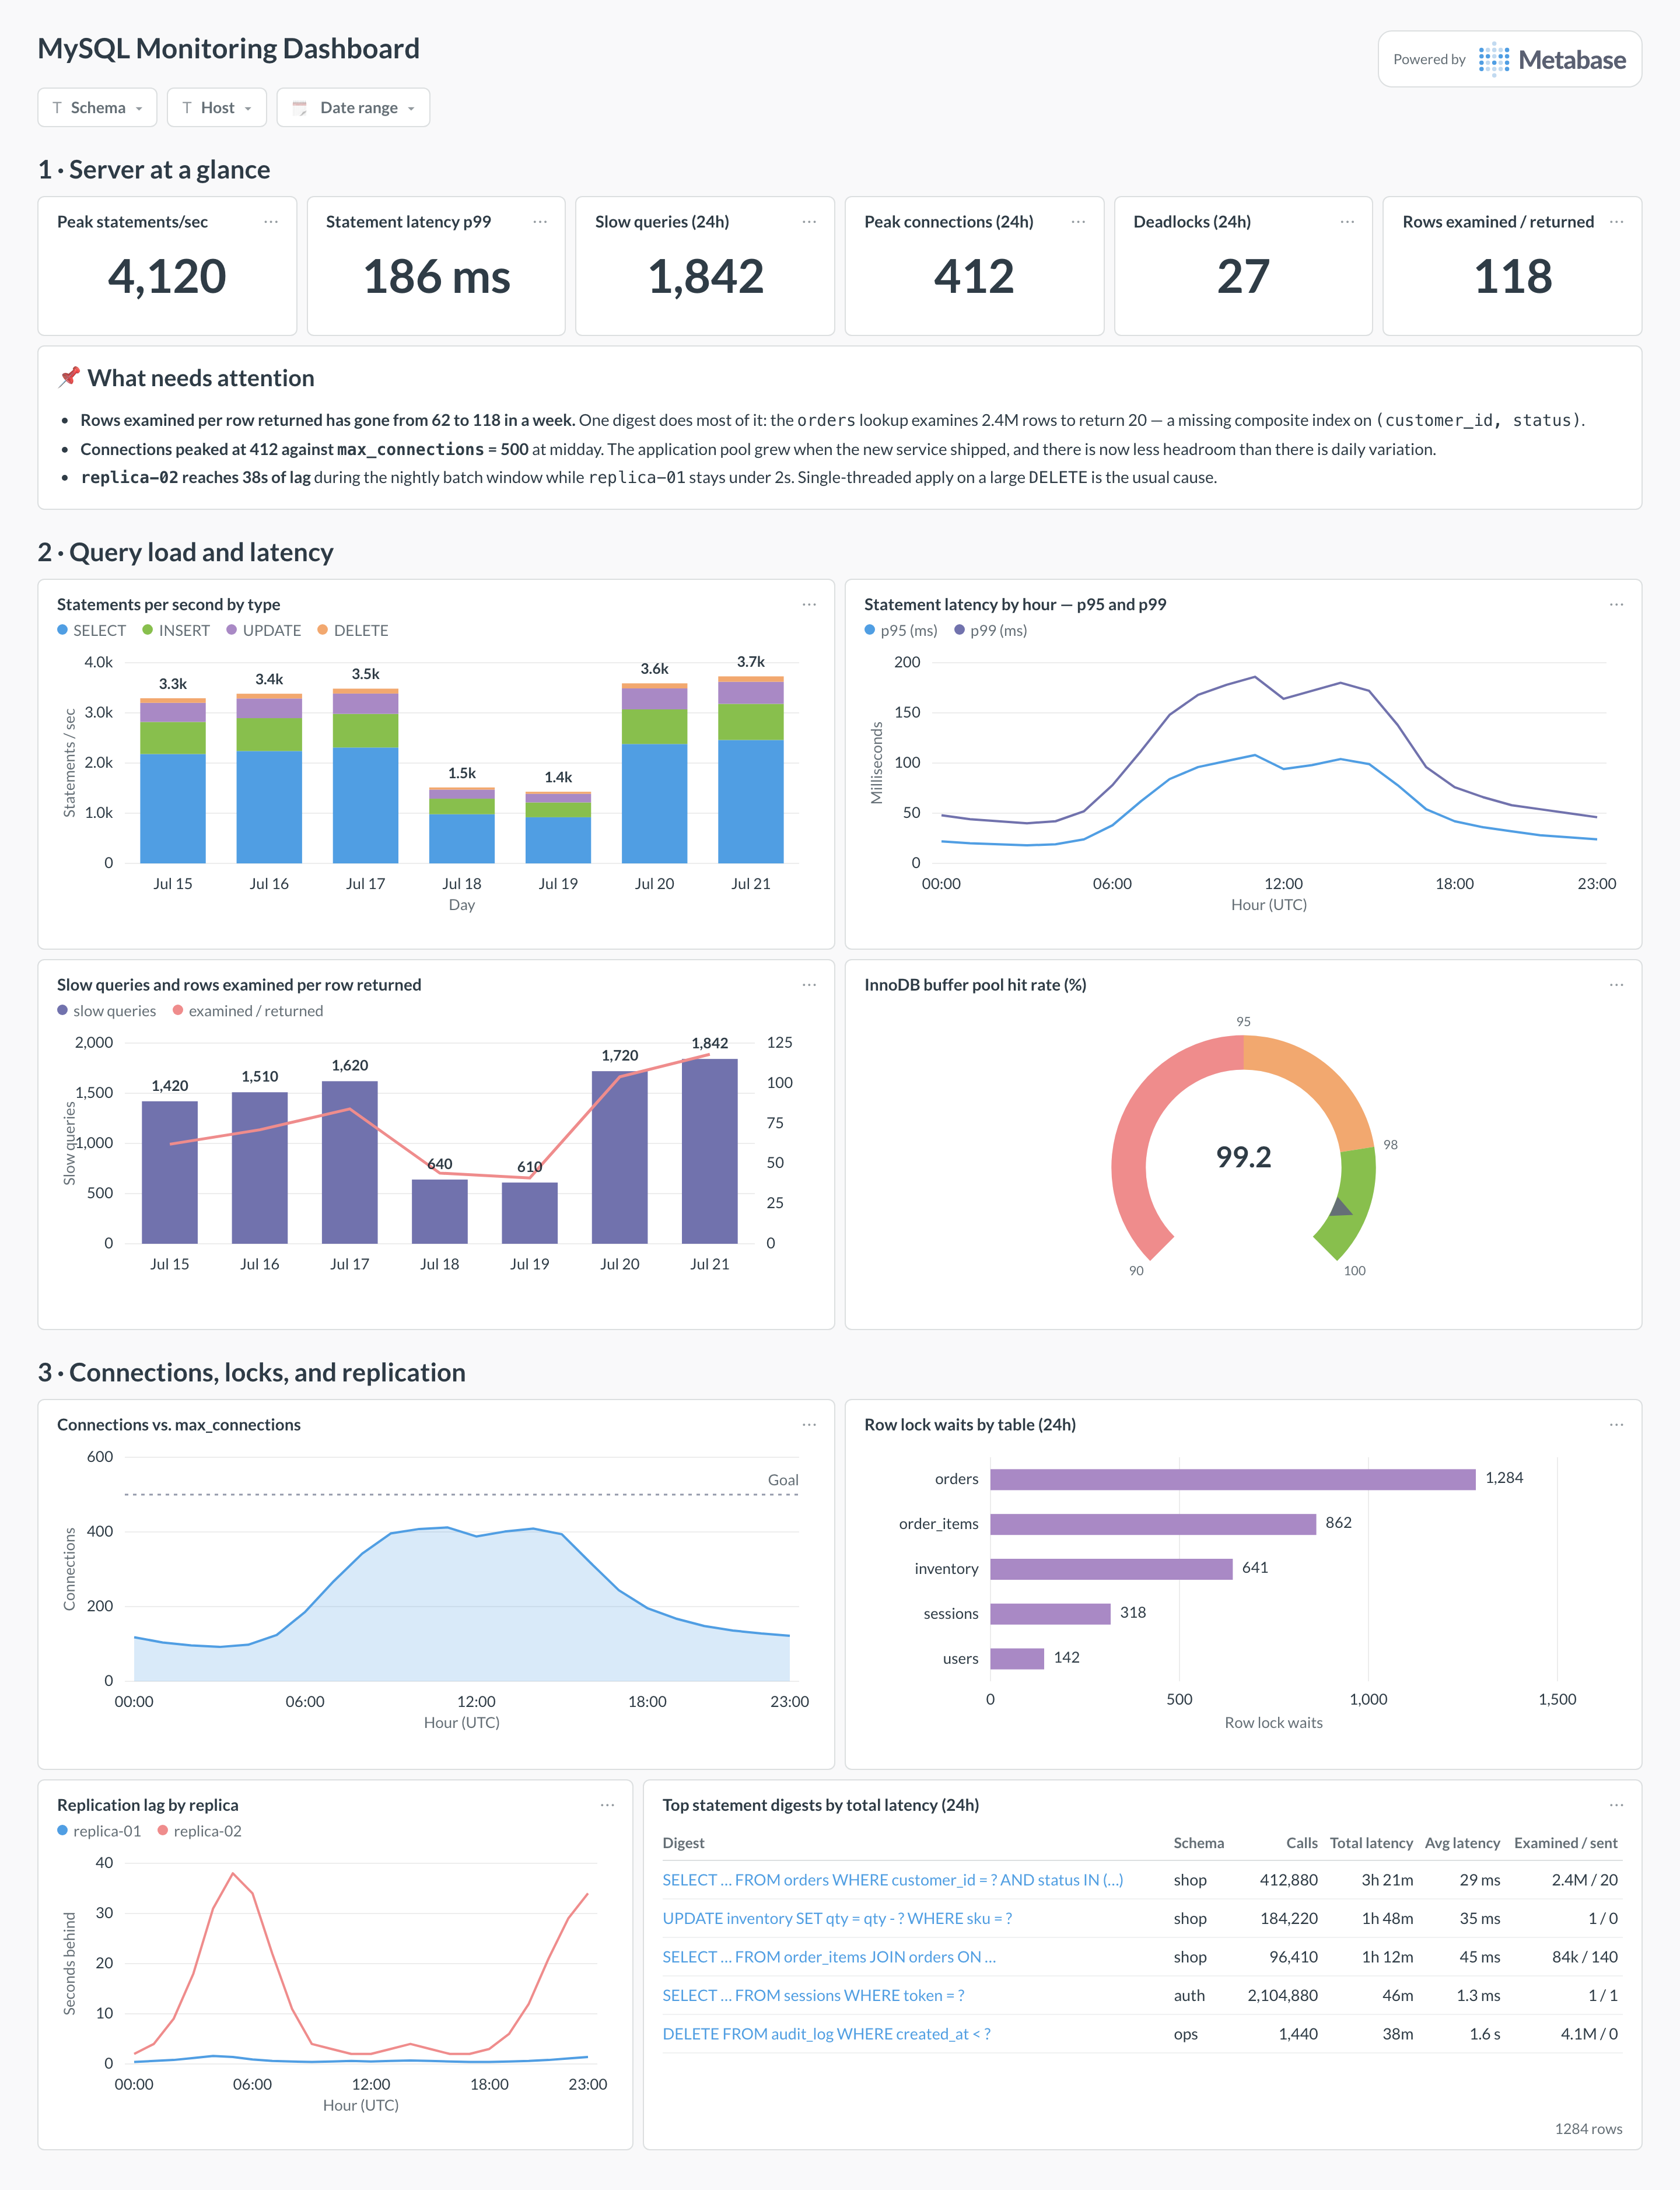
An example MySQL monitoring dashboard in Metabase, built from performance_schema and the sys views. Figures are illustrative.
Which cards belong on a MySQL monitoring dashboard?
Eight cards. Percentiles rather than averages for latency, rows examined per row returned charted as its own trend, and the three exhaustible resources — connections, locks, replica apply — each given a card instead of an alert nobody reads.
- Statements per second by type — SELECT, INSERT, UPDATE, DELETE (stacked bar)
- Statement latency by hour, p95 and p99 (line)
- Slow queries and rows examined per row returned (combo)
- InnoDB buffer pool hit rate (gauge)
- Connections against
max_connectionsby hour (area with goal) - Row lock waits by table (row)
- Replication lag by replica (line)
- Top statement digests by total latency, with calls and rows examined vs. sent (table)
What data does the dashboard need?
performance_schema.events_statements_summary_by_digest— calls,sum_timer_wait,quantile_95,sum_rows_examined,sum_rows_sent,sum_no_index_used, andsum_created_tmp_disk_tablesper normalized statement.sys.statement_analysisandsys.statements_with_full_table_scansfor the readable table cards, plussys.schema_unused_indexeswhen you want the other half of the index conversation.performance_schema.global_statussampled on a schedule —Threads_connected,Innodb_buffer_pool_read_requests,Innodb_buffer_pool_reads,Innodb_row_lock_waits,Innodb_deadlocks— andglobal_variablesformax_connectionsandinnodb_buffer_pool_size.performance_schema.data_lock_waitsandsys.innodb_lock_waitsfor contention by table, with deadlock counts rolled up fromSHOW ENGINE INNODB STATUS.performance_schema.replication_connection_statusandreplication_applier_status_by_worker, plus a heartbeat table on the primary if you want true end-to-end lag.- A snapshot table for all of the above, because the digest and status counters reset on restart and on
FLUSH STATUS.
How do you build it?
- Connect MySQL to Metabase with a dedicated user granted
SELECTonperformance_schemaandsys, plusPROCESSandREPLICATION CLIENT. Point it at a replica if the primary is tight on headroom. - Schedule a job that snapshots the digest summaries and
global_statusevery few minutes into your own table, and store the deltas — counters are cumulative, so the raw values cannot produce a trend. - Model the snapshot once: picoseconds to milliseconds, an examined-per-returned ratio, and a buffer pool hit rate computed from the delta. Every card reads the model, so no two cards disagree.
- Build the digest table and the examined-per-returned trend first — they name the query to fix — then connections, locks, and replication, which tell you how much time you have.
- Add filters for schema, host, and date range, and alert when connections pass a fraction of
max_connectionsor a replica’s lag exceeds its budget.
Example card SQL
SELECT
d.schema_name,
LEFT(d.digest_text, 80)                                    AS digest,
d.count_star                                               AS calls,
ROUND(d.sum_timer_wait / 1e12, 1)                          AS total_latency_s,
ROUND(d.avg_timer_wait / 1e9,  2)                          AS avg_latency_ms,
ROUND(d.quantile_95    / 1e9,  2)                          AS p95_latency_ms,
d.sum_rows_examined                                        AS rows_examined,
d.sum_rows_sent                                            AS rows_sent,
ROUND(d.sum_rows_examined / NULLIF(d.sum_rows_sent, 0), 1) AS examined_per_sent,
d.sum_no_index_used                                        AS no_index_used,
d.sum_created_tmp_disk_tables                              AS tmp_disk_tables
FROM performance_schema.events_statements_summary_by_digest d
WHERE d.schema_name IS NOT NULL
AND d.last_seen >= NOW() - INTERVAL 1 DAY
ORDER BY d.sum_timer_wait DESC
LIMIT 20;
Related
Metrics
Integrations
Dashboards
FAQ
What is a MySQL monitoring dashboard?
performance_schema, and Metabase connects to MySQL natively, so every card is ordinary SQL against the server you are monitoring. No exporter, no agent, no second system to keep running.performance_schema or sys — which should the cards read?
performance_schema holds the raw instrumentation: events_statements_summary_by_digest (one row per normalized statement, with call counts, timer totals, quantile_95, rows examined and sent, temp tables, index usage), global_status and global_variables for server counters and settings, data_lock_waits for contention, and the replication_*_status tables. The sys schema is a set of readable views over the same data — sys.statement_analysis, sys.statements_with_full_table_scans, sys.schema_unused_indexes, sys.innodb_lock_waits — which are perfect for the table cards and awkward for time series. Build trend cards on performance_schema, detail cards on sys.Why is rows examined per row returned the most useful single number?
sum_rows_examined / sum_rows_sent puts index gaps at the top of the list far more reliably than sorting by duration, which is dominated by whichever query simply runs most often. Watch it as a server-wide ratio too: in the example it climbs from 62 to 118 in a week, which is what a schema change or a new code path looks like from the database's side.How do I compute InnoDB buffer pool hit rate correctly?
Innodb_buffer_pool_read_requests and Innodb_buffer_pool_reads in performance_schema.global_status are cumulative since server start, so the naive ratio is an average over months and will look reassuring long after the working set stopped fitting in memory. Sample both counters on a schedule, store the deltas, and compute 1 − (reads / read_requests) per interval. Healthy OLTP servers sit above 99%; a sustained drop usually means the working set outgrew innodb_buffer_pool_size, or one large scan is evicting the hot pages.What's the right way to track replication lag?
Seconds_Behind_Source alone. That value is derived from the timestamp of the event the applier is currently processing, so it reads 0 whenever the applier has nothing queued — including when the replica has lost the connection — and it is measured against the immediate source, which understates lag in a chained topology. Read performance_schema.replication_connection_status and replication_applier_status_by_worker instead, which separate “not receiving” from “receiving but behind”, and add a heartbeat table written on the primary every second so the dashboard can measure end-to-end delay directly. A single-threaded apply of one large DELETE is the classic cause of a lag spike that shows up on one replica only.Does turning on performance_schema slow the server down?
events_waits_current, events_stages_* — which you do not need here. Keep statements_digest and the statement summary consumers enabled, leave the wait and stage consumers off, and remember the digest table is capped by performance_schema_digests_size: overflow lands in a single NULL-digest row, which is your signal to raise the limit. Also snapshot the summaries nightly, because FLUSH STATUS and a restart both reset them.How is this different from a PostgreSQL monitoring dashboard?
pg_stat_statements and pg_stat_user_tables, and it worries about vacuum, bloat, and transaction ID wraparound. This one is built on performance_schema and worries about buffer pool hit rate, max_connections, row lock waits, and single-threaded replication apply. Teams running both keep both pages. If MySQL is also the source your analytics replicate from, pair it with an ETL monitoring dashboard for the pipeline side.