What goes in a cybersecurity executive dashboard in Metabase?
A cybersecurity executive dashboard is the translation layer between security operations and the board: a posture-score trend, incidents and near-misses, patch and vulnerability SLA attainment, program milestones, and spend against budget. It rolls up what the SOC and vulnerability management dashboards track operationally into the handful of numbers leadership actually governs with. Metabase builds it from monthly rollups of those same sources.
For: CISOs, CIOs, and boards. Grain: monthly rollups per security domain. Refresh: daily sync, monthly review, quarterly board read.
What does a cybersecurity executive dashboard look like?
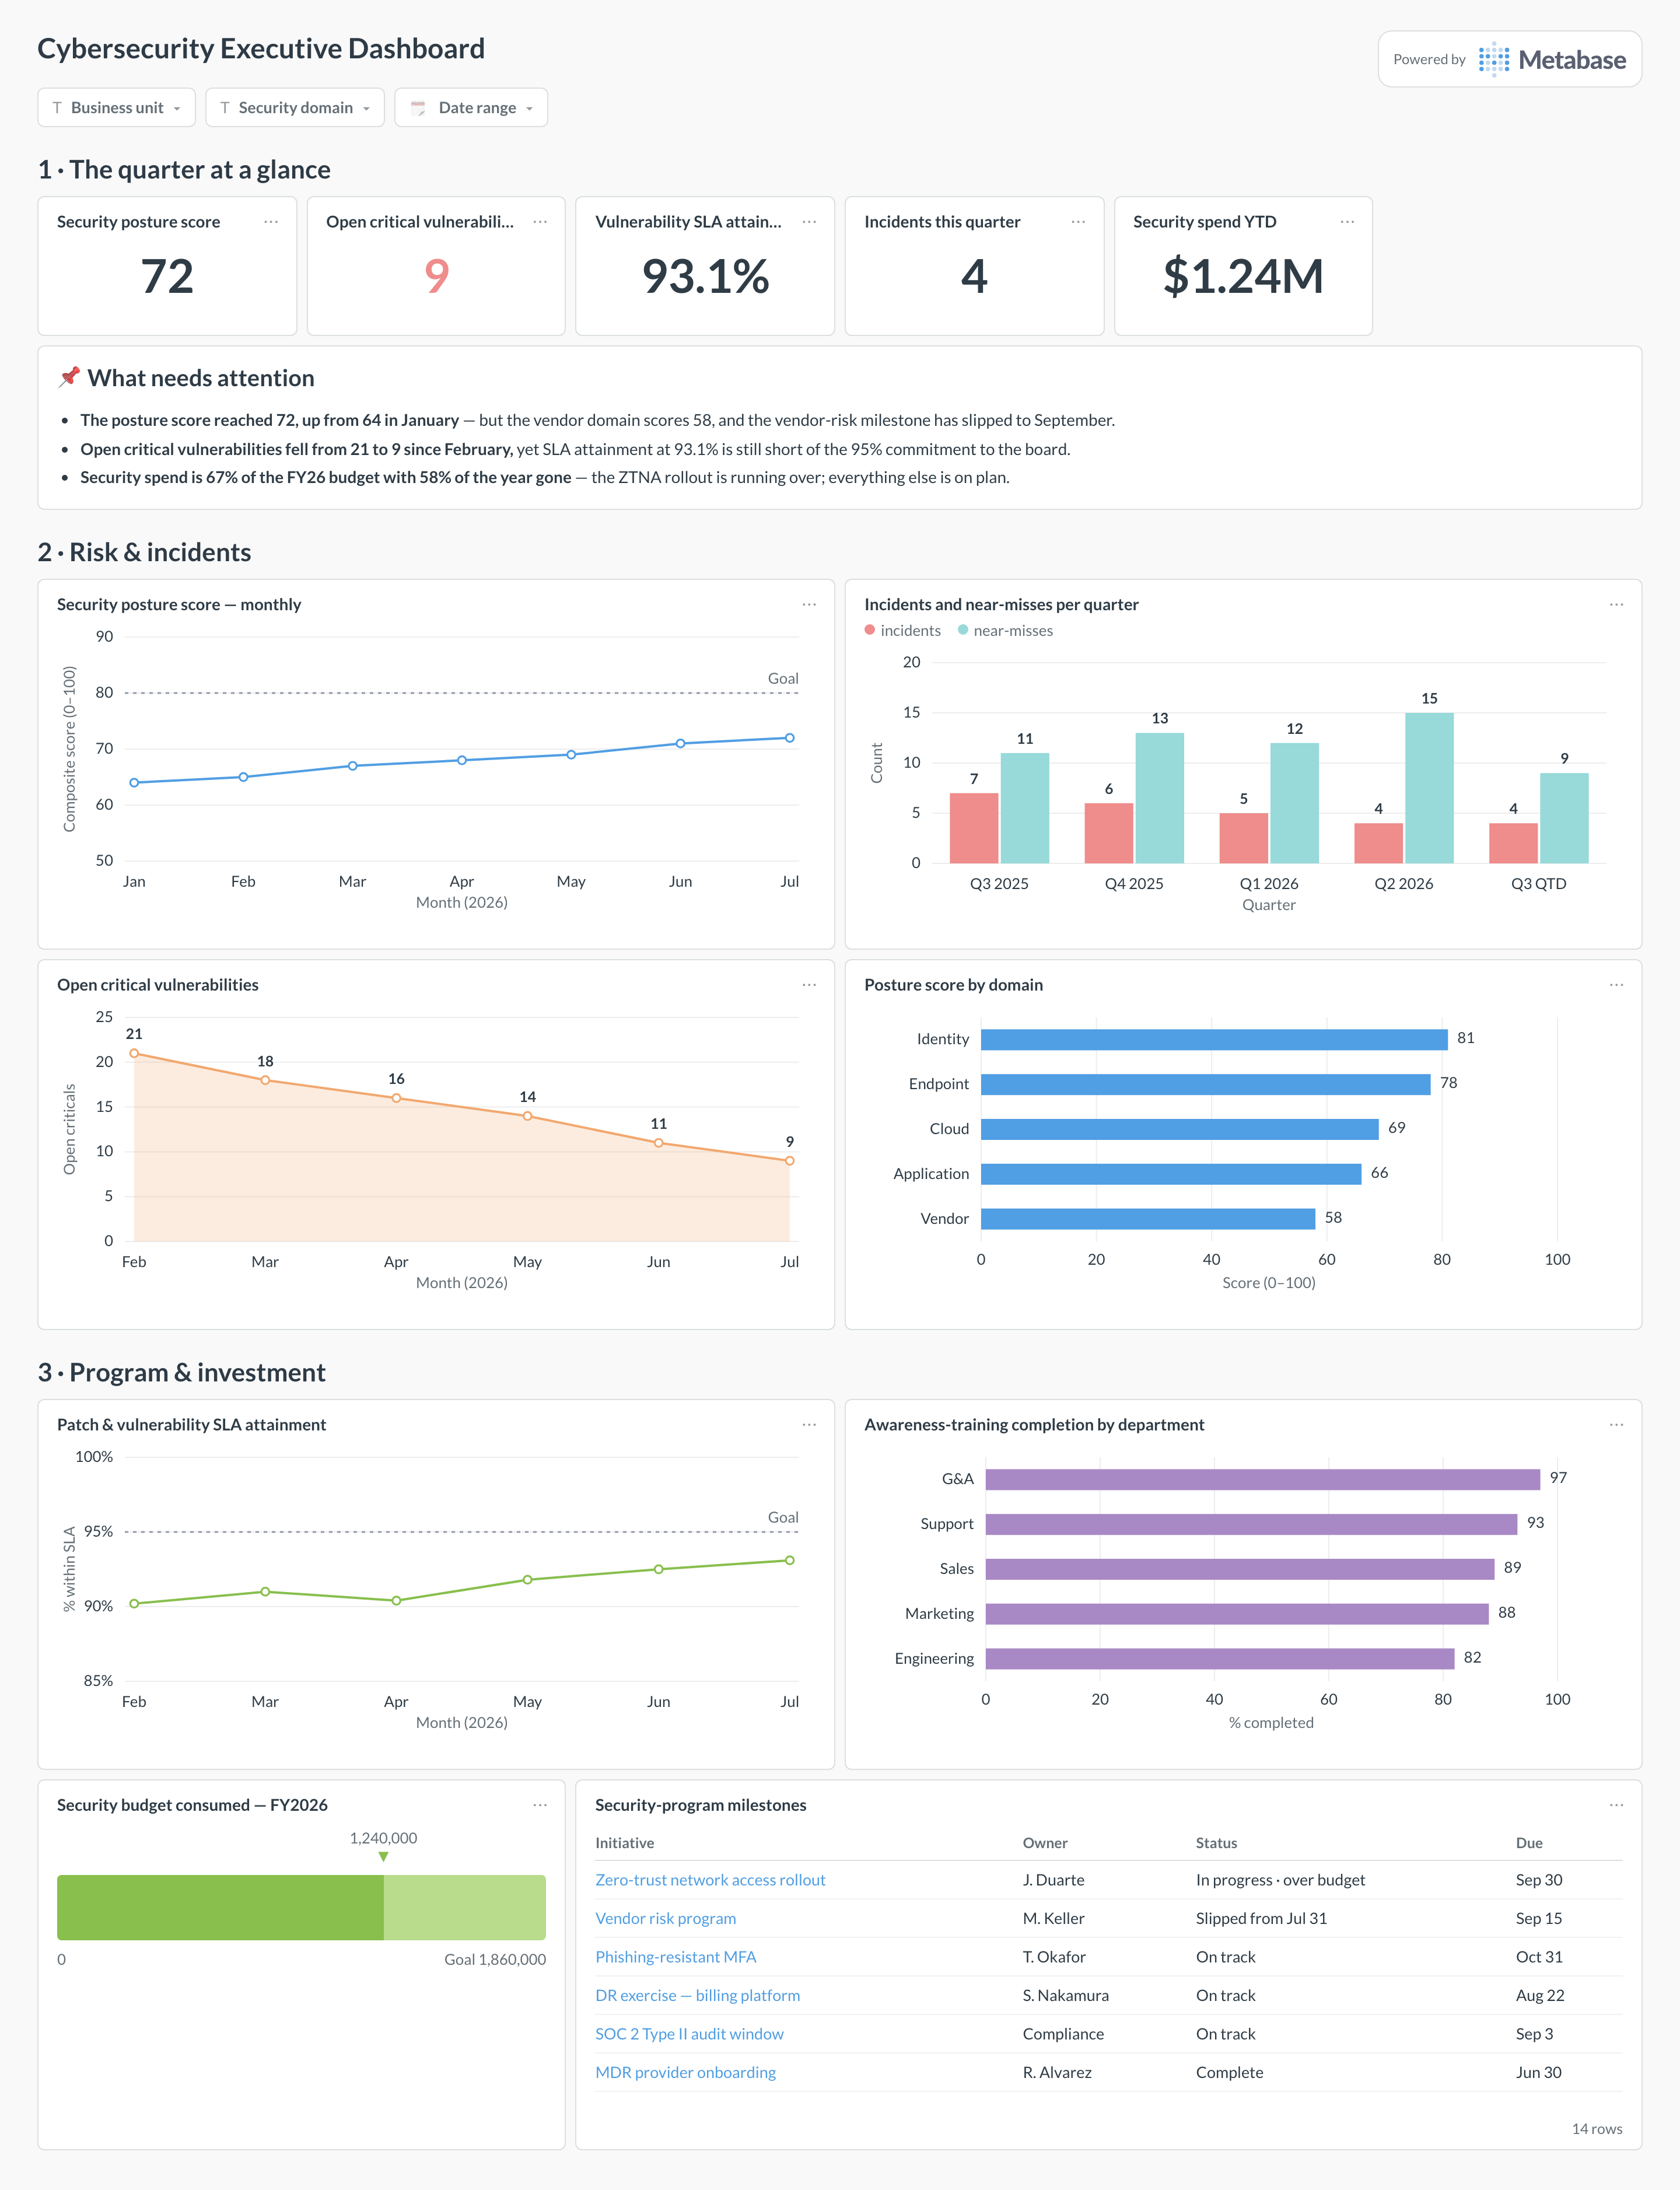
Here’s the layout this guide builds. The quarter’s headline numbers open the page — posture score, open criticals, SLA attainment, incidents, spend — so a two-minute read exists; risk and incidents follow, pairing the score trend with its domain breakdown so the composite can’t hide a weak spot; program and investment close the page, because milestones and budget are where the executive conversation actually lands.
An example cybersecurity executive dashboard in Metabase, built from monthly rollups of security operations data. Figures are illustrative.
Which cards belong on a cybersecurity executive dashboard?
The eight below answer the four questions boards ask: are we getting safer, what happened, are we keeping our commitments, and what is the program delivering for the money?
Security posture score — the composite, monthly, against the target (line)
Incidents and near-misses per quarter — side by side, on purpose (bar)
Open critical vulnerabilities — the monthly trend, not today’s count alone (area)
Patch & vulnerability SLA attainment — against the commitment made to the board (line)
Awareness-training completion by department — worst last, named (row)
Security budget consumed — spend against the fiscal-year plan (progress)
Security-program milestones — initiative, owner, status, due date (table)
What data does the dashboard need?
A security_domain_scores table — month, domain, score — plus a posture_weights table holding the published formula.
A monthly incident rollup with incidents and near_misses columns, classified by an explicit boundary rule.
Monthly vulnerability rollups — open_criticals and sla_attainment_pct — from the scanner’s data, not hand-entered.
A program_milestones table with initiative, owner, status, and due date; and training-completion records joined to HR headcount.
Security cost-center actuals from the finance system, monthly, against the FY budget figure.
How do you build it?
Build one small monthly rollup model per domain — vulnerabilities, incidents, identity, training, spend — on top of the operational tables the SOC and vuln dashboards already use.
Define the posture score in data: domain metrics → domain score → weighted composite, with weights in a table so the formula is inspectable and versioned.
Record commitments as goal lines — the 95% SLA target, the posture target — so every trend chart carries the number leadership signed up to.
Keep the milestone table in the warehouse (or synced from the project tracker) with owner and status values from a closed list; it’s the card executives read first.
Add business-unit, security-domain, and date filters, then send a monthly subscription to the executive team and bring the live dashboard — not slides — to the quarterly review.
Example card SQL
Monthly posture score with incident and vulnerability rollupsPostgreSQL
WITH domain_scores AS (
SELECT
  s.month,
  s.domain,                        -- identity, endpoint, cloud, …
  s.score,                         -- 0–100, from that domain's metrics
  w.weight
FROM security_domain_scores s
JOIN posture_weights w USING (domain)
)
SELECT
d.month,
ROUND(SUM(d.score * d.weight) / SUM(d.weight), 0)  AS posture_score,
i.incidents,
i.near_misses,
v.open_criticals,
ROUND(v.sla_attainment_pct, 1)                     AS sla_attainment_pct
FROM domain_scores d
LEFT JOIN monthly_incident_rollup i USING (month)
LEFT JOIN monthly_vuln_rollup v USING (month)
WHERE d.month >= date_trunc('month', now()) - interval '12 months'
GROUP BY d.month, i.incidents, i.near_misses,
       v.open_criticals, v.sla_attainment_pct
ORDER BY d.month;
How does an executive dashboard differ from the SOC and vulnerability dashboards?
It's the translation layer. The SOC dashboard counts alerts and triage minutes; the vulnerability management dashboard tracks findings against SLAs. Executives don't act on either — they allocate budget, accept risk, and hold owners to milestones. So this page rolls those operational feeds up into a posture trend, SLA attainment against a stated commitment, incidents per quarter, and program status. The test for every card: could a board member ask a useful question about it? An alert-volume chart fails that test; a slipped milestone passes.
How do we build a posture score that isn't hand-waving?
Compose it from measurable domain scores and publish the formula. Score each domain — identity, endpoint, cloud, application, vendor — from two or three real metrics (MFA coverage, patch SLA, scan coverage, vendor reviews complete), weight the domains, and keep both the metric definitions and the weights in a table the dashboard reads. Two rules preserve credibility: never change the formula mid-year without an annotation, and always show the domain breakdown next to the composite so a rising score can't hide a sinking domain. A score no one can decompose is a vibe, and boards eventually notice.
What belongs in front of the board — and what should stay out?
Trends against commitments, not operational counts. A board can act on "SLA attainment is 93.1% against the 95% we committed to" or "the vendor-risk milestone slipped six weeks"; it can't act on 1,284 weekly alerts. Keep the page to five or six headline numbers, three or four trends, the milestone table, and spend — and resist adding a card every time something feels important. The other discipline is consistency: boards compare this quarter to last, so changing the metrics between meetings costs more trust than a bad number ever will.
Why chart near-misses next to incidents?
Because incidents alone reward silence. A quarter with four incidents and fifteen reported near-misses is usually a healthier program than one with four incidents and two near-misses — the difference is whether people report the close calls that didn't become breaches. Rising near-miss counts alongside flat-or-falling incidents is the pattern you want, and it's worth saying so in the attention notes the first time an executive reads the chart the wrong way. Define the boundary clearly (contained before impact vs. impact occurred) so the split can't be gamed by reclassification.
How should we present spend versus budget?
Anchor it to the milestone table, not just a progress bar. "67% of budget consumed at 58% of the year" invites a cut conversation on its own; next to a milestone list showing the ZTNA rollout running over while everything else tracks, it becomes a scoped, explainable variance. Where possible, pair spend with the risk it retired — criticals down from 21 to 9, posture up eight points — because the board question behind every security budget line is "what did we get for it?", and this dashboard exists to answer that with data instead of adjectives.
What cadence should this dashboard run on?
Refresh the data daily; read it monthly; present it quarterly. Daily syncs keep the page trustworthy whenever an executive opens it — nothing erodes confidence like a dashboard whose numbers are older than the last email about them. The monthly read is the CISO's own review, catching drift before it becomes a board surprise. For the quarterly meeting, share the live dashboard (or a subscription snapshot) rather than screenshots pasted into slides: the first time a board member filters to their business unit and gets an answer, the dashboard stops being reporting and starts being infrastructure.
Where does the underlying data come from?
From the operational systems you already run, rolled up monthly: vulnerability counts and SLA attainment from scanners like Wiz or Tenable, incident and near-miss records from your case tracker, control and training state from Drata or Vanta, detections context from CrowdStrike, and spend from the finance system. The pattern that keeps it maintainable is one small rollup table per domain, refreshed on schedule — the executive page then reads rollups, and a change in any source tool touches one model instead of every card.