





What is incident count, and how do you measure it in Metabase?
Incident count is the number of qualifying incidents in a period, segmented by severity and service. It's the volume half of incident health — pair it with MTTA and MTTR to see whether load and response are moving together. Measure it in Metabase from incident records synced from PagerDuty, Datadog, or Kibana cases.
incidents per period, split
by severity and service. The hard part isn't the
SQL — it's agreeing once on what qualifies as an incident.
What does an incident count chart look like in Metabase?
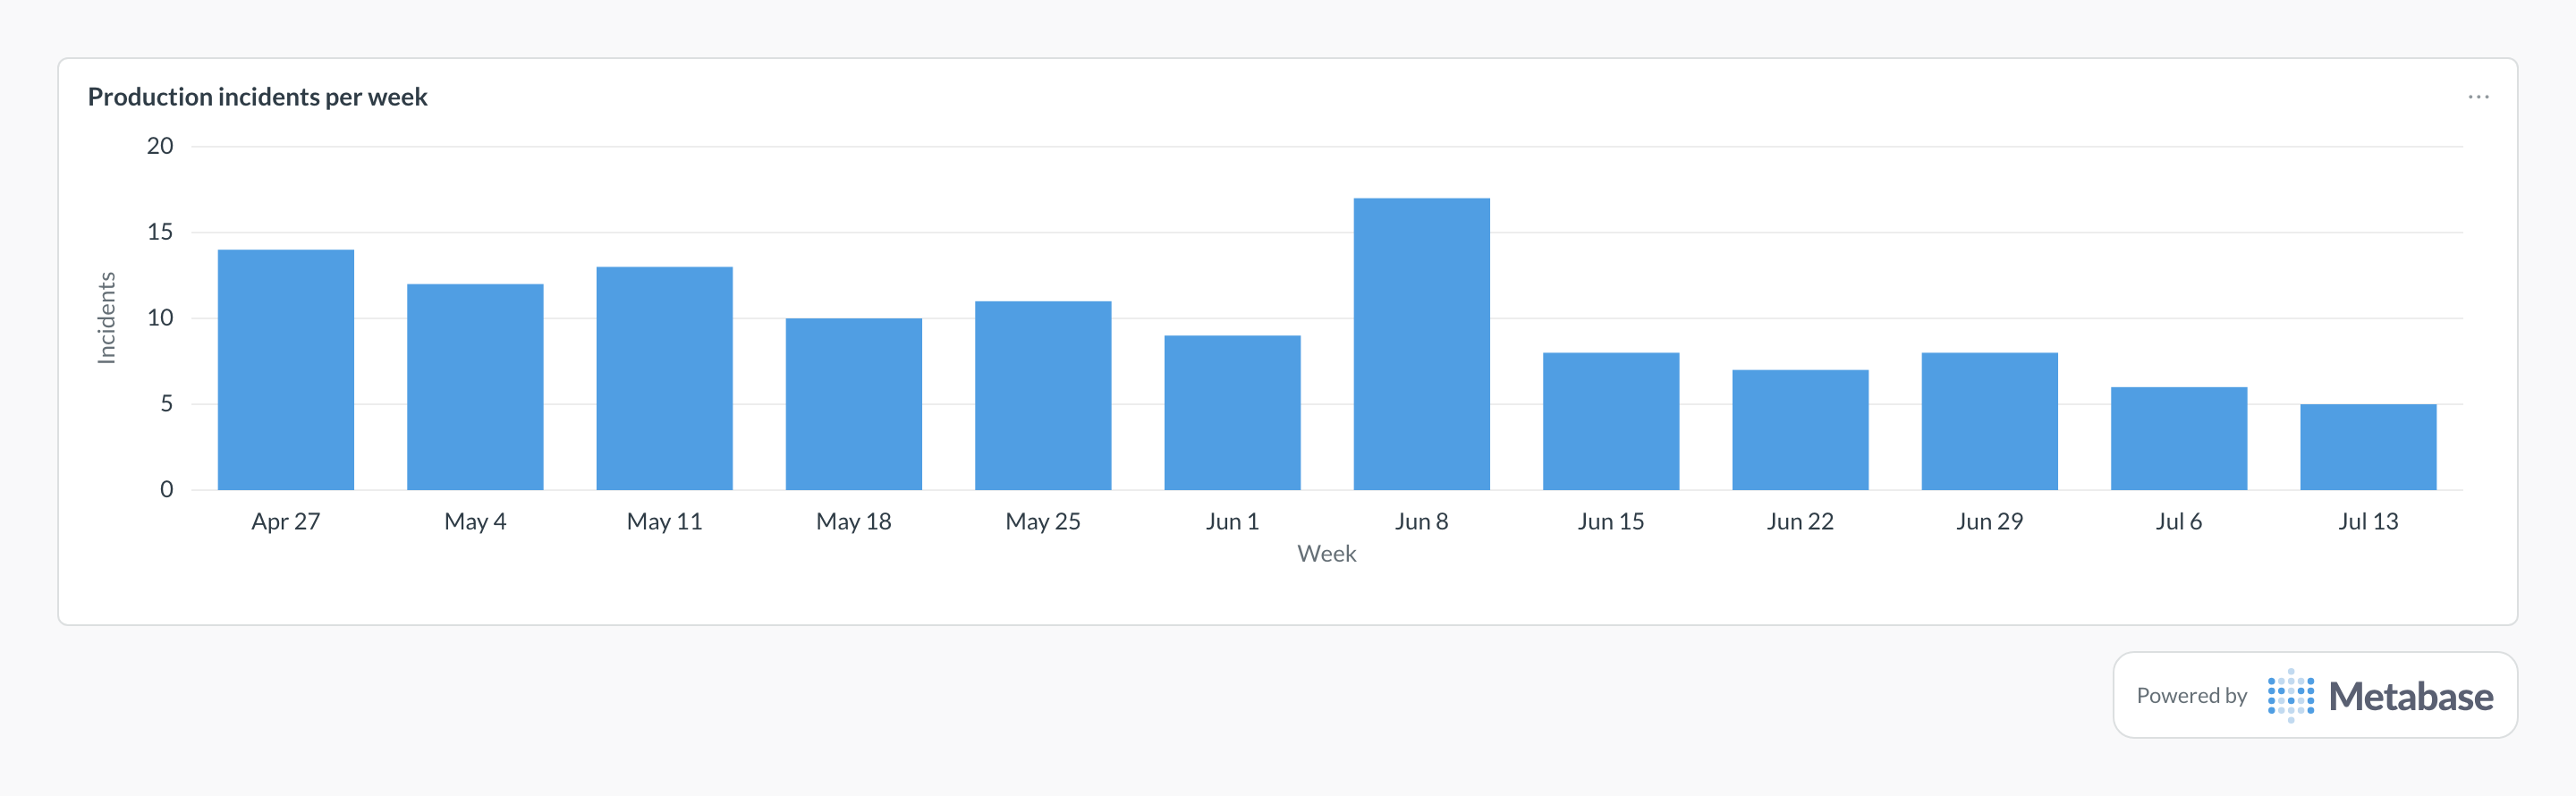
Count production incidents per week as bars and read the shape over a quarter, not any single week. The overall decline is reliability investment paying off, while a spike like Jun 8's often traces back to one upstream outage spawning a cluster of related incidents — check the severity split before treating it as a trend.
What incident count measures
It measures how often things break badly enough that a human had to respond. Trending it by severity and service shows whether reliability work is paying off and which services generate the load. The absolute number means little on its own — definitions vary too much between teams — but the trend and the distribution are decision-grade.
What data does it need?
-
An
incidentstable:created_at,severity,service_id,status, andenvironment. - A written qualifying rule: which severities, which sources, and whether auto-resolved pages count.
- Source: PagerDuty, Datadog incidents, Kibana cases, incident.io, or labeled issues with open timestamps.
SQL patterns
SELECT
  date_trunc('week', created_at) AS week,
  severity,
  COUNT(*) AS incidents
FROM incidents
WHERE environment = 'production'
GROUP BY 1, 2
ORDER BY 1, 2;SELECT
service_name,
COUNT(*) AS incidents,
COUNT(*) FILTER (WHERE severity IN ('sev1', 'sev2')) AS high_severity,
COUNT(*) FILTER (
WHERE created_at >= CURRENT_DATE - INTERVAL '30 days'
) AS last_30_days
FROM incidents
WHERE created_at >= CURRENT_DATE - INTERVAL '180 days'
GROUP BY service_name
ORDER BY incidents DESC;Pitfalls
Where this metric applies
- PagerDuty + Metabase — incidents with lifecycle timestamps
- Datadog + Metabase — incidents joined to monitors and SLOs
- Kibana + Metabase — cases from the Elastic Stack
- Sentry + Metabase — error spikes that escalated to incidents
Related
Metrics
Dashboards
FAQ
What counts as an incident?
incidents model, and apply it everywhere. Keep alerts out of the count — pages that led nowhere belong in the alert noise rate — and publish the rule next to the incident response dashboard so the numbers stay comparable over time.Should auto-resolved incidents count?
auto_resolved flag to the incidents table so dashboards can include or exclude them deliberately, and treat a rising auto-resolve share as an input to the alert noise rate cleanup list.Is incident count a team performance metric?
How do you track incident count in Metabase?
created_at, severity, service_id, and environment columns. Count rows per week with date_trunc, split by severity and service, and pin the results to an incident response dashboard next to MTTA and MTTR so volume and response read as one picture.