





What does an incident response dashboard show in Metabase?
An incident response dashboard shows whether failures get acknowledged and resolved fast enough, and whether the pager load is sustainable. It combines incident records from tools such as PagerDuty, Datadog, and Kibana cases in one governed view.
For: SREs, on-call engineers, engineering managers, and service owners. Grain: one row per incident, with created, acknowledged, and resolved timestamps.
What does an incident response dashboard look like?
Here’s the layout this guide builds, at the grain of a single incident: what’s open right now and how the response stages went, then acknowledgement and resolution speed by week and by team, then where the incidents come from. Read it in the weekly operations review, and mid-week when the pager feels heavy.
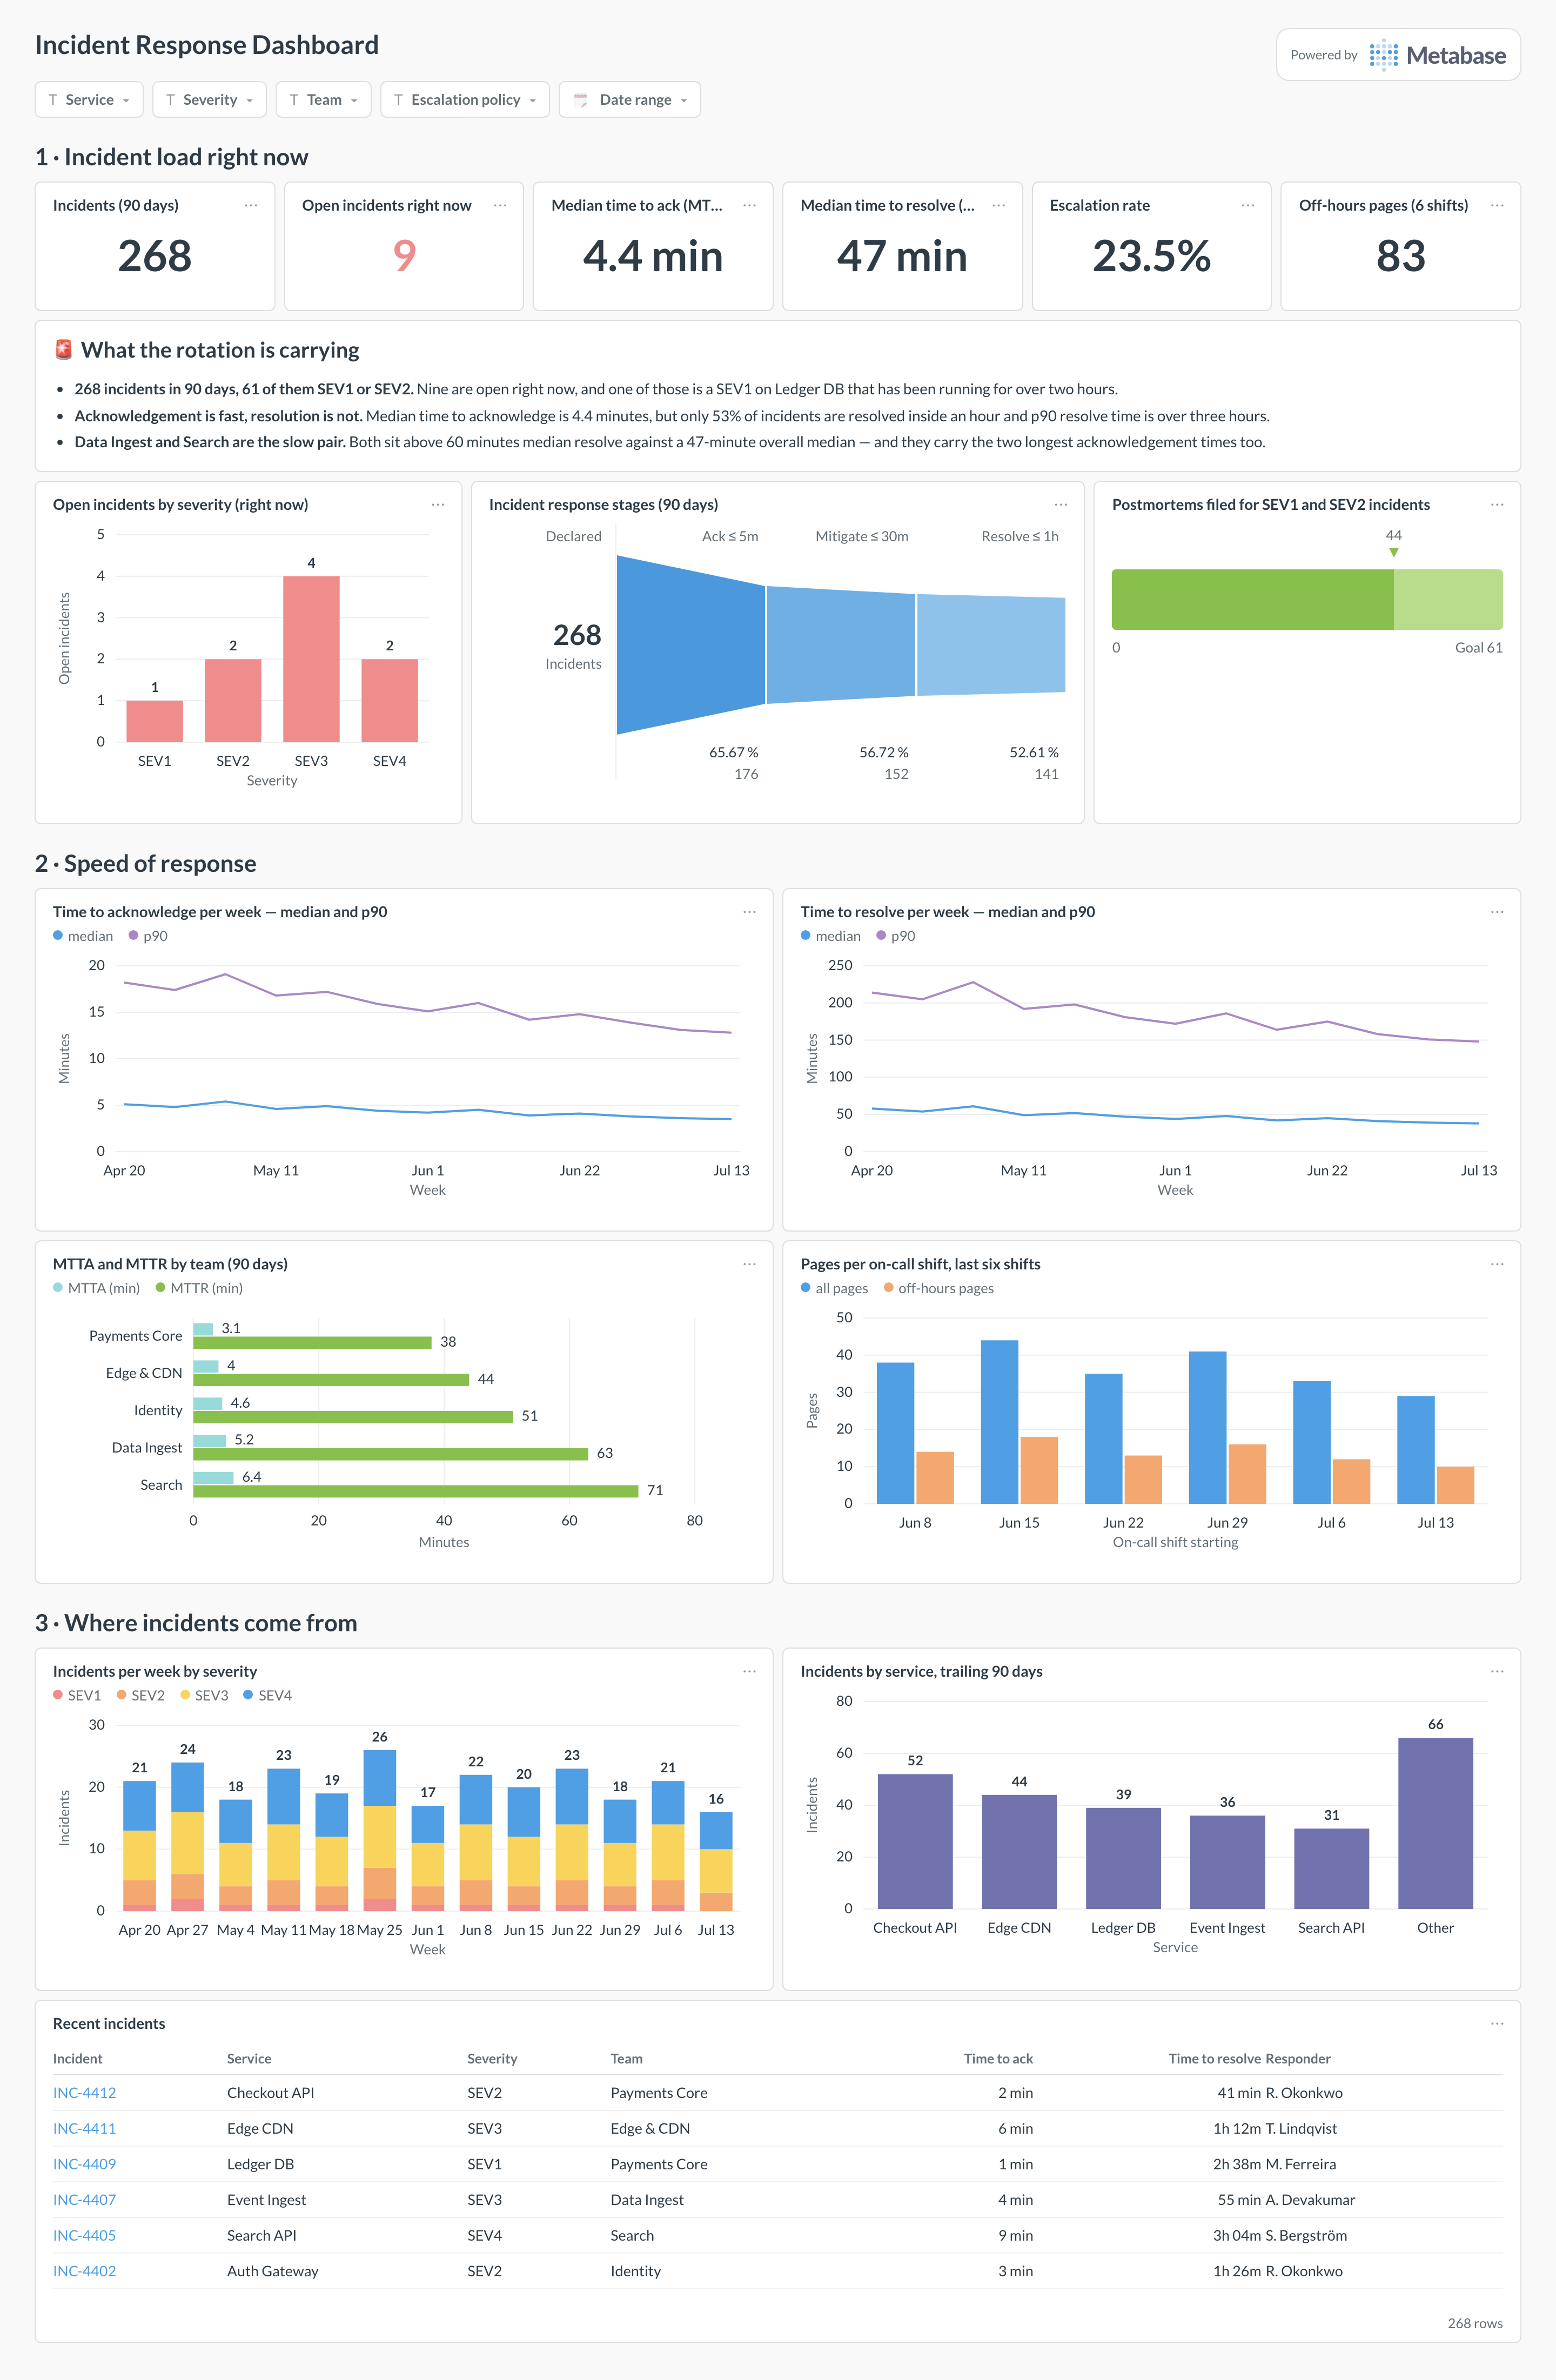
An example incident response dashboard in Metabase, built from PagerDuty and Datadog incident data. Figures are illustrative.
Which cards belong on an incident response dashboard?
- Incidents per week by severity (stacked bar)
- Median time to acknowledge (MTTA) with p90 (line)
- Median time to resolve (MTTR) with p90 (line)
- Open incidents right now by severity (number)
- Incidents by service, trailing 90 days (bar)
- Pages per on-call shift and off-hours pages (bar)
- Escalation rate — incidents needing a second responder
- Postmortem completion for high-severity incidents
What data does the dashboard need?
incidentswith stable ID, service, severity, created, acknowledged, and resolved timestamps.incident_log_entries(or equivalent lifecycle events) for escalations and reassignment analysis.serviceswith owners and teams, so incident load lands on the right roadmap.- Optional on-call schedule data for pages-per-shift and off-hours load.
How do you build it?
- Sync incidents and lifecycle events into a database or warehouse (see the PagerDuty guide for routes).
- Normalize severity values and define which records count as qualifying incidents — exclude test and duplicate pages.
- Compute durations only from records with both timestamps; exclude open incidents from MTTA/MTTR math.
- Build summary cards, per-service drill-throughs, and severity/service filters.
Example card SQL
SELECT
date_trunc('month', created_at) AS month,
COUNT(*) AS incidents,
COUNT(*) FILTER (WHERE severity IN ('sev1', 'sev2')) AS high_severity,
percentile_cont(0.5) WITHIN GROUP (
  ORDER BY EXTRACT(EPOCH FROM (acknowledged_at - created_at)) / 60
) AS median_ack_minutes,
percentile_cont(0.5) WITHIN GROUP (
  ORDER BY EXTRACT(EPOCH FROM (resolved_at - created_at)) / 60
) AS median_resolve_minutes
FROM incidents
WHERE resolved_at IS NOT NULL
GROUP BY 1
ORDER BY 1;
Related
Metrics
Integrations
Dashboards
FAQ
What is an incident response dashboard?
What data sources feed an incident response dashboard?
incidents table with created, acknowledged, and resolved timestamps, plus a services table for ownership. Deploy records from GitHub or GitLab are worth adding early: they turn the same data into change failure rate.