





What is MTTA, and how do you measure it in Metabase?
MTTA — mean time to acknowledge — is how long it takes a responder to pick up an incident after it's created. It's the paging-health half of incident response: MTTR tells you how long recovery takes, MTTA tells you whether anyone answered the page. Measure it in Metabase from incident timestamps synced from PagerDuty or Datadog.
created_at → acknowledged_at, reported as a median (and p90), not a mean. High MTTA usually
means escalation policies, schedules, or alert fatigue — not slow engineers.
What does an MTTA chart look like in Metabase?
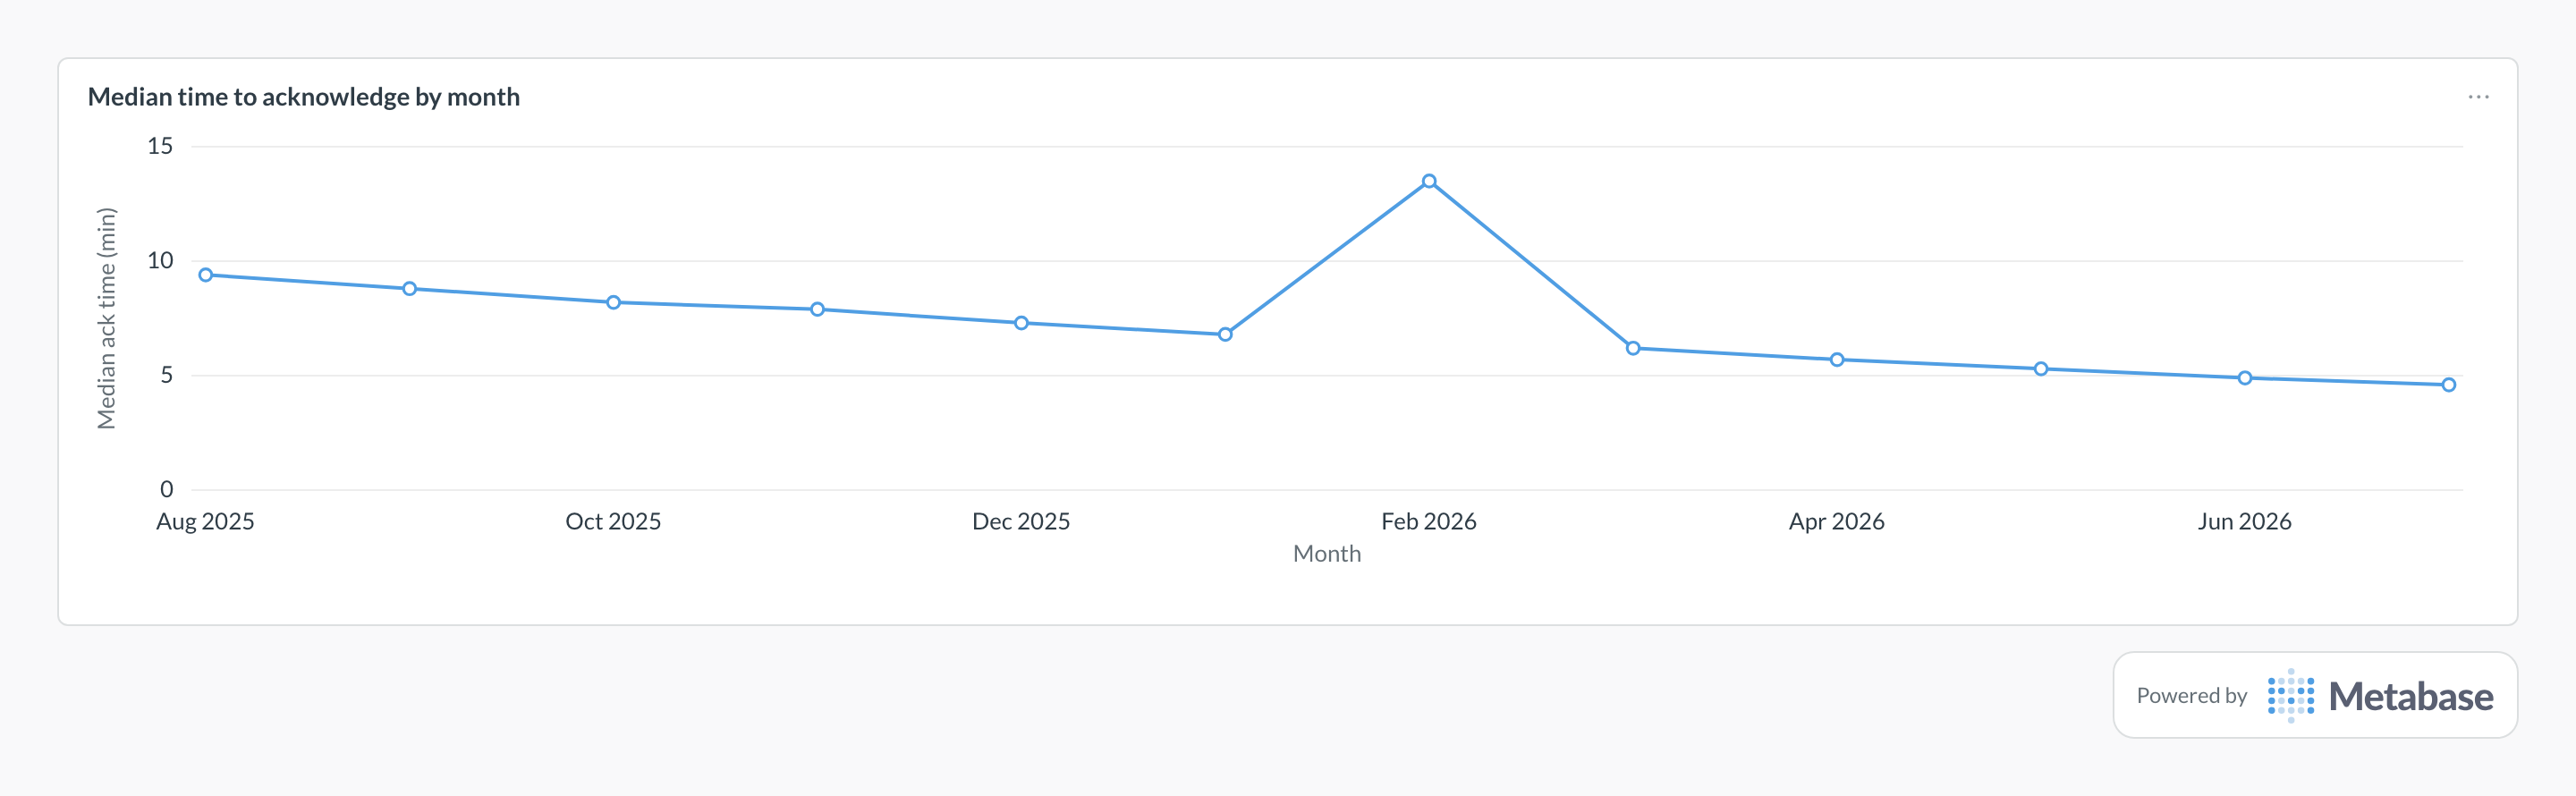
Chart the median minutes from incident creation to first human acknowledgment per month — median, not mean, because one unanswered 3 a.m. page skews an average for weeks. The steady decline tracks paging-hygiene work paying off, while a spike like February's usually means a noisy-alert stretch wearing down the on-call — check alert noise rate before blaming the rotation.
What MTTA measures
It measures the human front of the response pipeline: paging, escalation, and on-call attention. A rising MTTA with flat incident volume points at schedule gaps or alert fatigue; a healthy MTTA with terrible MTTR points the investigation at diagnosis and rollback instead.
What data does it need?
-
An
incidentstable withcreated_atandacknowledged_at(plus severity, service, and urgency for segmentation). - Source: PagerDuty incident log entries record the first acknowledge explicitly; most incident tools expose an equivalent.
SQL patterns
SELECT
  date_trunc('month', created_at) AS month,
  percentile_cont(0.5) WITHIN GROUP (
    ORDER BY EXTRACT(EPOCH FROM (acknowledged_at - created_at)) / 60
  ) AS median_ack_minutes,
  percentile_cont(0.9) WITHIN GROUP (
    ORDER BY EXTRACT(EPOCH FROM (acknowledged_at - created_at)) / 60
  ) AS p90_ack_minutes
FROM incidents
WHERE acknowledged_at IS NOT NULL
GROUP BY 1
ORDER BY 1;SELECT
CASE
WHEN EXTRACT(HOUR FROM created_at) BETWEEN 9 AND 17
AND EXTRACT(ISODOW FROM created_at) < 6
THEN 'business hours'
ELSE 'off hours'
END AS window,
COUNT(*) AS incidents,
percentile_cont(0.5) WITHIN GROUP (
ORDER BY EXTRACT(EPOCH FROM (acknowledged_at - created_at)) / 60
) AS median_ack_minutes
FROM incidents
WHERE acknowledged_at IS NOT NULL
AND created_at >= CURRENT_DATE - INTERVAL '90 days'
GROUP BY 1;Pitfalls
Where this metric applies
- PagerDuty + Metabase — acknowledge events from incident log entries
- Datadog + Metabase — incident lifecycle timestamps
- Kibana + Metabase — case status transitions
Related
Metrics
Dashboards
FAQ
MTTA vs. MTTR — which matters more?
What's a good MTTA?
Why is our MTTA rising?
How do you calculate MTTA?
acknowledged_at − created_at, aggregated per period. Despite the name, report it as a median — in SQL, percentile_cont(0.5) over the interval in minutes, with p90 alongside — because duration data is right-skewed. Exclude incidents that were never acknowledged or were auto-acknowledged by integrations. PagerDuty records the first acknowledge explicitly in incident log entries; Datadog exposes equivalent lifecycle timestamps.How do you track MTTA in Metabase?
created_at and acknowledged_at timestamps from PagerDuty or Datadog into a SQL database, then chart the monthly median and p90 with percentile_cont. Segment by urgency and business hours vs. off hours, and pin the result next to incident volume and MTTR on an incident response dashboard so paging health reads in context.