





What is alert noise rate, and how do you measure it in Metabase?
Alert noise rate is the share of alerts that never became incidents — pages that interrupted a human and led nowhere. It's the leading indicator for alert fatigue: sustained noise trains responders to ignore the pager, which is how real incidents get missed. Measure it in Metabase from alert and incident records synced from PagerDuty, Grafana, Datadog, or Prometheus.
alerts that became nothing ÷ all alerts
per monitor and per service. The per-monitor table matters more than the overall
number: noise concentrates in a handful of monitors, and that's the cleanup list.
What does an alert noise rate chart look like in Metabase?
Plot the share of alerts that never became incidents as a monthly line and watch for the slow slide downward — that's monitor cleanup paying off. A one-month spike like March's usually traces back to a single change, such as a new service onboarded with default thresholds, and the per-monitor table tells you which rules to retune.
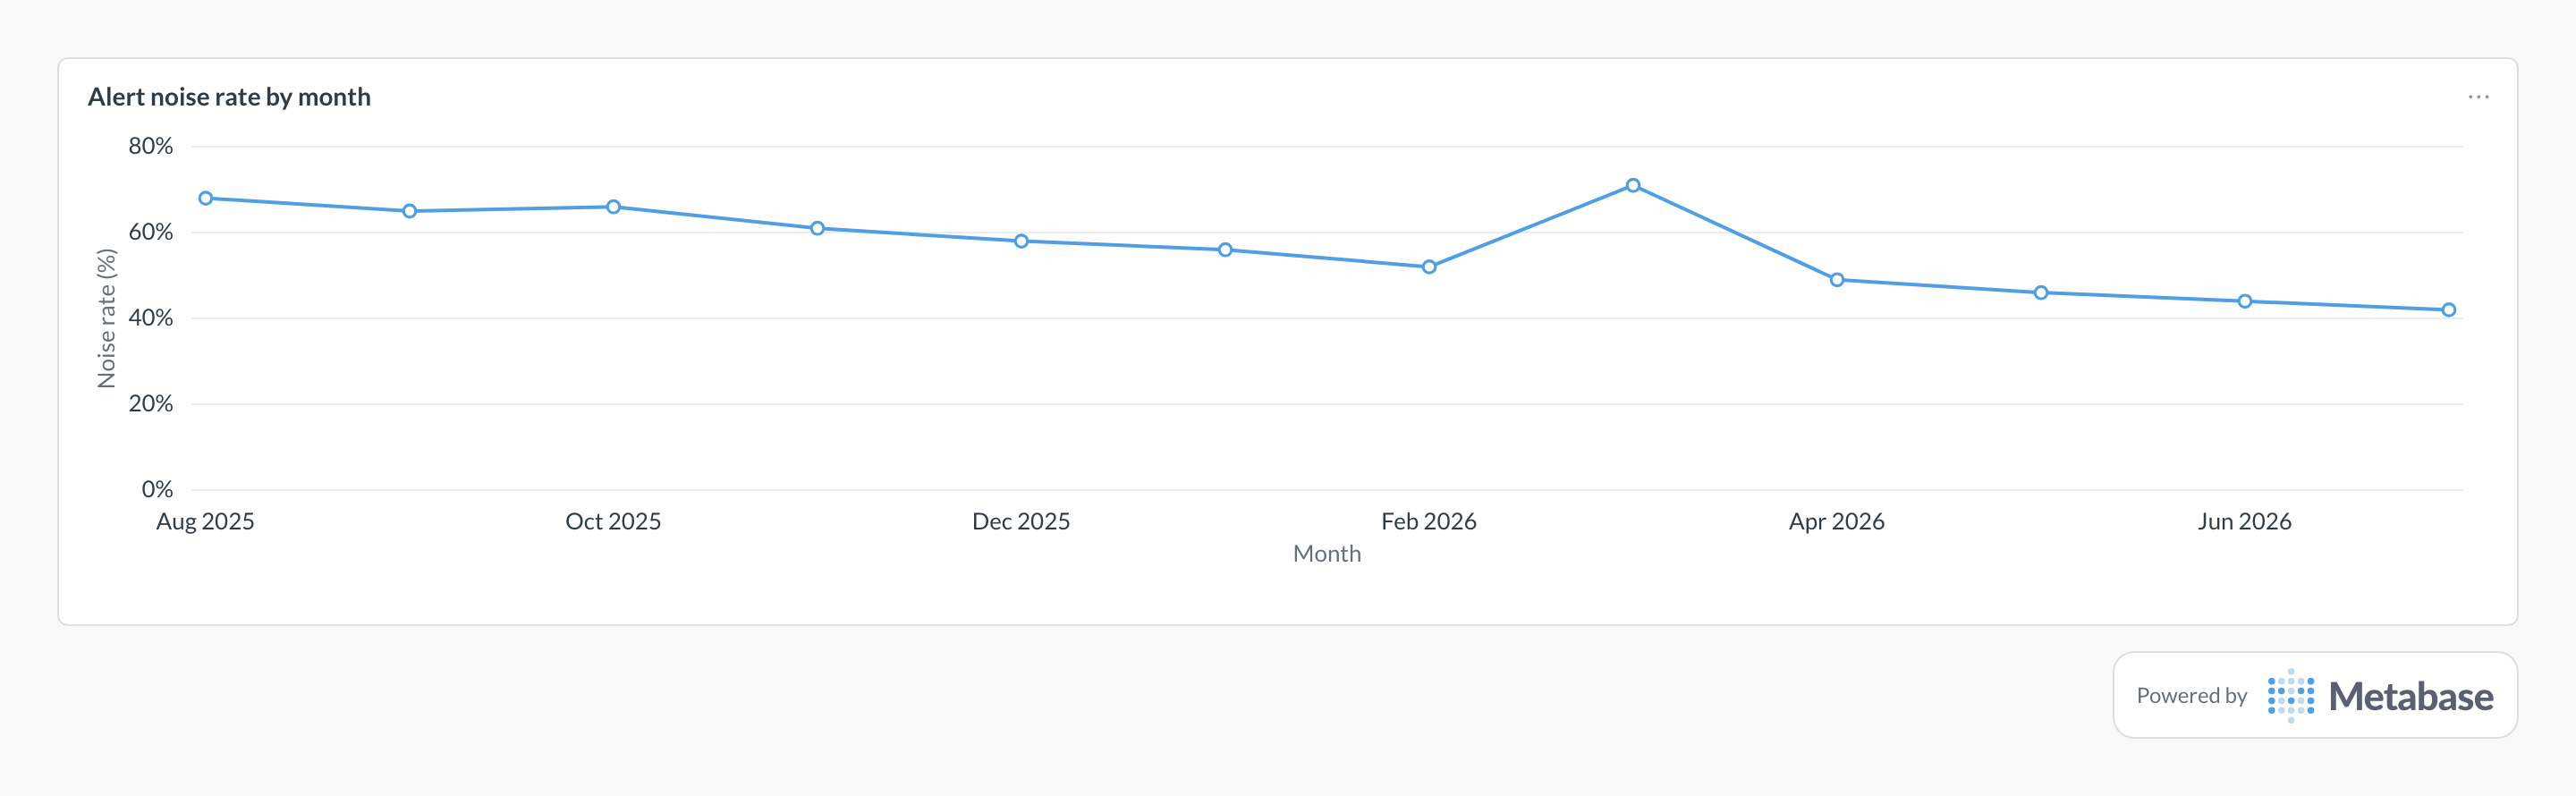
What alert noise rate measures
It measures whether the paging system deserves attention. Every noisy alert spends a little of the on-call's trust; when most pages are noise, response slows for all of them — which shows up later as rising MTTA. Tracked per monitor, it turns "the pager is annoying" into a ranked, fixable backlog.
What data does it need?
-
An
alertstable: monitor/rule ID, service,fired_at,resolved_at. -
A
became_incidentflag — from the incident tool's link between alert and incident, or a conservative join on service and time window. - Monitor metadata (owner, muted state) so the noisy list lands with the right team.
SQL patterns
SELECT
  date_trunc('month', fired_at) AS month,
  COUNT(*) AS alerts,
  COUNT(*) FILTER (WHERE became_incident) AS incidents,
  ROUND(
    100.0 * COUNT(*) FILTER (WHERE NOT became_incident)
    / NULLIF(COUNT(*), 0), 1
  ) AS noise_rate_pct
FROM alerts
GROUP BY 1
ORDER BY 1;SELECT
monitor_name,
COUNT(*) AS alerts_fired,
COUNT(*) FILTER (WHERE became_incident) AS incidents,
COUNT(*) FILTER (
WHERE resolved_at - fired_at < INTERVAL '5 minutes'
) AS self_resolved_fast
FROM alerts
WHERE fired_at >= CURRENT_DATE - INTERVAL '90 days'
GROUP BY monitor_name
HAVING COUNT(*) >= 5
AND COUNT(*) FILTER (WHERE became_incident) = 0
ORDER BY alerts_fired DESC;Pitfalls
Where this metric applies
- PagerDuty + Metabase — alerts linked to the incidents they triggered
- Grafana + Metabase — alert rule firings and states
- Datadog + Metabase — monitor events and incident links
- Prometheus + Metabase — alertmanager firings by rule
Related
Metrics
Dashboards
FAQ
How do I know whether an alert became an incident?
became_incident flag comes straight from the API. Without it, join conservatively on service plus a short time window and treat the result as an estimate — good enough to rank the noisiest monitors, not precise enough to publish next to incident count as an exact figure.What noise rate is acceptable?
Does auto-resolution count as noise?
resolved_at lands within a few minutes of fired_at, and treat a high self-resolve share as its own cleanup signal. They still interrupt whoever got paged, so they belong in the fatigue picture alongside MTTA; retune the offending rules in Grafana or Prometheus Alertmanager rather than muting them.How do you calculate alert noise rate?
COUNT(*) FILTER (WHERE NOT became_incident) / COUNT(*), per month and — more usefully — per monitor. Scope both numerator and denominator to alerts that actually paged someone; informational notifications aren't interruptions. The became_incident flag comes from the link your incident tool keeps between alert and incident — PagerDuty and Datadog both expose it — or from a conservative service-plus-time-window join.How do you track alert noise rate in Metabase?
alerts table with monitor, service, and timestamps, plus a became_incident flag. Chart the monthly noise rate for the trend, then build the per-monitor table — fired five or more times, never mattered — as the standing cleanup list on an alert quality dashboard.