





What is SLO compliance, and how do you measure it in Metabase?
SLO compliance is reliability judged against a promise: how actual availability (or latency, or freshness) compares to an explicit service-level objective, and how much error budget remains. It's the metric that turns "99.2% this month" into "fine" or "breach." Measure it in Metabase from SLO definitions plus health rollups synced from Honeycomb, Datadog, Prometheus, or Grafana.
(1 − actual) ÷ (1 − target); 100% means the budget is gone. Track the burn rate too — it's
the early warning that predicts the breach before it happens.
What does an SLO compliance chart look like in Metabase?
Chart the daily SLI against its objective and let the axis zoom to the band where the data lives — on a 0–100% scale both the goal line and any incident would vanish into the top pixel. Most days ride just under 100%, and the single drop below goal on Jul 20 is the shape that matters: one bad deploy burned about as much error budget as the other thirteen days combined.
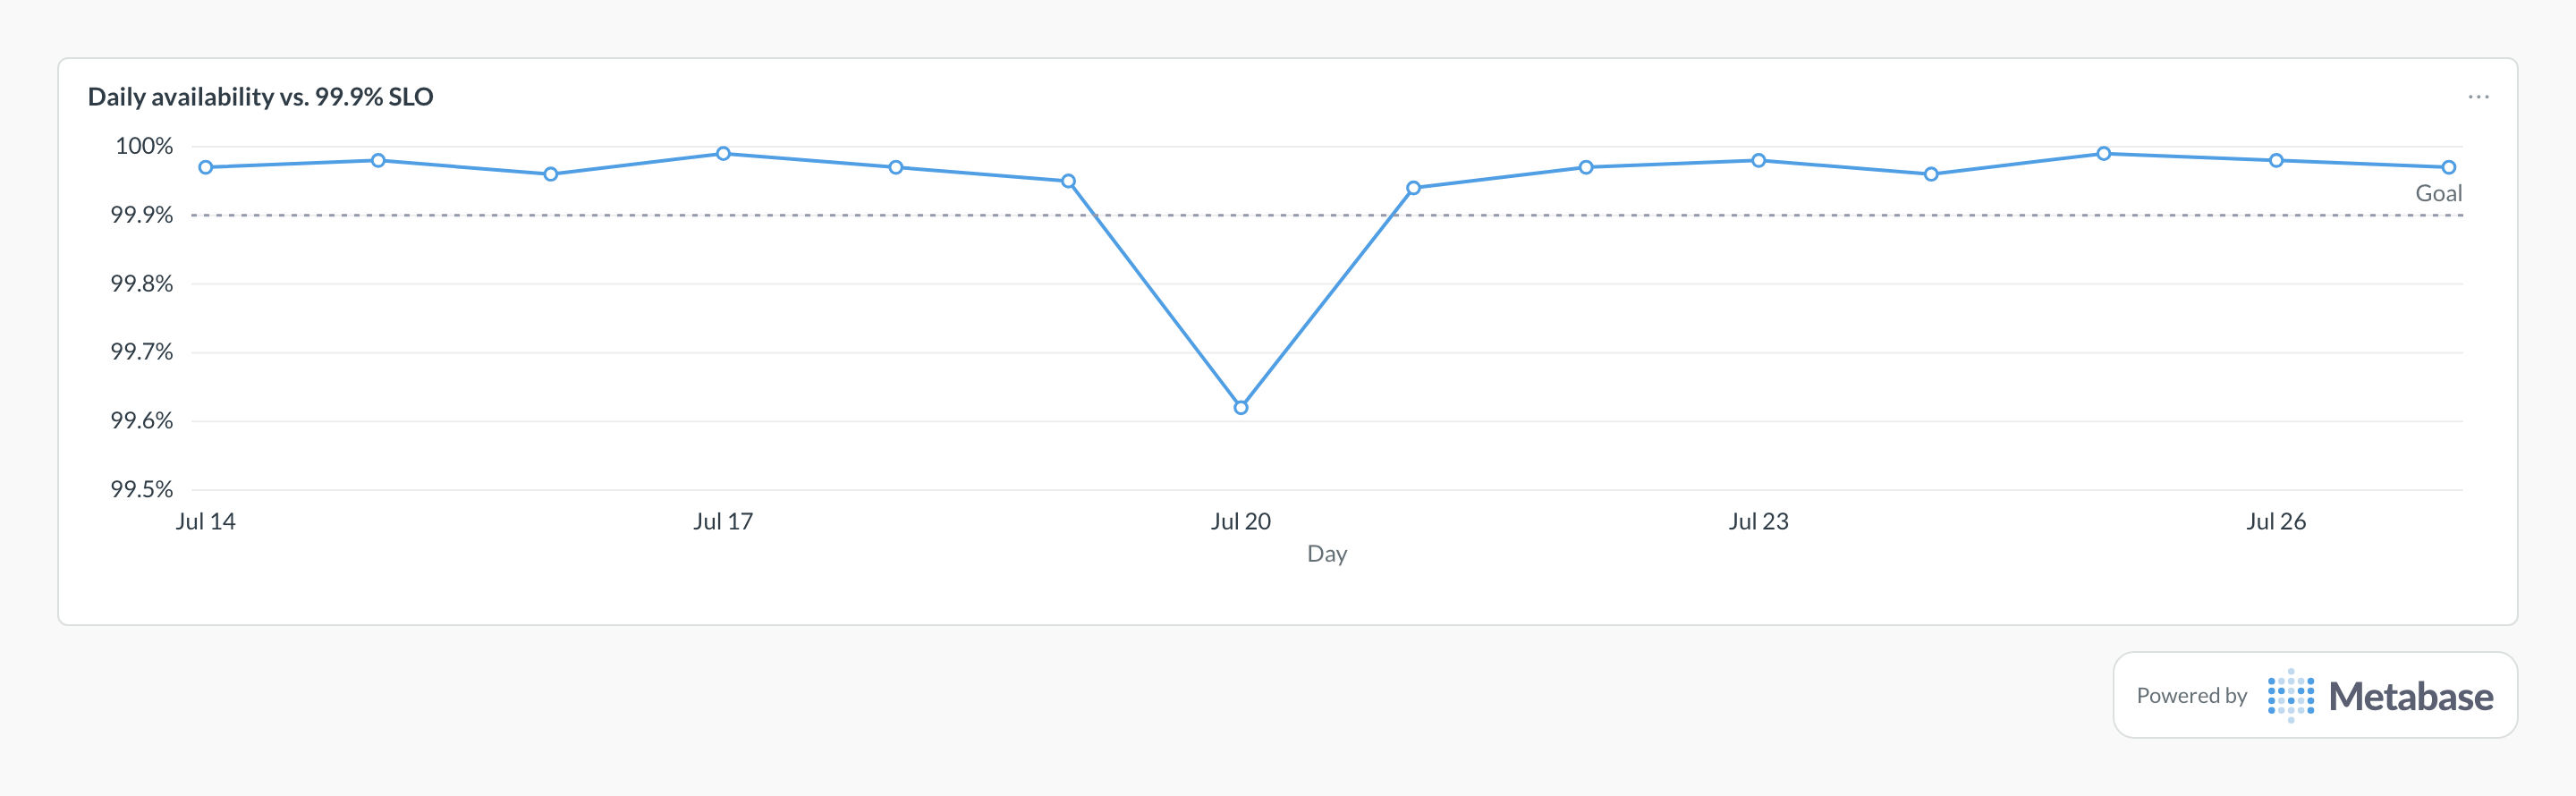
What SLO compliance measures
It measures whether reliability is meeting an agreed bar — and how much room is left for planned risk like deploys and migrations. The error budget reframes reliability as a resource to spend: a team with budget left can ship faster; a team that's burned it slows down and stabilizes. That makes this the rare reliability metric that directly informs delivery decisions.
What data does it need?
-
slo_definitions: service, objective (e.g. 99.9), indicator type, and window. -
service_health_rollupswith good/total counts per window — or the source tool's SLO status API results synced daily. -
Optional
incidentsto attribute budget burn to specific events.
SQL patterns
WITH actuals AS (
  SELECT
    r.service_name,
    s.slo_target,
    100.0 * SUM(r.successful_requests) / NULLIF(SUM(r.total_requests), 0)
      AS actual_pct
  FROM service_health_rollups r
  JOIN slo_definitions s ON s.service_name = r.service_name
  WHERE r.window_start >= date_trunc('month', CURRENT_DATE)
  GROUP BY r.service_name, s.slo_target
)
SELECT
  service_name,
  slo_target,
  ROUND(actual_pct, 3) AS actual_pct,
  ROUND(
    100.0 * (100.0 - actual_pct) / NULLIF(100.0 - slo_target, 0), 1
  ) AS budget_consumed_pct
FROM actuals
ORDER BY budget_consumed_pct DESC;SELECT
service_name,
date_trunc('day', window_start) AS day,
ROUND(
(1.0 - 1.0 * SUM(successful_requests) / NULLIF(SUM(total_requests), 0))
/ NULLIF((100.0 - MAX(slo_target)) / 100.0, 0), 2
) AS burn_rate
FROM service_health_rollups
WHERE window_start >= CURRENT_DATE - INTERVAL '28 days'
GROUP BY 1, 2
ORDER BY 1, 2;Pitfalls
Where this metric applies
- Honeycomb + Metabase — SLOs and burn alerts
- Datadog + Metabase — SLO status history
- Prometheus + Metabase — good/total counters per service
- Grafana + Metabase — SLO rollups and alert rules
Related
Metrics
Dashboards
FAQ
SLI, SLO, SLA — what's the difference?
What is a burn rate, exactly?
Can I track SLOs on things other than availability?
slo_definitions with its indicator type and window, and the budget-consumed and burn-rate queries work unchanged across all of them on one SLO tracking dashboard.How do you calculate error budget consumed?
(1 − actual) ÷ (1 − target). With a 99.9% target the budget is 0.1% unreliability; if actual availability lands at 99.95%, you've consumed 50% of it, and at 100% consumed any further failure is a breach. Compute actuals from service_health_rollups as successful over total requests — the same math as service availability — joined to slo_definitions, and rank services by budget consumed so the SLO tracking dashboard leads with the riskiest.How do you track SLO compliance in Metabase?
slo_definitions (service, objective, indicator, window) and service_health_rollups with good/total counts — from Honeycomb, Datadog, or Prometheus counters. Chart budget consumed per service for the current window and daily burn rate as the early warning, then pair the result with incident count to attribute budget burn to specific events.