





What is error rate, and how do you measure it in Metabase?
Error rate is the share of failed events — errors over total requests, sessions, or users, per window. It's the metric that turns raw error volume into something comparable across services and releases. Measure it in Metabase from rollups synced from Sentry, Prometheus, Datadog, or Cloudflare.
errors ÷ total per service per window, from
pre-aggregated rollups. The denominator is the whole game: errors per what? Pick requests, sessions, or users once and label every chart with it.
What does an error rate chart look like in Metabase?
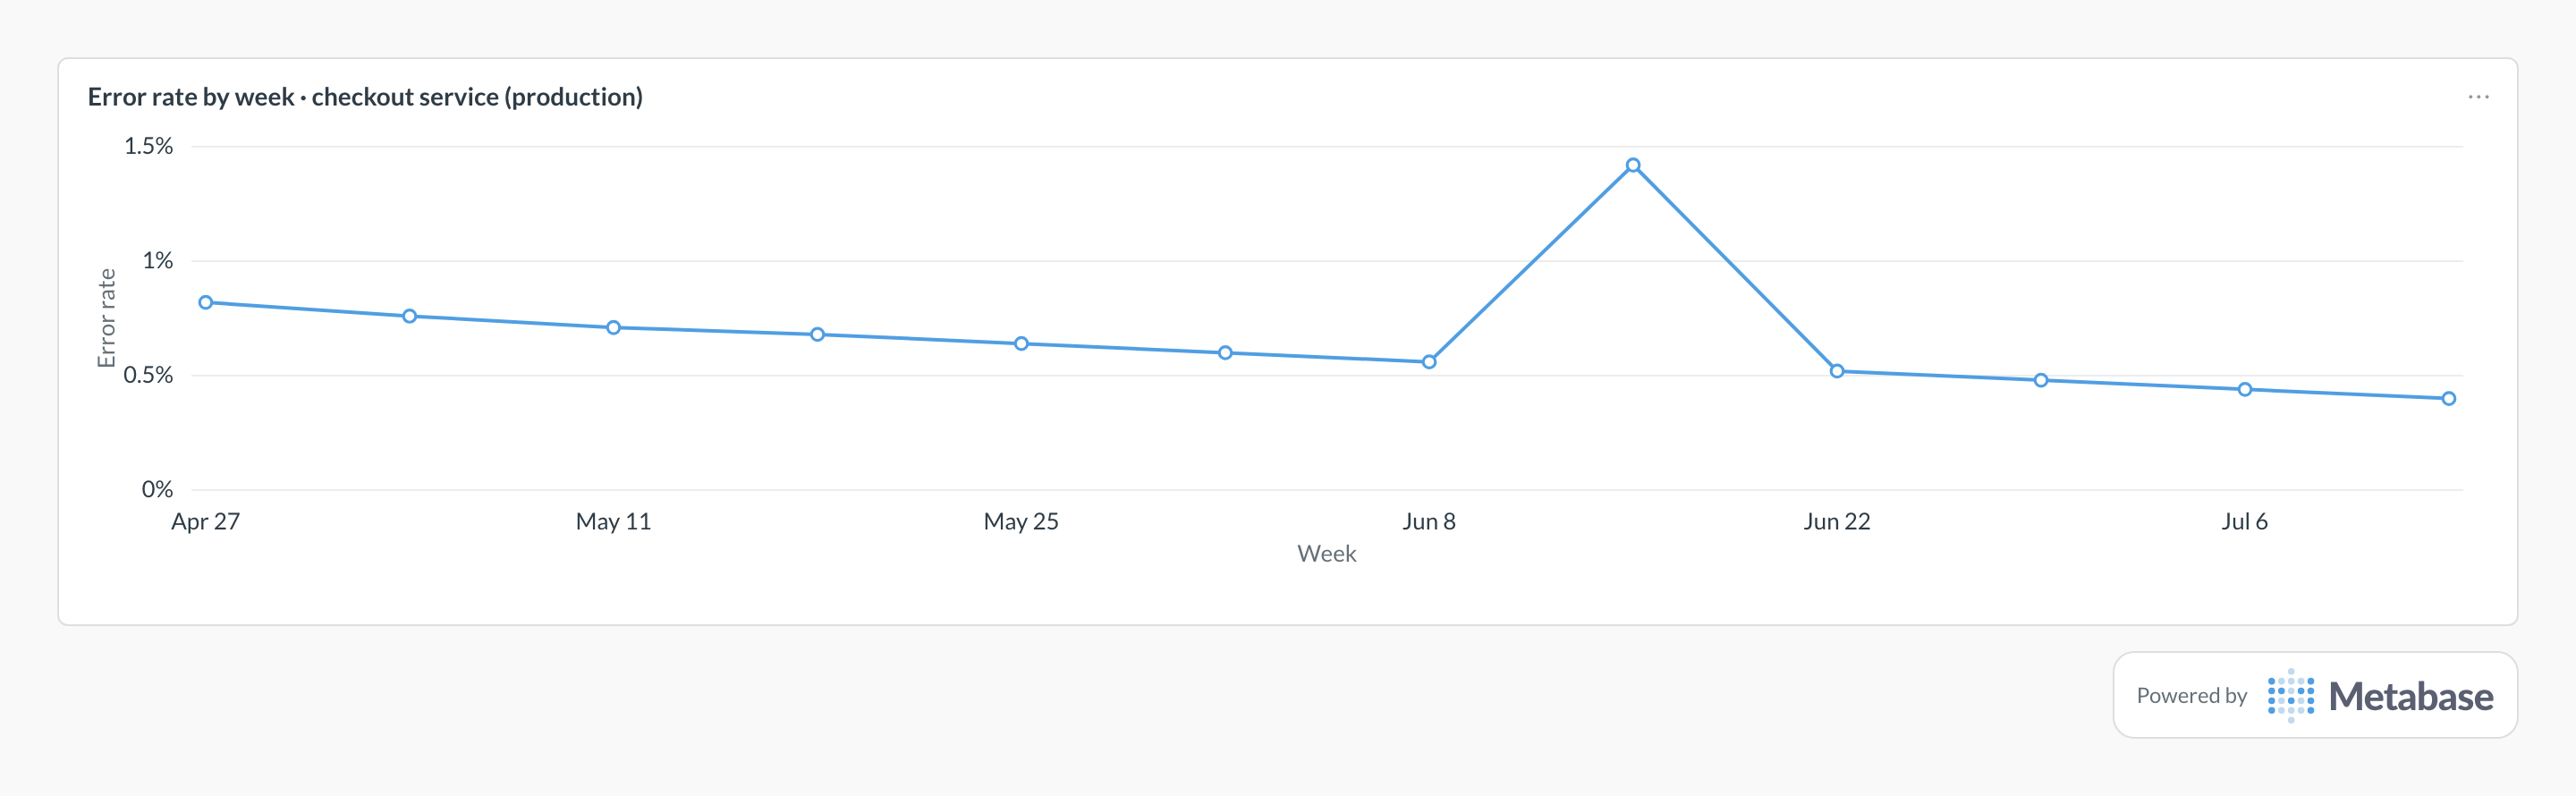
Chart failed requests over total requests per week for one production service, and read the baseline: the drift down from about 0.8% to 0.4% is reliability work landing. A sharp one-week spike like mid-June's is a release gone wrong — segment that window by version and error class, and the rollback shows up as the very next point returning to trend.
What error rate measures
It measures failure density, normalized for traffic. Raw error counts rise with growth even when nothing got worse; error rate separates "more users" from "more broken." Trended by service it feeds availability and SLO reporting; segmented by release it becomes the core of release-quality analysis.
What data does it need?
-
A rollup table with both numerator and denominator per window:
error_count(ortotal - successful) andtotal_requests/sessions. -
service,environment, and optionallyrelease_idfor segmentation. -
Source: Prometheus
query_rangeexports, Sentry event rollups plus session counts, Datadog timeseries, or edge analytics like Cloudflare's.
SQL patterns
SELECT
  service_name,
  date_trunc('week', window_start) AS week,
  ROUND(
    100.0 * SUM(total_requests - successful_requests)
    / NULLIF(SUM(total_requests), 0), 3
  ) AS error_rate_pct
FROM service_health_rollups
WHERE environment = 'production'
GROUP BY 1, 2
ORDER BY 1, 2;SELECT
r.version AS release,
SUM(e.event_count) AS error_events,
ROUND(
1.0 * SUM(e.event_count) / NULLIF(MAX(r.sessions), 0), 4
) AS errors_per_session
FROM error_rollups e
JOIN releases r ON r.id = e.release_id
WHERE e.environment = 'production'
GROUP BY r.version
ORDER BY MIN(r.released_at) DESC
LIMIT 15;Pitfalls
Where this metric applies
- Sentry + Metabase — error rollups with release and session context
- Raygun + Metabase — error groups and RUM sessions
- Prometheus + Metabase — request/error counters per service
- Cloudflare + Metabase — edge 4xx/5xx rates by zone
Related
Metrics
Dashboards
FAQ
Errors per request, per session, or per user?
How is error rate different from availability?
What's an acceptable error rate?
How do you calculate error rate?
errors ÷ total_requests (or sessions, or users). In SQL, sum both columns from a rollup table and divide — SUM(total_requests − successful_requests) / NULLIF(SUM(total_requests), 0) — and never average pre-computed percentages, which weights quiet hours the same as busy ones. Compute it from pre-aggregated counts synced from Sentry or Prometheus, because raw stored events are often sampled under load.How do you track error rate in Metabase?
errors ÷ total per service per week, add a release-segmented view for regressions, and pin both to the service availability and release quality dashboards.