





What is service availability, and how do you measure it in Metabase?
Service availability — uptime, in its request-based form — is the share of requests (or minutes) a service handled successfully. It's the headline reliability metric, and the input to SLO compliance. Measure it in Metabase from rollups synced from Prometheus, Datadog, Cloudflare, or Honeycomb.
successful ÷ total per service per window,
from hourly or daily rollups. Define "successful" once (status < 500, or probe
up), report per service against its own target, and never average across the fleet.
What does a service availability chart look like in Metabase?
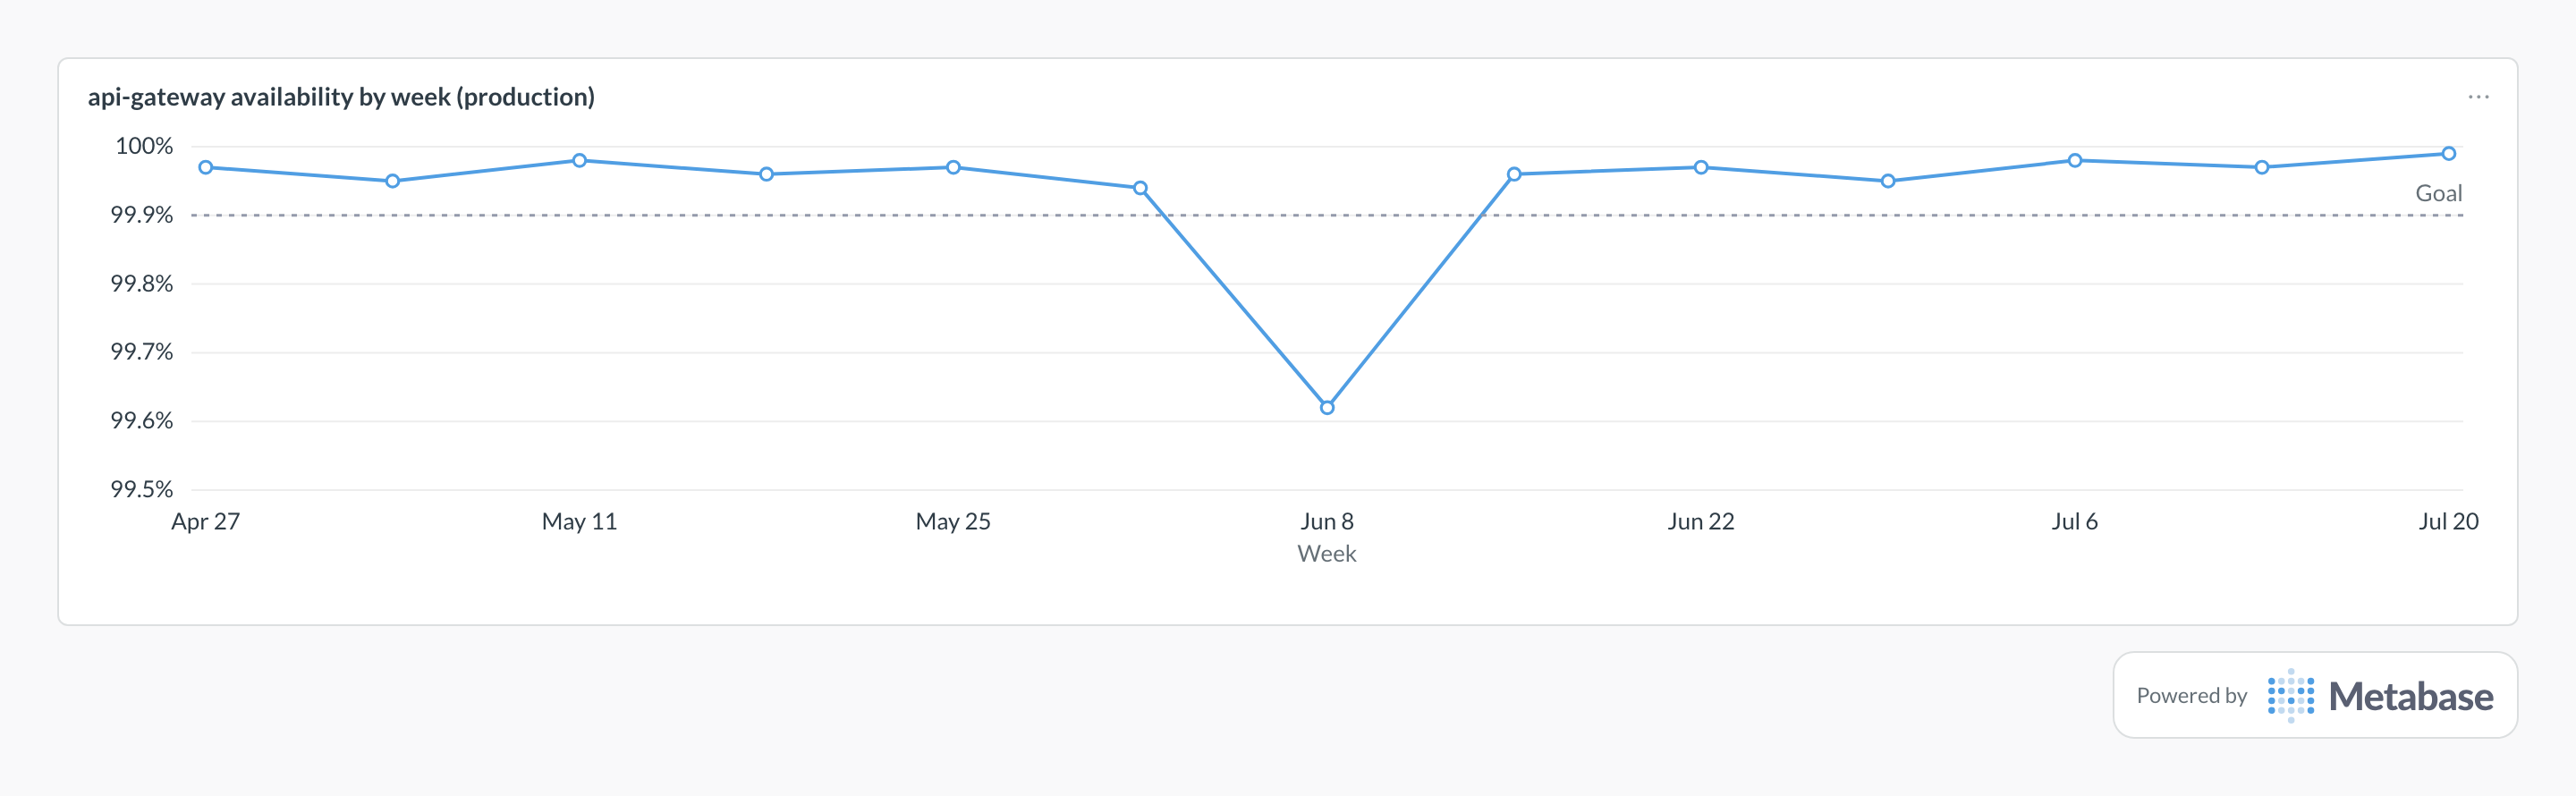
Chart one service's request-based availability per week as a line with its SLO as the goal line, and zoom the axis into the high-90s band — on a 0–100 scale every week looks identically perfect. The healthy weeks hug the line just above target, while a dip like Jun 8's below the goal is a single incident spending most of that period's error budget.
What service availability measures
It measures the share of demand that got served. Request-based availability weights busy periods naturally and reflects user experience; time-based availability (up-minutes over total minutes) suits probe-monitored and low-traffic systems. Either way, the number only becomes a verdict when compared to an explicit target — which is what SLO compliance adds.
What data does it need?
-
service_health_rollups:service_name,environment,window_start,total_requests,successful_requests. - A single, encoded definition of success — HTTP status class, probe result, or job completion.
- Source: Prometheus counters, Datadog SLO history, Cloudflare zone analytics, load-balancer logs, or synthetic probes.
SQL patterns
SELECT
  service_name,
  ROUND(
    100.0 * SUM(successful_requests) / NULLIF(SUM(total_requests), 0), 3
  ) AS availability_pct
FROM service_health_rollups
WHERE environment = 'production'
  AND window_start >= CURRENT_DATE - INTERVAL '28 days'
GROUP BY service_name
ORDER BY availability_pct ASC;SELECT
r.service_name,
s.slo_target,
ROUND(
100.0 * SUM(r.successful_requests) / NULLIF(SUM(r.total_requests), 0), 3
) AS availability_pct
FROM service_health_rollups r
JOIN slo_definitions s ON s.service_name = r.service_name
WHERE r.window_start >= CURRENT_DATE - INTERVAL '28 days'
GROUP BY r.service_name, s.slo_target
HAVING 100.0 * SUM(r.successful_requests) / NULLIF(SUM(r.total_requests), 0)
< s.slo_target
ORDER BY availability_pct ASC;Pitfalls
Where this metric applies
- Prometheus + Metabase — request and error counters per service
- Cloudflare + Metabase — edge availability by zone
- Datadog + Metabase — SLO status and monitor uptime
- Kubernetes + Metabase — workload health joined to service traffic
Related
Metrics
Dashboards
FAQ
Request-based or time-based availability?
successful ÷ total requests) for services with steady traffic — it weights busy periods naturally and reflects what users actually experienced. Time-based (up-minutes ÷ total minutes) suits probe-monitored, batch, or low-traffic systems where request counts mislead. Pick per service class, label the cards, and keep both flavors feeding the same SLO compliance math. Prometheus counters cover the request-based form; synthetic probes cover the time-based one.How many nines should we target?
slo_definitions, and measure SLO compliance against them rather than chasing a number nobody agreed to. The SLO tracking dashboard turns those targets into error budgets and burn rates.Is availability the same as uptime?
How do you calculate service availability?
SUM(successful_requests) / NULLIF(SUM(total_requests), 0) from hourly or daily rollups, with counters from Prometheus or edge analytics from Cloudflare as inputs. Define "successful" once — commonly status below 500, since 4xx is usually the caller's problem — and encode the rule in the rollup job. To aggregate across time, sum numerators and denominators; averaging daily percentages weights a quiet Sunday the same as a busy Monday.How do you track service availability in Metabase?
service_health_rollups — service, window, total and successful requests — from Prometheus, Datadog, or Cloudflare into a SQL database. Chart availability per service over a trailing window, join slo_definitions to flag services below target, and make "services below target" the headline card on a service availability dashboard — never the fleet average, which hides the one service that's down.