





What does a release quality dashboard show in Metabase?
A release quality dashboard shows whether each release makes the error picture better or worse — new error groups per release, error rates, regressions, and the deploys that had to be rolled back. It joins error data from tools such as Sentry and Raygun with deploy records from Vercel, GitHub, or GitLab.
For: Engineering leads, release owners, and QA. Grain: one row per release (or deploy), joined to error rollups and incidents.
What does a release quality dashboard look like?
Here’s the layout this guide builds: the health of the latest release at the top, then error rate, crash-free sessions, and deployments across recent releases, then the specific error groups and regressions behind them. Read it after each release, and before deciding whether to roll forward or back.
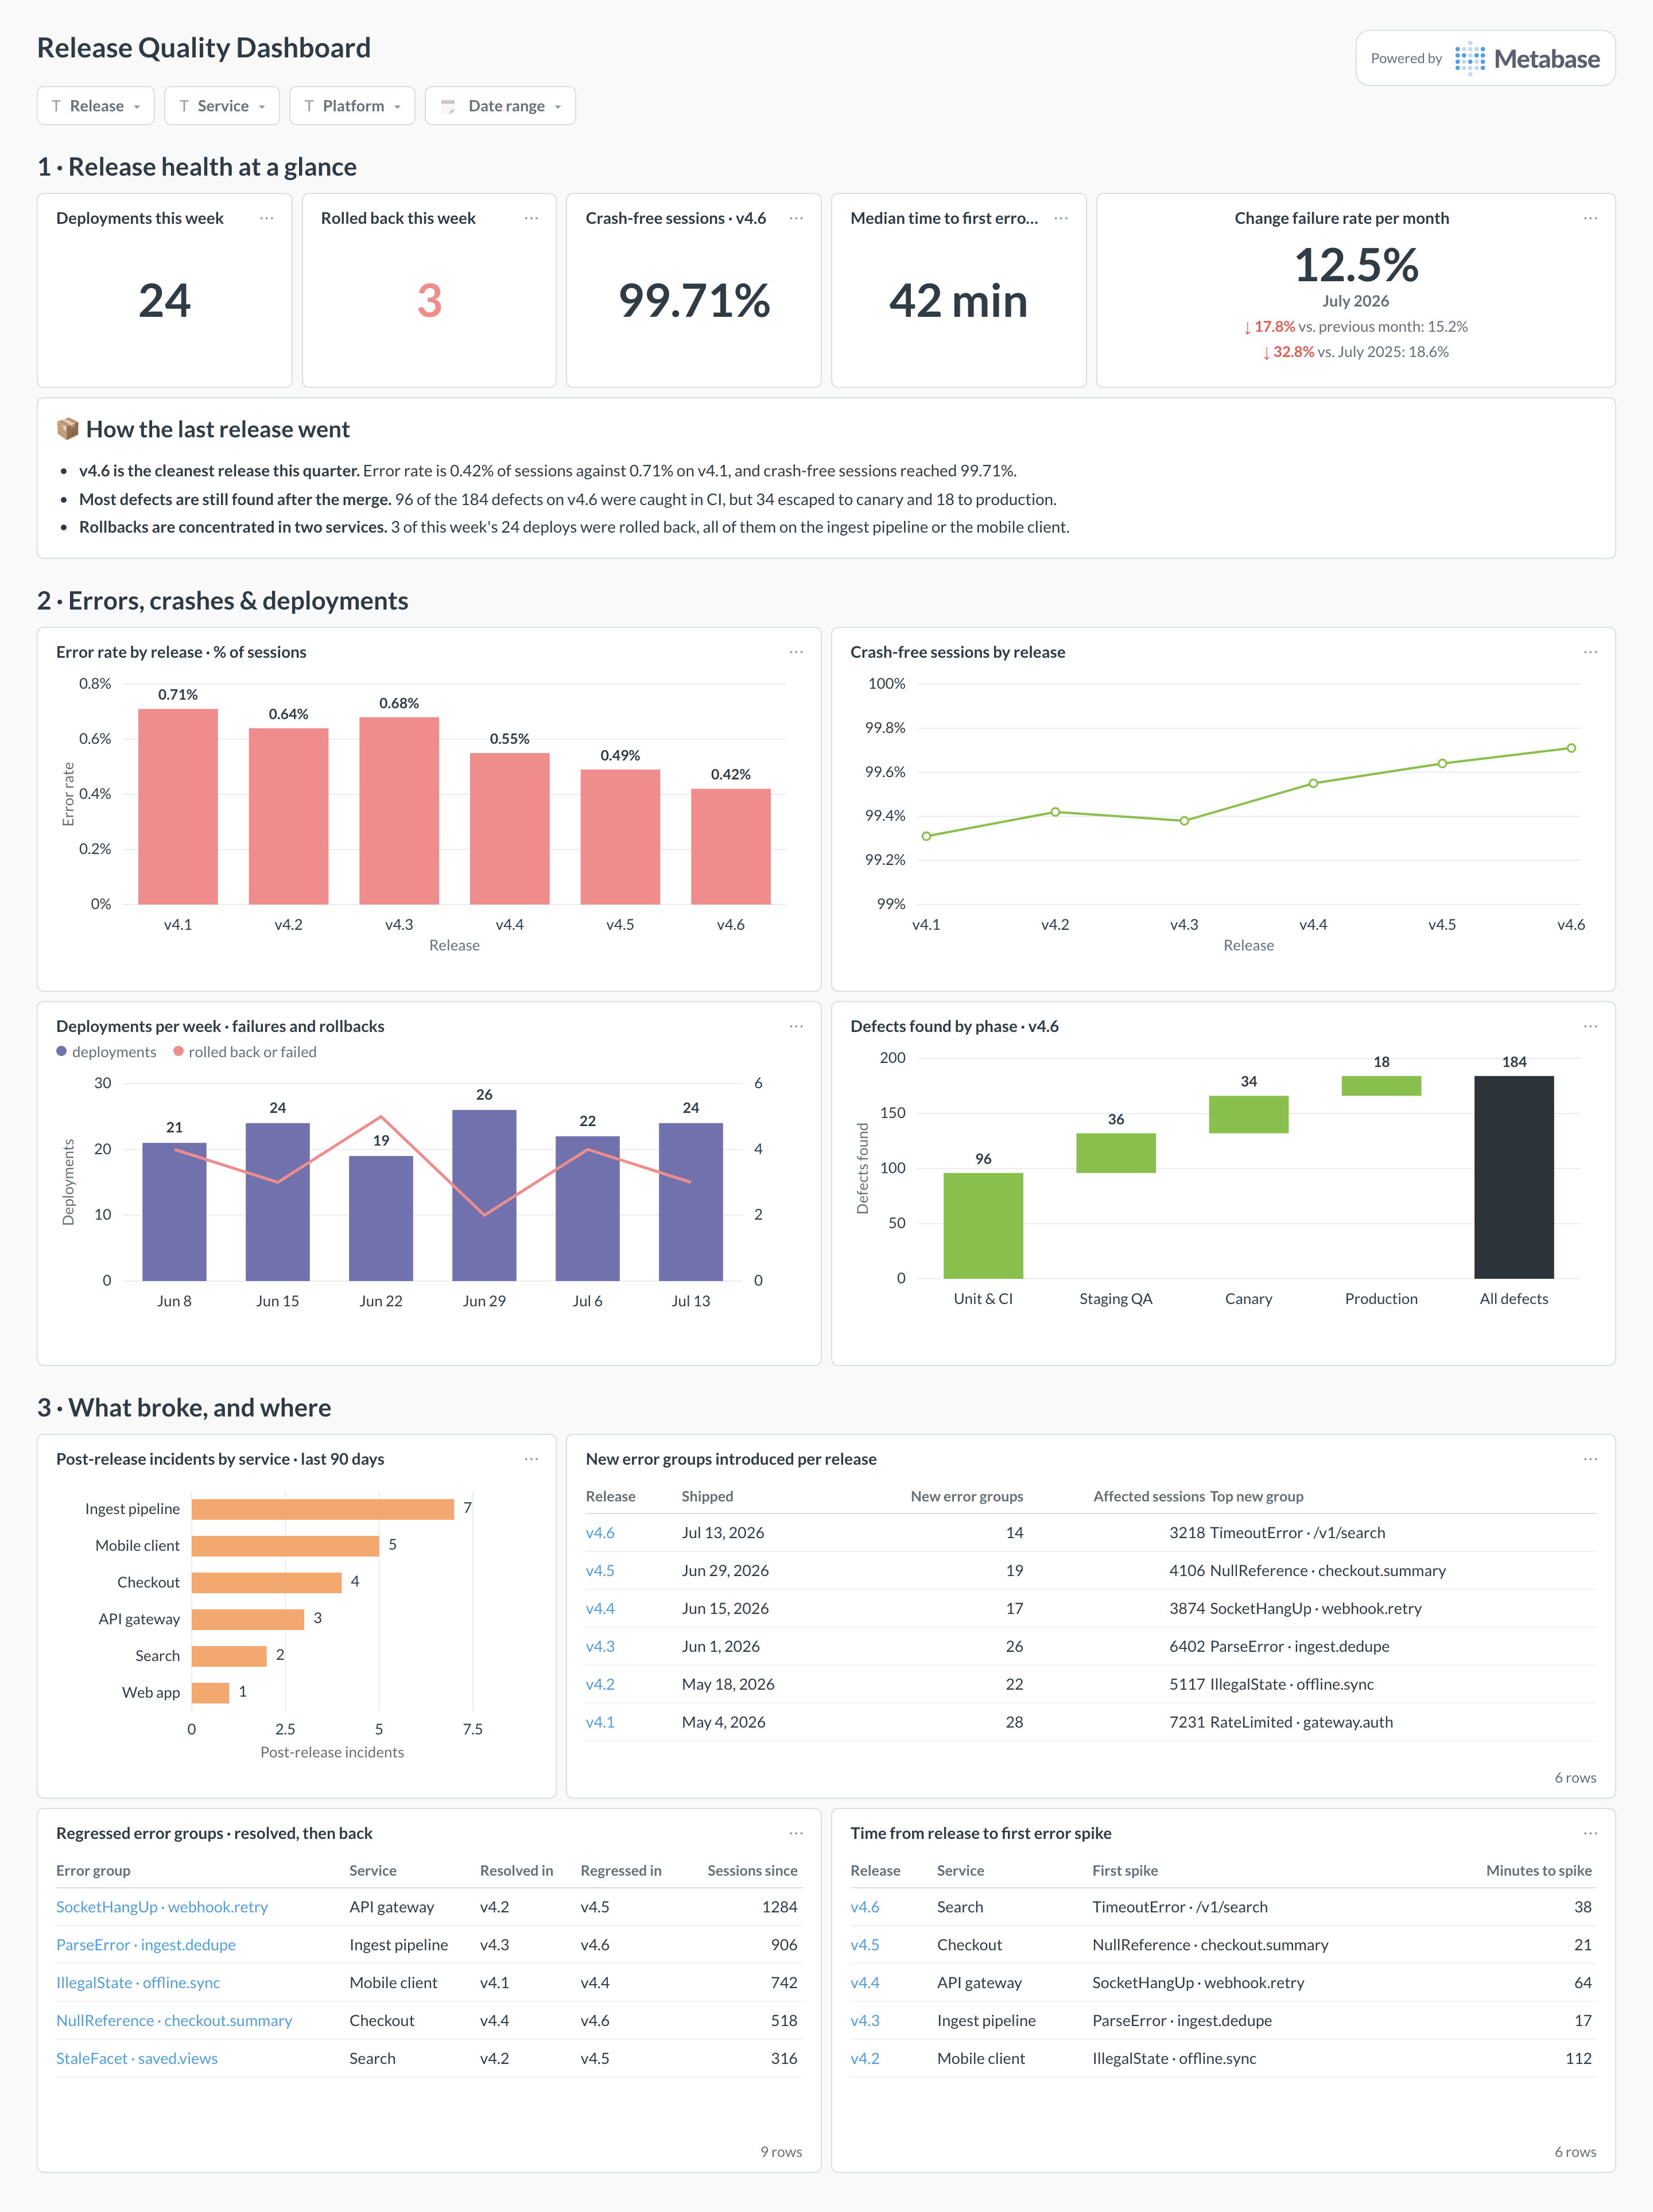
An example release quality dashboard in Metabase, built from release data joined to Sentry error rollups. Figures are illustrative.
Which cards belong on a release quality dashboard?
- Error rate by release (bar)
- New error groups introduced per release (table)
- Crash-free sessions or users by release (line)
- Regressed error groups — resolved, then back (table)
- Deployments per week with failures and rollbacks (combo)
- Change failure rate (number + trend)
- Time from release to first error spike (table)
What data does the dashboard need?
releases(ordeployments) with version, timestamp, environment, and status — plus session counts if the source tracks them.error_rollupstagged with a release ID — the join that makes per-release error rates possible.error_groupswith first-seen and resolved timestamps for regression detection.- Optional
incidentslinked to the triggering deploy.
How do you build it?
- Tag errors with releases in the source SDK (Sentry and Raygun both support it) — without the tag, this dashboard can’t exist.
- Sync releases, error groups, and rollups into a database (see the Sentry guide for routes).
- Join deploys from your delivery stack for change failure rate and rollback tracking.
- Build the per-release table first, then trends; annotate spikes with the release that shipped them.
Example card SQL
SELECT
r.version AS release,
MIN(r.released_at) AS released_at,
COUNT(DISTINCT e.error_group_id) FILTER (
  WHERE g.first_seen_at >= r.released_at
) AS new_error_groups,
SUM(e.event_count) AS error_events,
ROUND(
  1.0 * SUM(e.event_count) / NULLIF(MAX(r.sessions), 0), 4
) AS errors_per_session
FROM releases r
LEFT JOIN error_rollups e ON e.release_id = r.id
LEFT JOIN error_groups g ON g.id = e.error_group_id
WHERE e.environment = 'production'
GROUP BY r.version
ORDER BY MIN(r.released_at) DESC
LIMIT 20;
Related
Metrics
Integrations
Dashboards
FAQ
What is a release quality dashboard?
What data sources feed a release quality dashboard?
releases, error_groups, and error_rollups tables; the release tag on errors is the field that makes everything else possible.How is this different from a software delivery dashboard?
What if my errors aren't tagged with releases?
How do you measure change failure rate from this data?
releases table provides the denominator; rollback status, incident links, and new-error-group spikes provide the numerator. Pair it with deployment frequency and MTTR to complete the DORA stability picture.