




What are the DORA metrics, and how do you track them in Metabase?
DORA metrics are four measures of software delivery performance from the DevOps Research and Assessment program: deployment frequency, lead time for changes, change failure rate, and time to restore service (often called MTTR). Together they balance throughput (how fast you ship) against stability (how safely). Measure them in Metabase from GitHub or GitLab data synced into a database, joined with deploy and incident records.
What does a DORA metrics chart look like in Metabase?
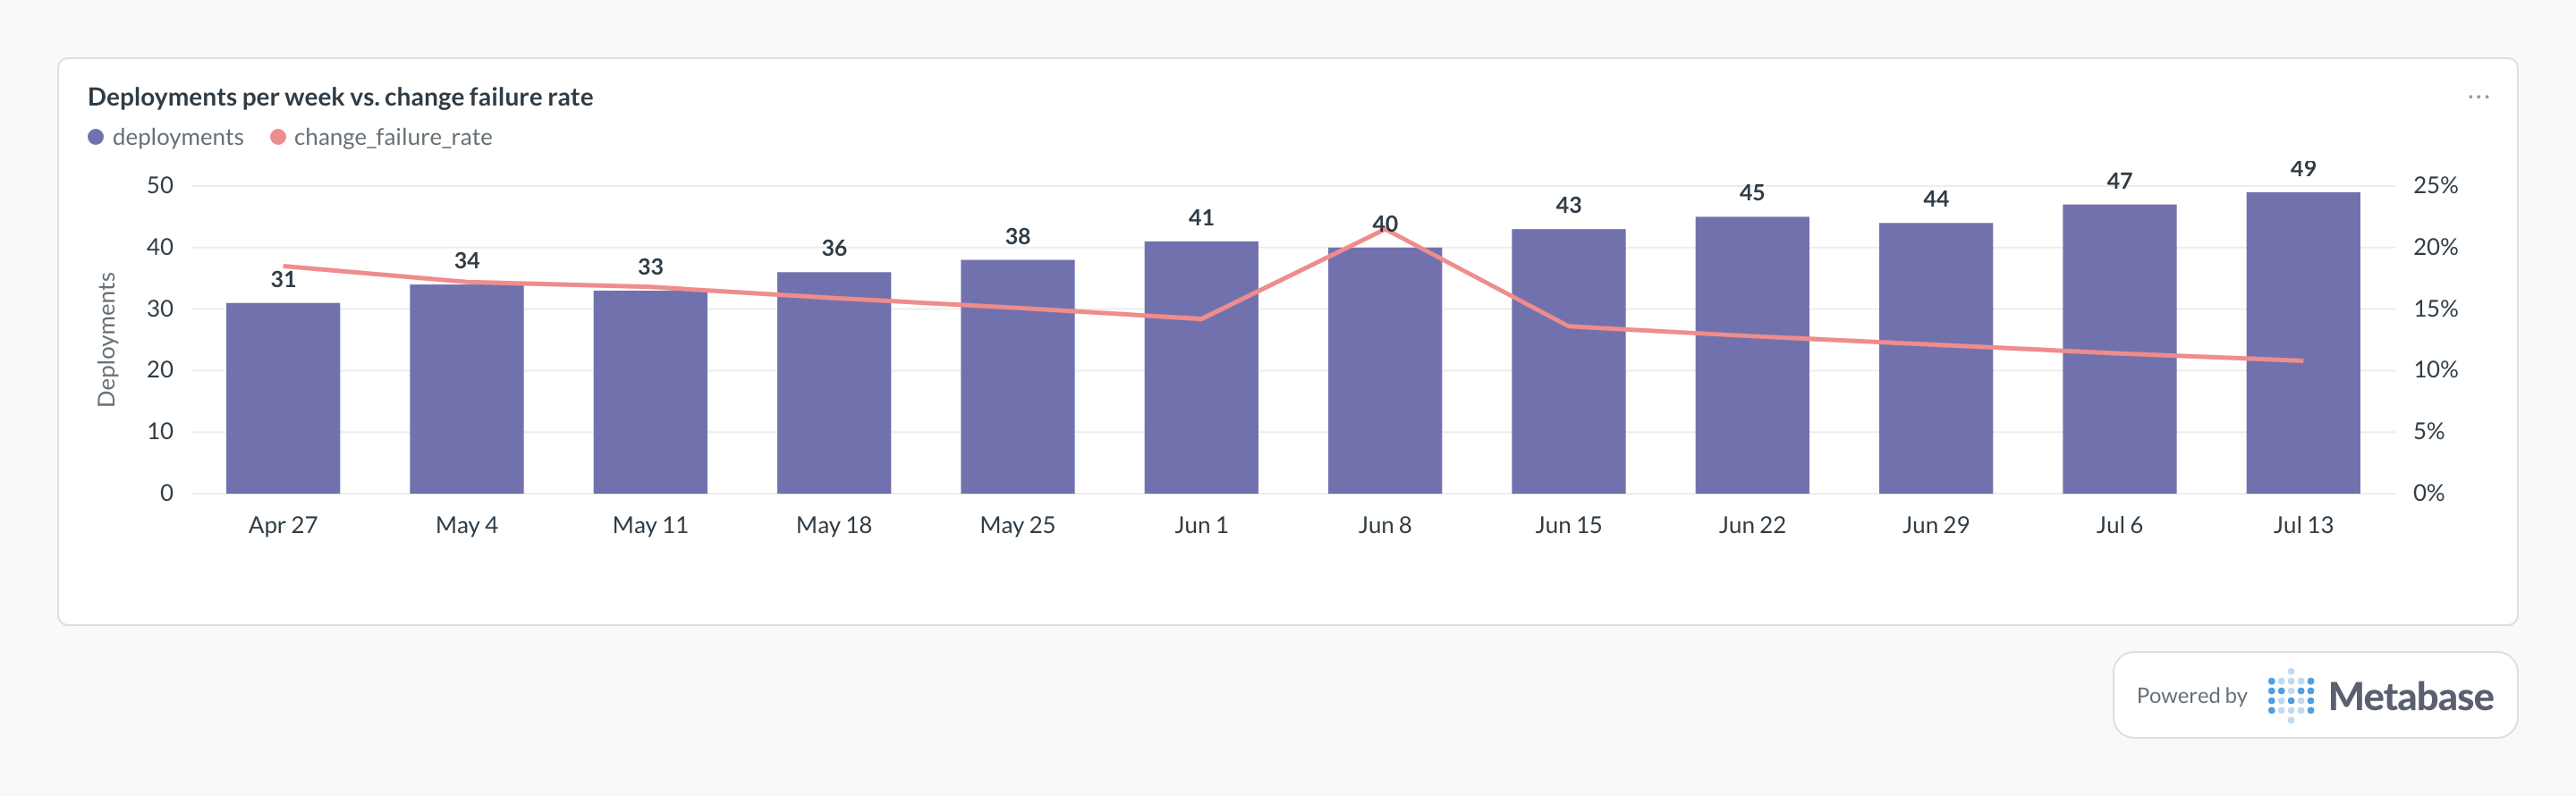
Read throughput and stability together: deployments per week climb from 31 to 49 while change failure rate falls from around 18% into the ≤15% elite band. The one-week spike to 21.5% on Jun 8 is the pattern worth catching — a bad release, not a bad trend — and pairing the two series is what stops a speed push from quietly shipping instability.
The four keys
| Metric | Question it answers | Source data |
|---|---|---|
| Deployment frequency | How often do we ship to production? | Successful production deployments |
| Lead time for changes | How long from commit to production? | Commits joined to the deploy that shipped them |
| Change failure rate | What share of deploys cause a failure? | Deployments joined to incidents/rollbacks |
| Time to restore (MTTR) | How fast do we recover from failures? | Incident start → resolve timestamps |
The first two measure throughput; the last two measure stability. Healthy teams improve both together — speed without stability just ships bugs faster.
Performance bands (directional)
DORA groups teams into Elite / High / Medium / Low. The exact thresholds shift with each annual report, so treat these as directional, not a scoreboard:
| Metric | Elite | High | Medium | Low |
|---|---|---|---|---|
| Deployment frequency | On-demand (multiple/day) | Daily–weekly | Weekly–monthly | < monthly |
| Lead time for changes | < 1 day | 1 day–1 week | 1 week–1 month | > 1 month |
| Change failure rate | ≤ 15% | ≤ 15% | ~16–30% | > 30% |
| Time to restore (MTTR) | < 1 hour | < 1 day | 1 day–1 week | > 1 week |
What data do DORA metrics need?
- Deployments — a production deploy record with
environment,status,created_at, and theshashipped (GitHub Deployments/Actions, GitLab environments/pipelines, or your CD tool). - Commits —
sha+committed_atto compute lead time for changes. - Incidents —
started_at/resolved_at(and ideally a link to the offending deploy) for change failure rate and MTTR. Comes from PagerDuty, Opsgenie, incident.io, or an issues label.
How do you build DORA metrics in Metabase?
- Sync GitHub or GitLab into a database, plus your incident source.
-
Model a clean
deploymentstable (one row per production deploy) and anincidentstable. - Define each metric once as a saved question or model, then assemble a DORA dashboard. See the GitHub or GitLab AI prompt for a starting layout.
Common mistakes
Related
Integrations
Metrics
Dashboards
Terms
FAQ
What are the DORA metrics?
What does DORA stand for?
Is MTTR officially a DORA metric?
Can I get DORA metrics from GitHub or GitLab alone?
How do you track DORA metrics in Metabase?
deployments table (one row per production deploy) and an incidents table. Define each metric once as a saved question or model, and assemble the four into a software delivery dashboard. The key rule: a merged PR is not a deploy — anchor every metric to real production deployments and incidents.