




What is deployment frequency, and how do you measure it in Metabase?
Deployment frequency is how often a team successfully releases to production. It's one of the four DORA metrics and the clearest signal of delivery throughput — elite teams deploy on demand, many times a day. Measure it in Metabase from GitHub or GitLab deploy data synced into a database.
What does a deployment frequency chart look like in Metabase?
Chart successful production deployments per week as bars, and read the shape rather than any single week. The overall climb is the metric moving the right way — smaller, safer batches — while a one-week dip like Jun 8's usually has a boring explanation, a release freeze or a holiday, worth a note rather than an alarm.
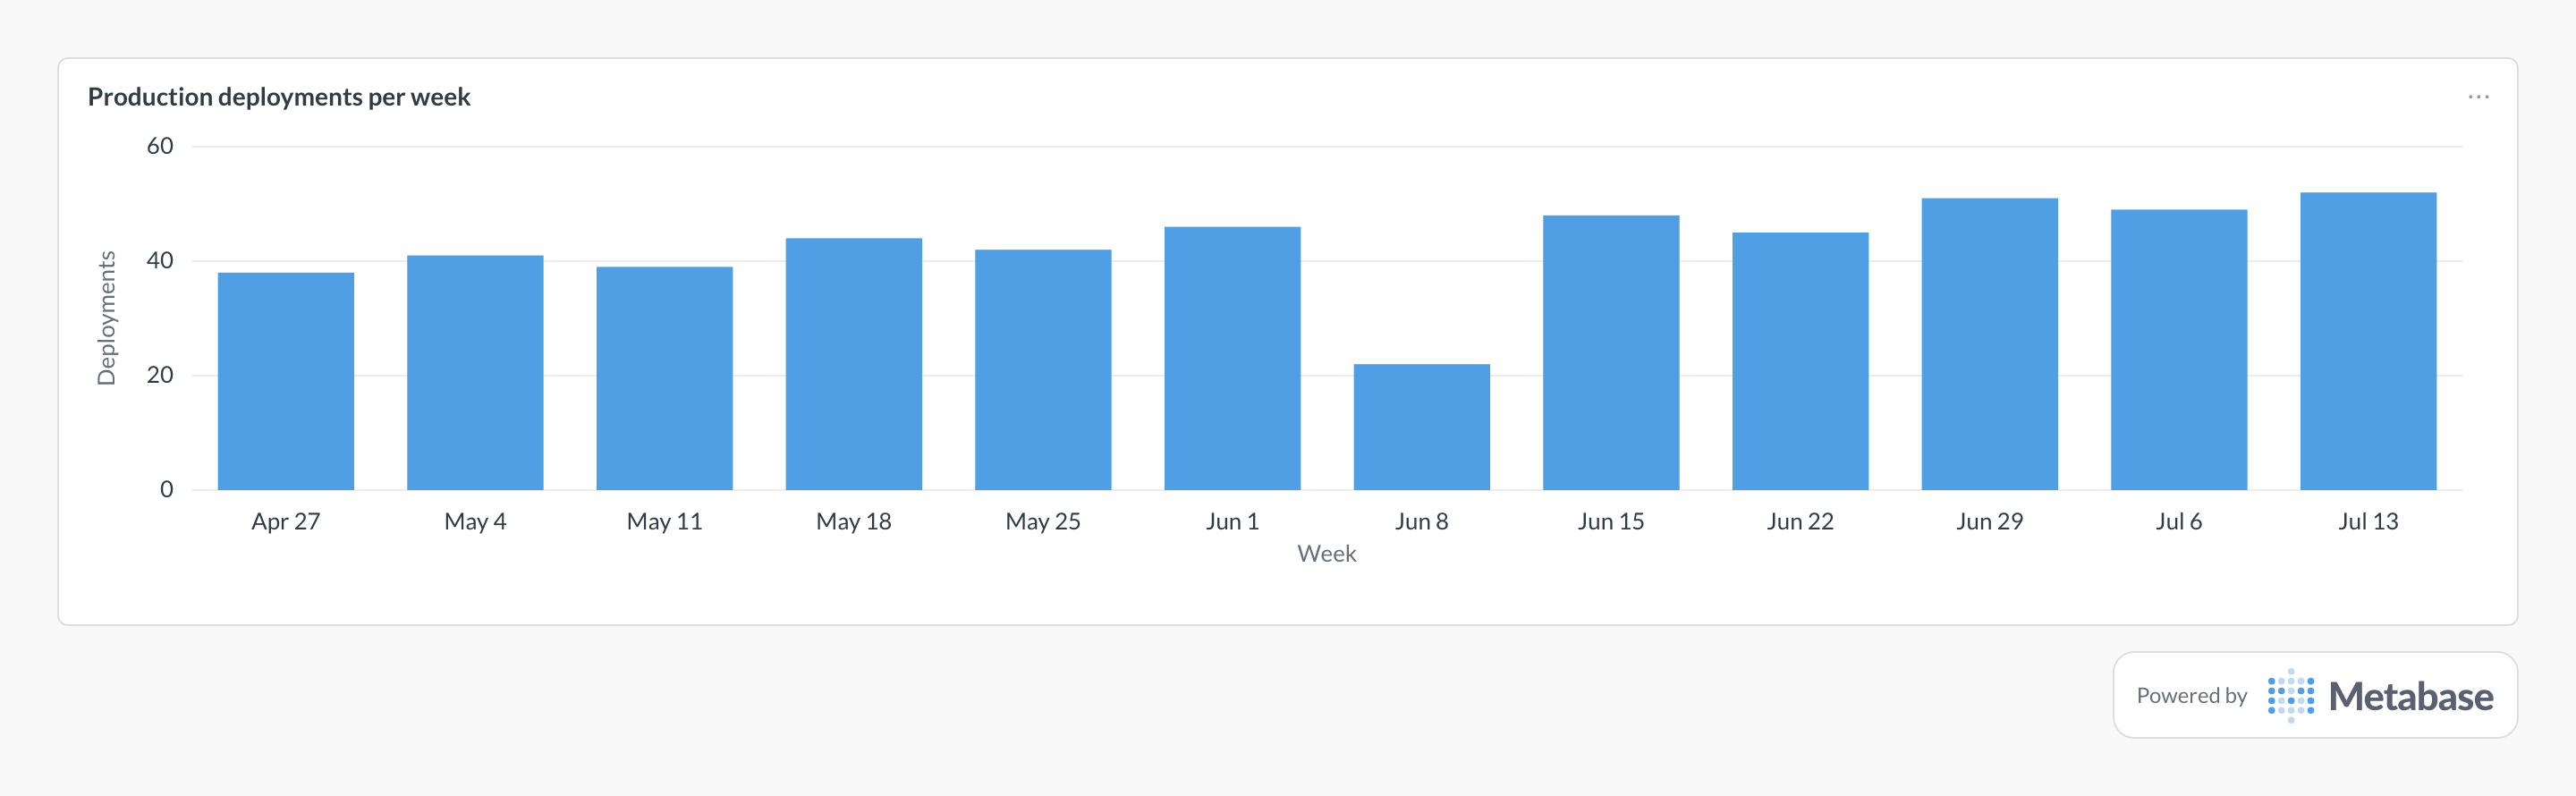
What deployment frequency measures
It counts production releases per day/week, not commits or merges. High, steady frequency usually means small batch sizes and low-risk changes — which correlates with the stability metrics (change failure rate and MTTR) staying healthy.
- Restrict to
environment = 'production'. -
Count only successful deploys (
status = 'success') — failed/rolled-back attempts aren't releases. - Segment by service/repo so a busy monolith doesn't mask quiet services.
What data does it need?
-
A
deploymentstable:environment,status,created_at, andrepository_id/project_id. - GitHub: the Deployments API or Actions deploy workflows. GitLab: environments/deployments from CI/CD pipelines.
SQL patterns
SELECT
  date_trunc('week', created_at) AS week,
  COUNT(*)                       AS deployments,
  COUNT(DISTINCT repository_id)  AS services_deployed
FROM deployments
WHERE environment = 'production'
  AND status = 'success'
GROUP BY 1
ORDER BY 1;SELECT
AVG(daily.deploys) AS avg_deploys_per_day
FROM (
SELECT date_trunc('day', created_at) AS day, COUNT(*) AS deploys
FROM deployments
WHERE environment = 'production' AND status = 'success'
AND created_at >= CURRENT_DATE - INTERVAL '28 days'
GROUP BY 1
) daily;Pitfalls
main is not a production release; join to real deploys.
Where this metric applies
- GitHub + Metabase — Deployments API or Actions deploy workflows
- GitLab + Metabase — environments and deployment records from pipelines
Related
Metrics
Integrations
Dashboards
Terms
FAQ
How do you calculate deployment frequency?
environment = 'production' and status = 'success', then group by day or week. A merged PR or a green CI run is not a deployment — anchor to real release events from GitHub Deployments/Actions or GitLab environments. Segment by service or repo so a busy monolith doesn't mask quiet services. The SQL patterns above show a weekly count and a trailing 28-day per-day average.Is deployment frequency the same as release frequency?
Per day or per week?
We deploy continuously — what do we count?
How do you track deployment frequency in Metabase?
deployments table with environment, status, timestamp, and repository, and define the count once as a saved question grouped by week. Put it on a software delivery dashboard next to the other DORA metrics so throughput and stability are always read together.