15 min read
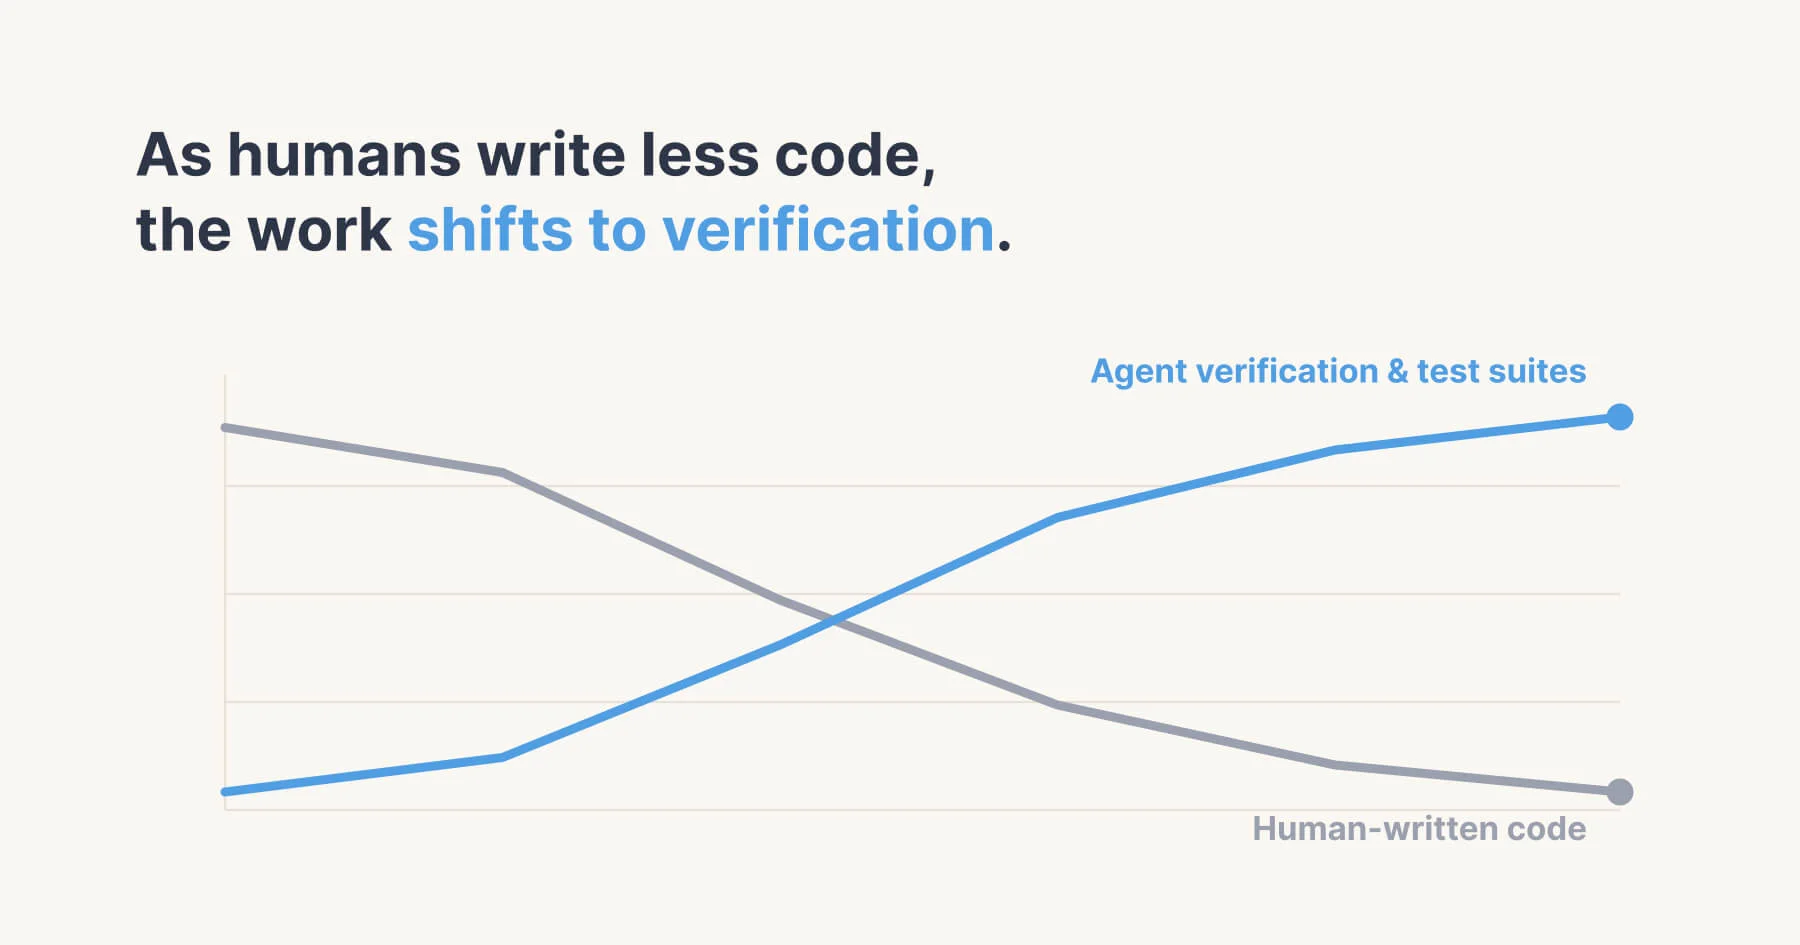
Analysts, analytics engineers, and even business users are writing less SQL and Python by hand. They prompt an agent instead, and with the right context (data models, docs, a data catalog), the agent writes a decent query. Think of a BI tool shifting left and democratizing new context from data models and sources. This helps the agents better understand the business problem and write a more accurate SQL query.
With more advanced tooling that automatically reviews or generates queries iteratively, the agents’ output gets higher in quality every time. The models get better, and we can add additional documentation from internal Confluence pages or data catalogs, and it will get even better.
When using Generative AI for BI tools, we need better ways to verify the underlying foundation for a dashboard. But how? What we need next are linters and a compiler-like style that AI-lints everything before running, and then integrated test suites that get better and better. Basically, back to Test-Driven Development: prompting the tests first, so we assert what we want to build.
As models get better, iterative test suites get better too, and with it, we get better verification. But still, in verification lies the liability today with agentic engineering work, and that’s what we talk about in this article: helping data analysts and domain experts develop more meaningful data work for the organization.
We need to move all logic into one place, to go from a stack of components to one optimized for human ergonomics. We need new ways to make this human-friendly, a new architecture even, a unified lineage tree. This article explores current challenges in BI from first principles, analyses what has worked so far, what no longer does, and how we could improve the architecture to better prevent errors.
📝 People already feel this
In a Metabase survey run during AI analytics week, 74% of teams were building with AI, and only 2% were scaling it. The bottleneck has moved from creating analysis to checking it.
Take the AI readiness quiz to find out where your team stands
So the first question is, what do we need to verify? What’s an iterative test suite?
If it comes down to verifying metrics and KPIs, it’s all math. The retention KPI is built in code, defined in SQL. It’s math. Agents will eventually generate the right test suite to verify the retention KPI, based on 1000s of test cases, Sameer Al-Sakran, CEO of Metabase, said. It’s a standard equation: with evals run by a harness (the new Zeitgeist), agents can figure out edge cases.
But then again, you also need human verification. Sameer said:
Business people are the best data contracts, they know when something doesn’t make sense, they know the numbers. Plus they feel it in their subconscious.
It’s an intuition they gained with years of experience, knowing what the numbers should be in what case. So the test suite can be initiated at the beginning, iterated and improved, but the human adds their intuition to the mix.
Frameworks like Superpowers ask and question the human along the way, and Ponytail pushes the agent to write less code in the first place.
For testing across the data stack, we need system-wide tests, and tests that run on different levels. Below are five different hierarchies for better quality testing:
Linting: Statically analyses our development code and our aggregations without running them, and gives real-time diagnostics of our metrics and configs with type checks and contract conformance.
Compiler: A whole-tree check that resolves and type-checks the full lineage tree before deploying and running on an environment, refusing to build what doesn’t fit together.
Unit Test: Tests small functions and components of the full system, each time we change something. Value assertions and calibration thresholds against known inputs live here.
Integration Tests: Similar to unit tests, but we test multiple parts of the system, modules or components as a group to verify interactions.
End-to-End Tests: Run the compiled system with dedicated seeds of data sets and check the outputs end-to-end.
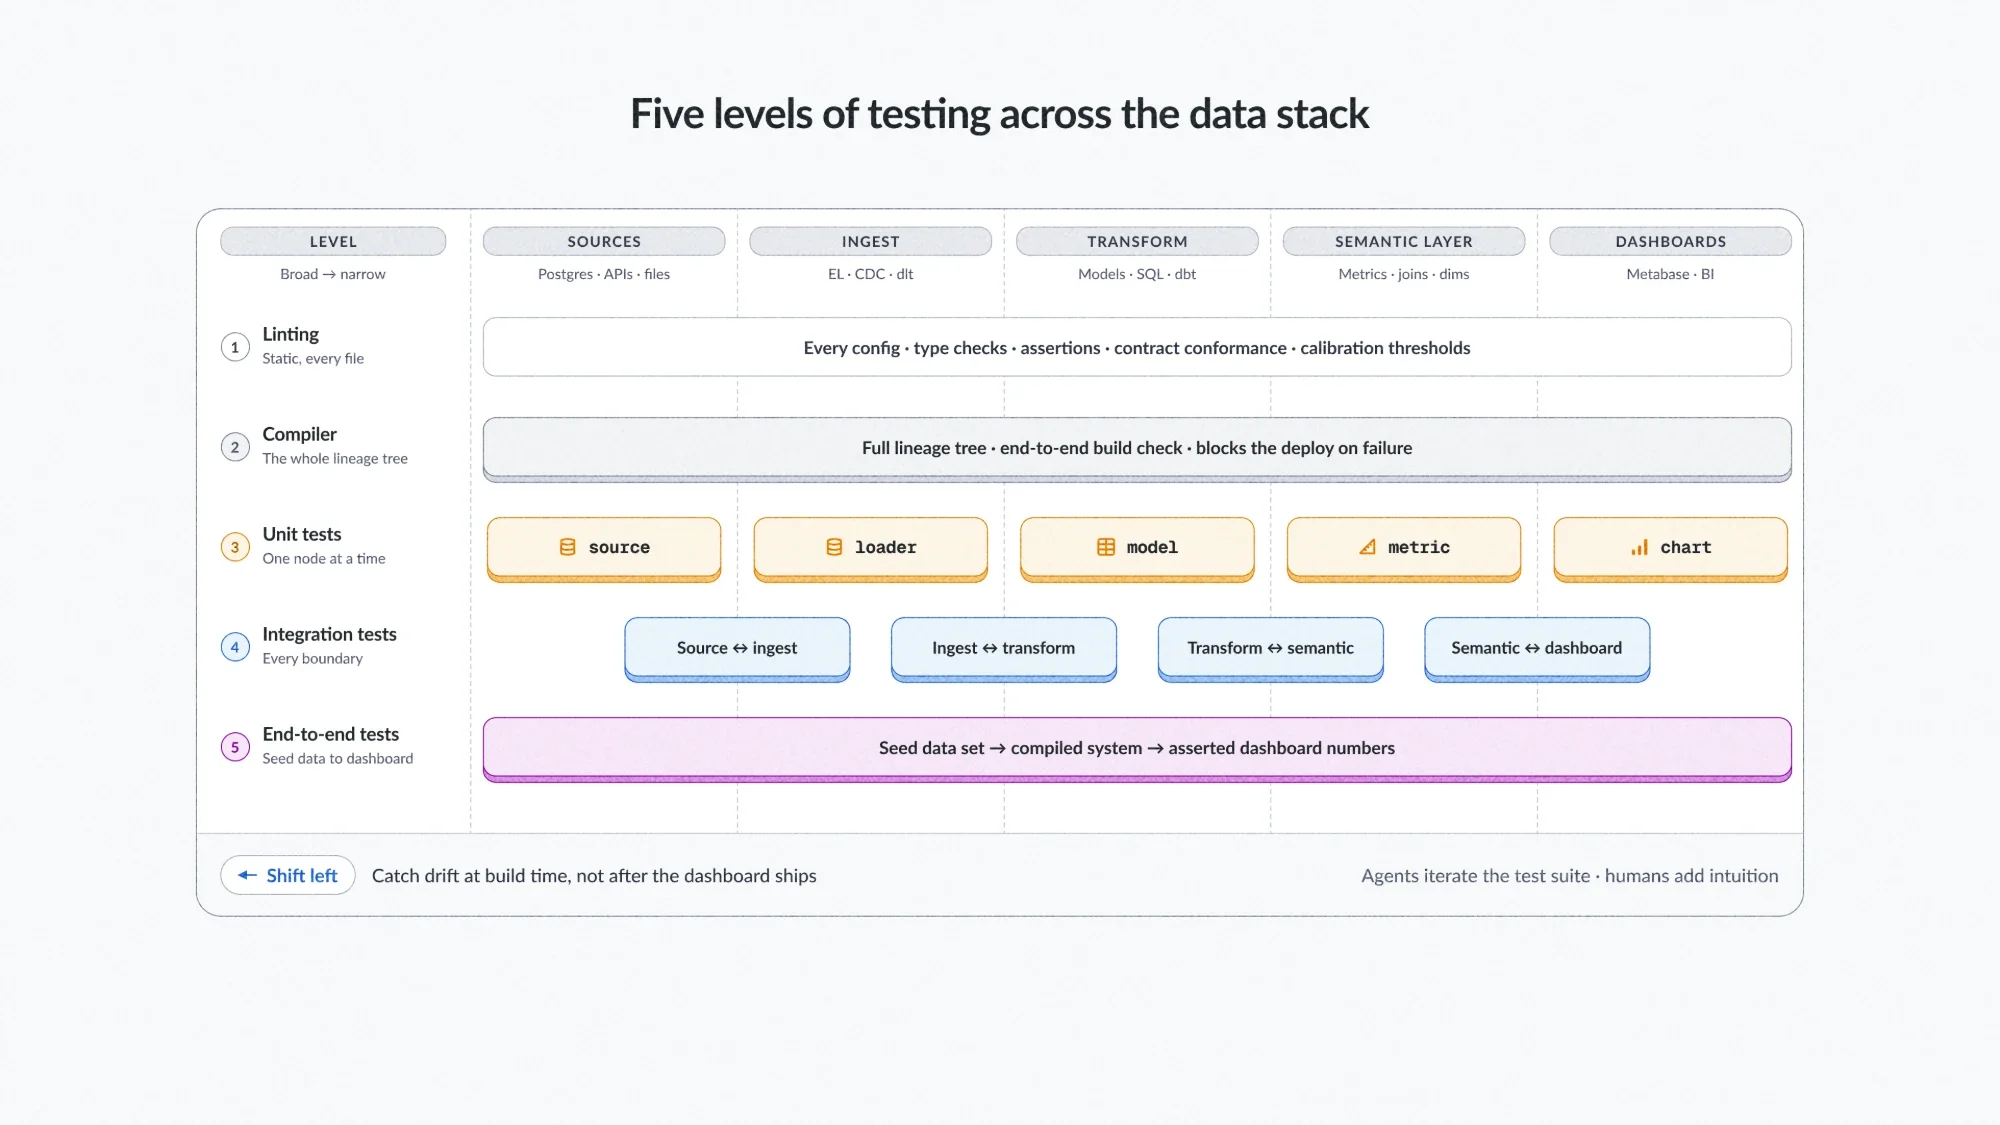
If we add them all together, we could have thorough and well-tested KPIs for business analytics and the data stack, from start to end, with the power of the latest agentic engineering, but also a touch of human intervention and intuition.
ℹ️ A single test score to represent data quality?
The ultimate goal would be to have a single test score that gives you an indication of how good data quality, ETL, the aggregations and dashboards are, but that’s really hard to do. Again, this is where the test suite makes more sense. Also, agents are better at testing narrow fields in a broad test suite.
One git repository, one mono repository, one commit hash, one change across all metrics, dashboards and ETL load. Quite similar to what I was writing about a while back, the “Declarative Data Stack”, expressing the full data stack as a single function.
It’s precise, and a declarative config such as a function, e.g. run_stack(serve(transform(ingest))), can recreate the entire data stack.
For our purpose, we want to have better verification, which helps with that too. The logic (metrics, dashboard, ETL) is stored in a standardized way, agents can create test suites on top of it, and we can iterate fast. We can’t verify logic in four different databases and git repos. Bringing it together into one declarative place will avoid this.
In the end, metric definitions, segments, transformation, aggregation, all of it results in a dashboard. We go from source to visualization. It’s a full-stack data engineering platform, from transformation, semantic layer, actual computation to dashboard and data app.
Besides having the code and configuration in one place, having different formats or syntax is okay these days. dbt models are Jinja-templated SQL in each warehouse’s dialect, Metabase has native SQL and its own query language (MBQL), and Looker has LookML. Translating between them can increasingly be done by an agent, and verified with a compiler or inspection tools.
That means we have less lock-in to proprietary syntax than before, though formats like LookML and MBQL are still proprietary.
We need a system that focuses on human productivity by fitting into our workflow like macros in dbt or LookML functions. In programming, we also started with Assembly, then moved up to higher-level languages like FORTRAN and C, then to object-oriented languages like Smalltalk, and now we have all the programming languages. Now we have evolved even further, so we can just instruct in natural language.
We went up the stack, it’s a different optimization level when we don’t need to write Assembly anymore. Sure, sometimes it’s still beneficial to write in Assembly, if you need to have full control over everything, making it super performant, but sometimes we also just need a setup that helps us get the job done. For BI developers, that’s a reliable system that supports us with agentic work whenever possible, but still with the human ergonomics and productivity in mind—e.g. producing more is not better, but higher quality and correct metrics are.
We want the ability to verify. Some companies have rewritten their core as notebooks were unusable: state was not clearly managed, variables ran out of order or were reassigned, and it was hard to understand which code block created which datasets. That is where, in a BI tool, the connection between a metric and the compute engine becomes essential: the better integrated, the less drift we have from definition to data sets.
This idea is older than BI. Donald Knuth’s Literate Programming (1984) treats the computer program more like an essay explaining the reasoning, with the code as illustration. One tool produces the tangled version the machine runs, and another produces the woven version the human reads. Meaning and implementation can’t drift apart, because they’re the same document.
Apply that to a metric (and its contracts), and you get what this article is about, with humans writing less code: a definition that says what a metric means, and the code that computes it, kept in one place and checked against each other.
📝 The P versus NP problem, in reverse
The P versus NP problem is a major unsolved problem in theoretical computer science. Informally, it asks whether every problem whose solution can be quickly verified can also be quickly solved. For NP problems, checking is the easy part and finding the answer may be hard.
Agentic BI has the reverse asymmetry: an agent can produce a metric or dashboard cheaply, but checking that it’s correct is the hard, expensive part, which is why we invest so much in the verification layer.
For bringing the test suite into an integrated place, I was tinkering with the idea of creating a unified computational graph that represents the full state from ingestion to dashboard.
When I discussed this with Sameer, he pointed out that it has no cycles and is hierarchical: a DAG that goes down level by level into its sub-DAGs. It isn’t a strict tree, since any join gives a model more than one parent, but it reads top-down like one. That’s what I mean by “lineage tree”, or “hierarchical lineage DAG”, in this article:
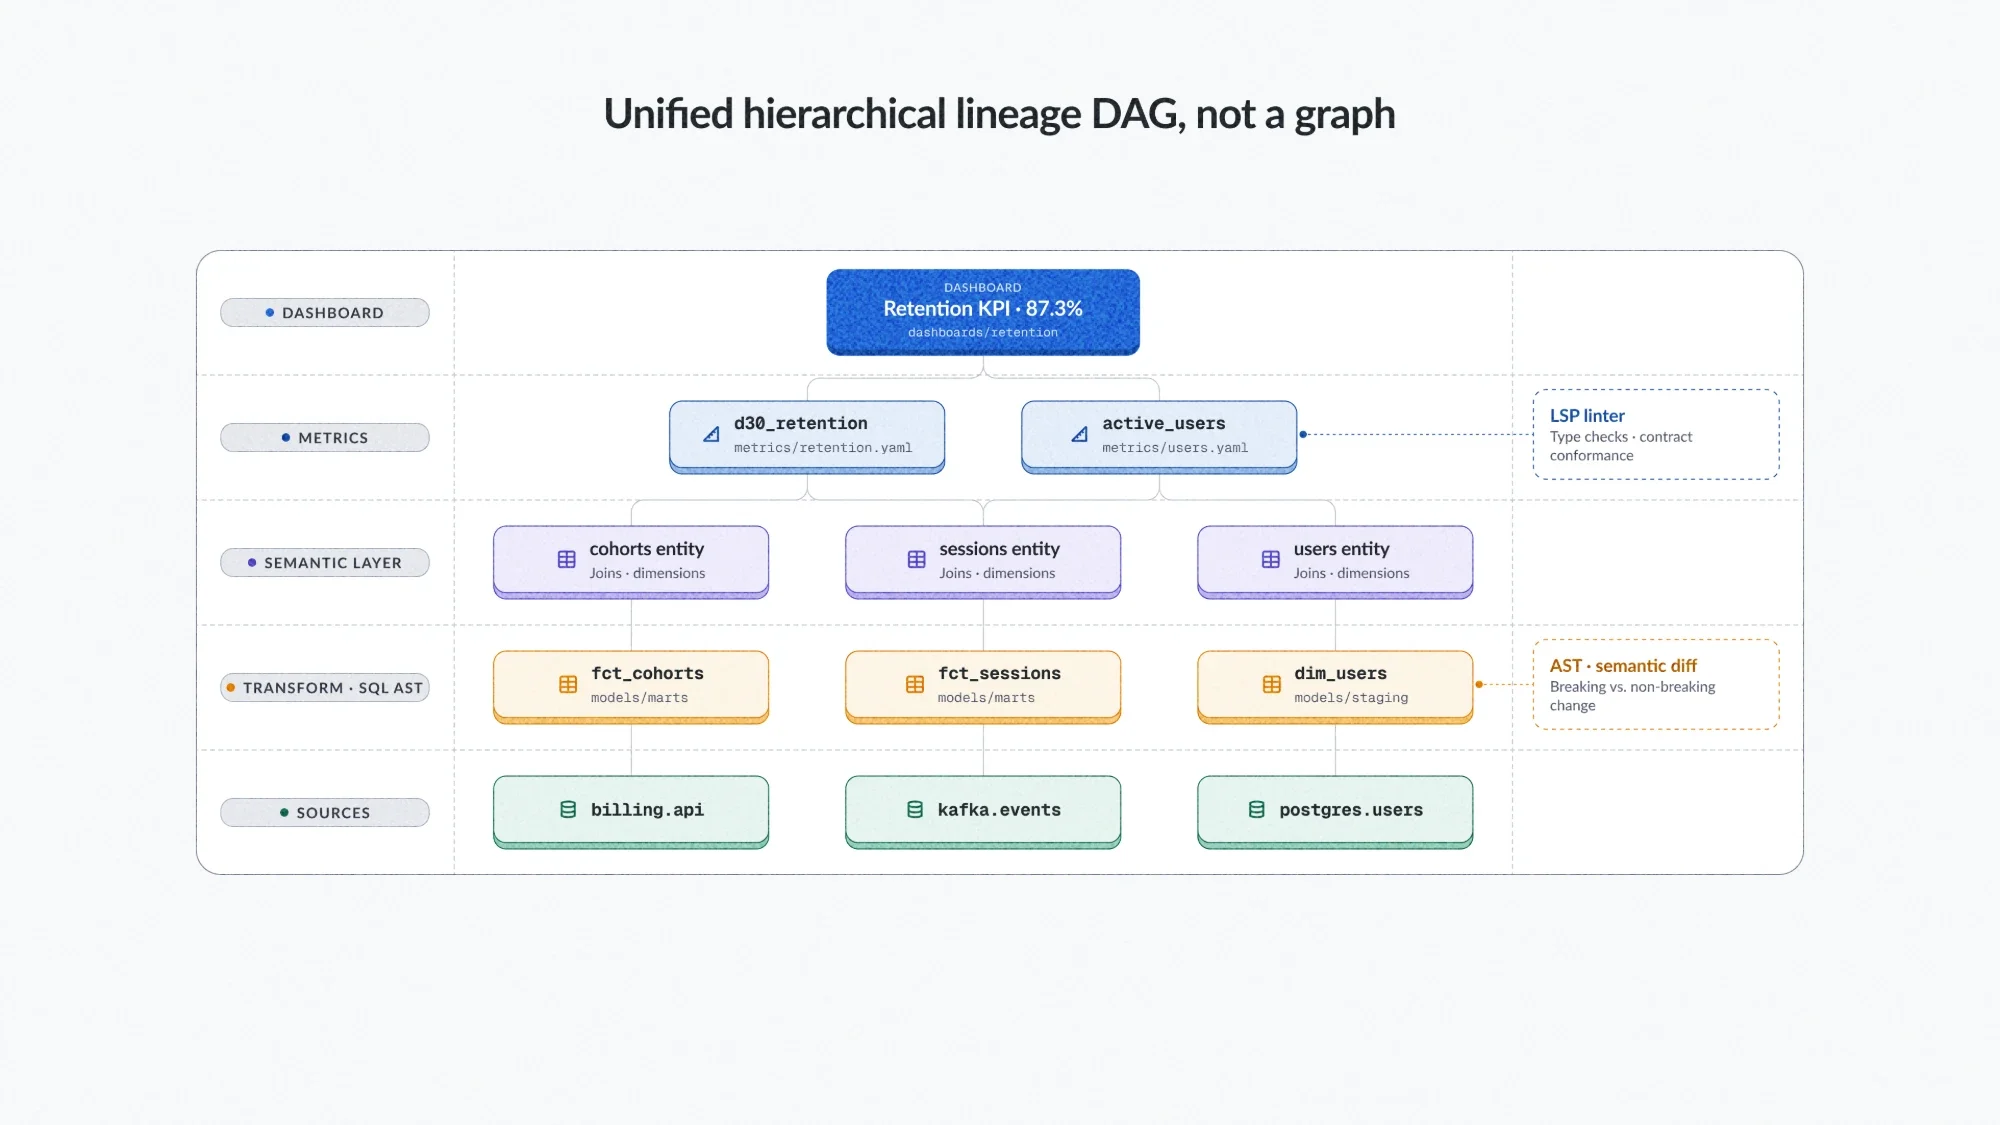
For the linting part, we can use something called an Abstract Syntax Tree (AST). It’s a data structure that represents the structure of a program or code snippet. It is a tree representation of the abstract syntactic structure of text written in a formal language. There’s also a SQL AST specifically, and tools like SQLMesh and most parsers in BI tools make heavy use of them. E.g. the Virtual Data Environments feature, which detects modifications and automatically categorizes the impact of breaking or non-breaking changes, is heavily reliant on ASTs.
This is possible due to the platform’s ability to understand SQL semantically, at the AST level. By comparing the current model version with the previous one we’re able to compute a semantic diff, which SQLMesh further analyzes to understand the impacts it would have on downstream models.
So with such techniques, and advanced knowledge about the configuration of the full system, adding SQL transpilation and LSP (Language Server Protocol) linters to the mix, we have a pretty strong lineage tree that can help us make verification up-to-date for the new AI age, and allow faster iterations.
📝 The Modern Data Graph?
Stephen Bailey, in The Modern Data Graph, reframes a16z’s “unified data infrastructure” from a stack into a graph: while there is an overall left-to-right flow from data sources to output systems, there is a hub of interchange around the warehouse and storage. You could get rid of almost all other nodes and still have a platform that sustains the workloads.
Its role is “transferring knowledge so humans can use it”: the data graph supports the system graph, which supports the human graph. His distinction between systems that operate within the graph (defined edges, inside boxes) and those that work on it (unboxed) maps neatly onto the two things we need to verify: the state at rest in the warehouse hub, and the declarations, the edges of transformations, metrics, and joins that produce it.
One element of the equation we can’t leave out is the state of a system, and even more the state itself, the customers or our data.
For the system state, Sameer says:
State is the enemy: the more mutable state there is in a system, the less you trust the output.
The problem is mutable state. Planning should happen against fixed, known state: a test data set, a seed of data where you know the expected outcome. Without that fixed reference, verification is just guessing. This is the idea behind Transform tests in Metabase (upcoming in v65): known input rows, expected output, and a rollback after each run.
Usually, state is especially relevant when we deploy the system’s data stack, e.g. visible in DevOps approaches with Kubernetes, where we need to deploy to different environments (dev, test, prod) and conserve state and relevant data for our data stack if we upgrade software or configurations.
The last question is, when do we actually do the verification? During development, like a compiler that checks at the end of the development cycle, once we have defined metrics, and blocks and refuses to run anything?
Or better, like a linter that constantly shows us warnings and errors while we develop? Both are possible, depending on how rigid we want it to be.
Timing-wise, as early as possible is best. During development, before production, as verification during runtime is already well covered by orchestrators and integrated data quality tools. Again, the more we shift left, the better.
But how do we know if measures and KPIs are verified, or tested well? What’s important is a good data set and test suite that improves the data quality, the tests, and also the business quality. We need to measure the “Goodness of data.”
With an all-encompassing hierarchical lineage DAG that knows the business logic better than existing BI tools, we can use the declarative metrics, unit test them so they declare an outcome, build a compiler that does built-in assertions, and develop assertion programming. Today, most data checks — dbt data tests, Airflow checks, Snowflake data metric functions — run after the data is computed; they’re runtime checks. dbt has started moving left: since v1.8, unit tests check model logic on static inputs before materialization, and model contracts are enforced at build time. We need to take that further and shift assertions left across the whole stack, surfaced by a linter while the metric is being written, and enforced at build time before the pipeline runs.
Avoid a definition drifting from its original definition by unit testing configuration against a large test suite and human intuition. Most BI drift today comes from the opposite arrangement: the dashboard built ad-hoc once with manual tests, and not touched after—drifting away.
The outcome is a system of components optimized for tests and good data quality, allowing fast iteration with high confidence and control.
Think of it like the Developer Tools in Chrome: one pane, full context, everything traceable from the rendered element back through the DOM, styles and network requests. That’s what we’re missing for data. A single interface where you can follow a number on a dashboard all the way back through metrics, semantic layer, transformations, and raw source—without switching tools or asking five people in the first place.
💡 Slow down
Mario Zechner, creator of Pi, calls for building “modular” systems in Building pi in a World of Slop. He also says: slow down, learn to say no.
We covered a lot: why verification is the new liability in an agentic BI stack, why we need test suites at five hierarchy levels (linting, compiler, unit, integration, end-to-end), why moving all logic into one declarative place helps with verification compared to having spread-out components, and why a unified hierarchical lineage DAG, built on ASTs, semantic diffs, and LSP-style linters, solves part of the linting and verification. We also looked at why state is the enemy of trust, and why assertions need to shift left from runtime checks to build-time guarantees.
But there are still open questions. How do we run tests deterministically and reliably? How do we write a “verification rule engine”? How do we actually create the unified hierarchical lineage DAG, compute the full hierarchy before runtime, and potentially compile it into a binary that runs fast, even on the web? And do LLMs help us with verifying?
This is where the thinking behind Data Studio in Metabase is heading. Transforms, metrics and dashboards live in one place. Dependency tracking shows what depends on what, so you can see what a change will break before you ship it. Remote sync lets you version all of it in Git. It isn’t yet the full linter for data described here, but it’s the foundation with all the logic in one place, with a lineage dependency graph, transformations and reusable metrics.