Metabase makes it easy for everyone to build a dashboard for IT Risk.
A dashboard for IT teams to measure risk and potential issues within IT infrastructure and applications.
Get Started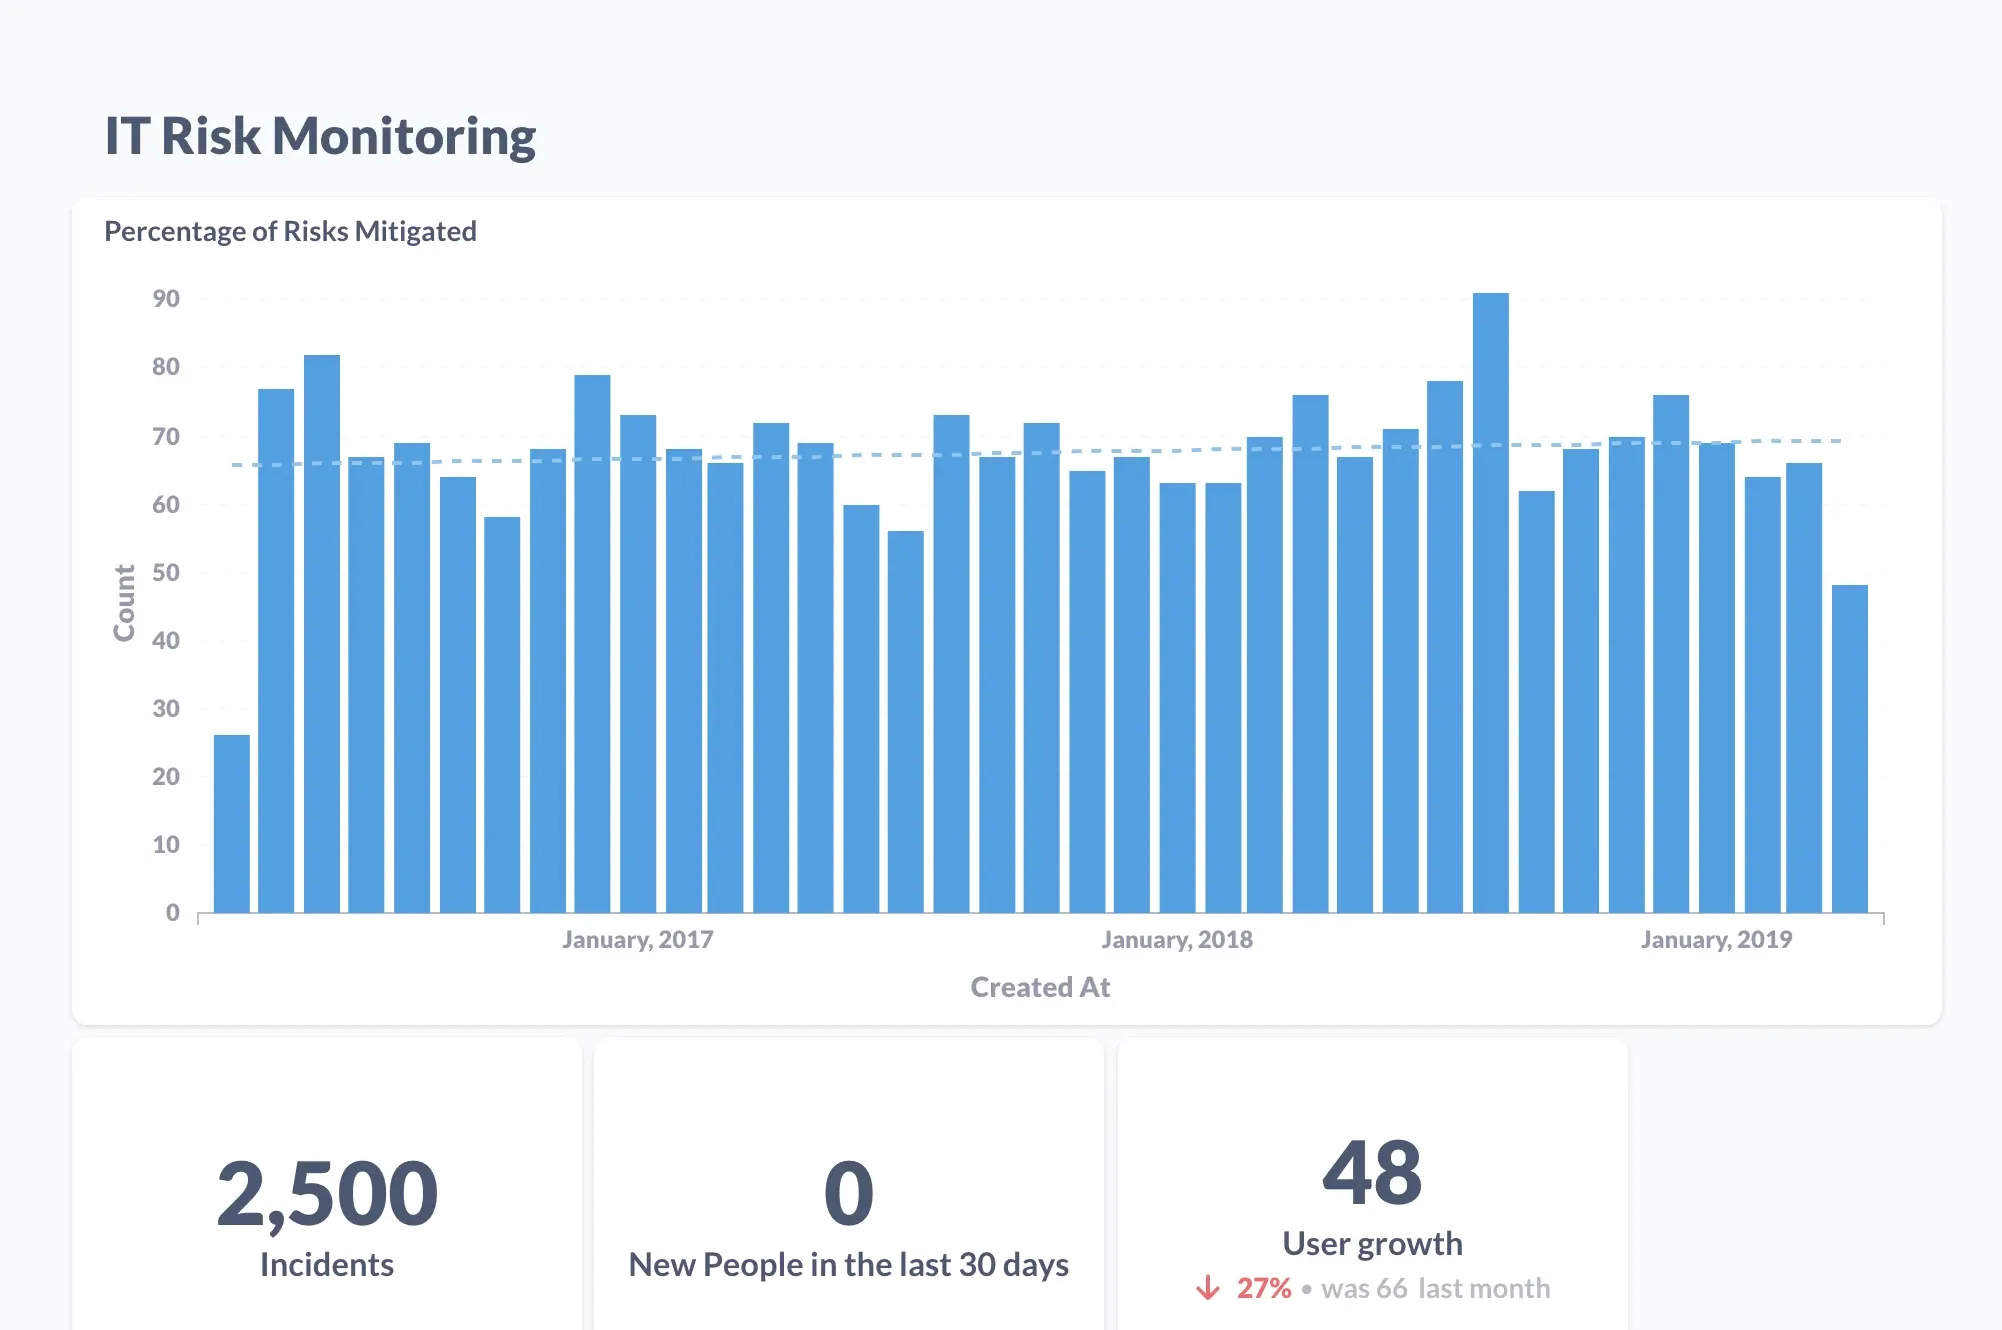
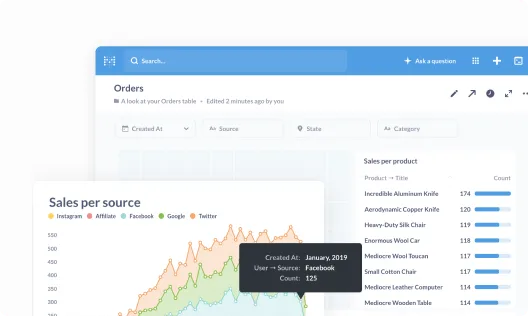
Get everyone on the same page by collecting your most important metrics into a single view.
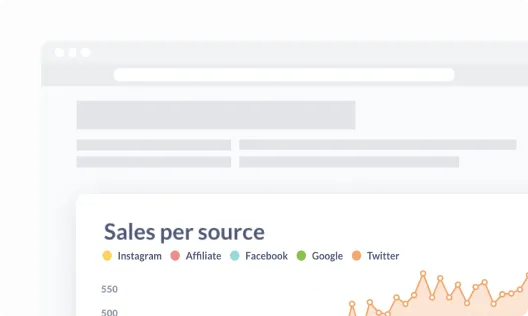
Take your data wherever it needs to go by embedding it in your internal wikis, websites, and content.
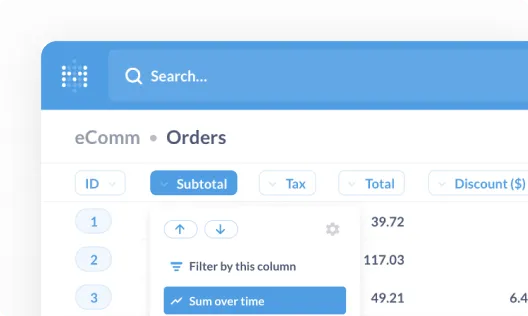
Empower your team to measure their own progress and explore new paths to achieve their goals.
Every team is different, but sometimes it helps to start with some examples. Here are our top 8 IT Risk metrics to start tracking on your dashboards.
An IT risk dashboard tracks the risks you’ve identified, the ones that actually materialized, and what managing them costs — so exposure stays visible instead of buried in a register. These are the metrics worth tracking on it.

That's right, no sales calls necessary—just sign up, and get running in under 5 minutes.

We connect to the most popular production databases and data warehouses.
Invite your team and start building dashboards—no SQL required.


