




What is uptime, and how do you measure it in Metabase?
Uptime is the percentage of time a service was up over a window — the time-based reliability number that ends up in SLAs, status pages, and board decks. Its real value is as a budget: 99.9% is 43.8 downtime minutes a month to spend. Measure it in Metabase from synthetic check results synced from UptimeRobot, Better Stack, or Checkly.
What does an uptime chart look like in Metabase?
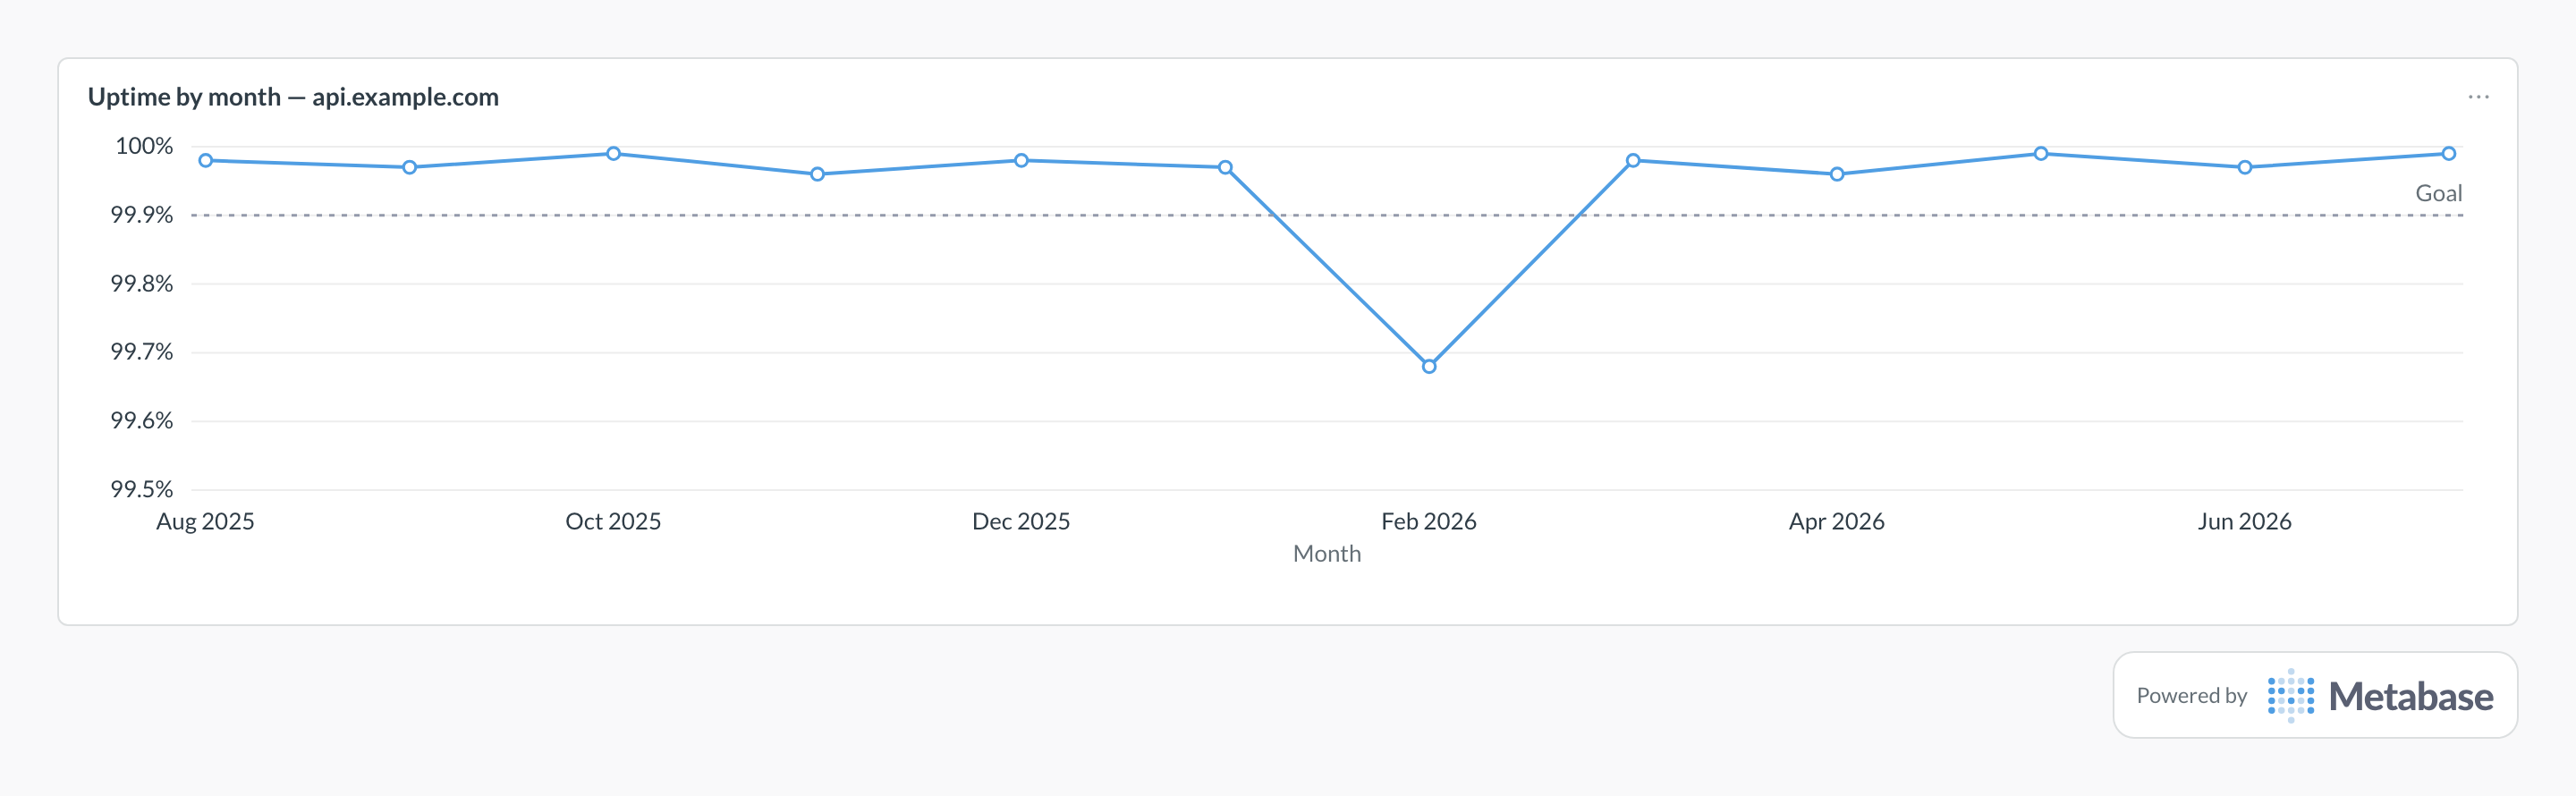
Chart one monitor's uptime per month as a line with the SLA target as the goal line, and lift the axis floor into the nines — on a 0–100 scale every month is an indistinguishable flat line at the top. Most months sit just above target, and a dip like February's below the goal line is one incident spending far more than that month's 43.8-minute budget.
What uptime measures
It measures the share of the window during which the service answered — and, read as a budget, how much downtime you have left before breaking a promise. The nines translate to fixed allowances: 99.5% is about 3.6 hours a month, 99.9% is 43.8 minutes, 99.99% is 4.4 minutes. That translation is what makes uptime the executive metric: a single number per service per month, comparable across quarters, with an explicit rule for whether announced maintenance windows count. Probes tell you the service was reachable; whether individual requests succeeded is availability's job.
What data does it need?
-
A
check_resultstable:monitor_name,checked_at,is_up, and anis_maintenance_windowflag — one row per synthetic check at a constant interval. -
An
incidentstable withstarted_at/resolved_atand aplanned_maintenanceflag, for minute-accurate downtime per outage. - Source: UptimeRobot, Better Stack, or Checkly check exports via Airbyte or the warehouse; Prometheus blackbox-exporter probe results work too.
SQL patterns
SELECT
  monitor_name,
  date_trunc('month', checked_at) AS month,
  ROUND(
    100.0 * COUNT(*) FILTER (WHERE is_up)
    / NULLIF(COUNT(*), 0), 3
  ) AS uptime_pct,
  COUNT(*) FILTER (WHERE NOT is_up) AS failed_checks
FROM check_results
WHERE NOT is_maintenance_window
GROUP BY 1, 2
ORDER BY 1, 2;SELECT
i.incident_key,
i.service_name,
i.severity,
ROUND(
EXTRACT(EPOCH FROM (i.resolved_at - i.started_at)) / 60
) AS downtime_minutes,
COUNT(c.checked_at) FILTER (WHERE NOT c.is_up) AS failed_checks
FROM incidents i
LEFT JOIN check_results c
ON c.monitor_name = i.service_name
AND c.checked_at BETWEEN i.started_at AND i.resolved_at
WHERE i.resolved_at IS NOT NULL
AND NOT i.planned_maintenance
AND i.started_at >= CURRENT_DATE - INTERVAL '90 days'
GROUP BY 1, 2, 3, i.started_at, i.resolved_at
ORDER BY downtime_minutes DESC;Pitfalls
Where this metric applies
- UptimeRobot + Metabase — monitor check results and downtime logs
- Better Stack + Metabase — uptime checks with incident context
- Checkly + Metabase — API and browser check results
- Prometheus + Metabase — blackbox-exporter probe successes per target
Related
Metrics
Dashboards
FAQ
What does 99.9% uptime actually allow?
Is uptime the same as availability?
Should planned maintenance count against uptime?
is_maintenance_window column in check_results, publish both the raw and adjusted numbers on the uptime dashboard, and let the incident count catch "maintenance" that was really an outage with a calendar invite.How do you calculate uptime percentage?
COUNT(*) FILTER (WHERE is_up) / COUNT(*) per monitor per month approximates it well when the check interval is constant. For minute-accurate math, sum incident durations instead — total minutes minus downtime minutes, divided by total minutes. Always attach the window: 99.9% over a day, a month, and a year are three different promises, and monthly is the usual reporting grain because it matches SLA credit periods.How do you track uptime in Metabase?
monitor_name, checked_at, is_up, and a maintenance flag, chart monthly uptime per monitor, and pair it with downtime minutes per incident so the percentage and the human-time cost sit on the same uptime dashboard. It slots into the broader observability analytics stack alongside availability and SLO views.