




What is MTBF, and how do you measure it in Metabase?
MTBF — mean time between failures — is the average operating time between one failure and the next: total uptime divided by the number of failures. It's the failure-frequency half of reliability, paired with MTTR as the recovery half. Measure it in Metabase from incident records synced from PagerDuty, incident.io, or Datadog.
What does an MTBF chart look like in Metabase?
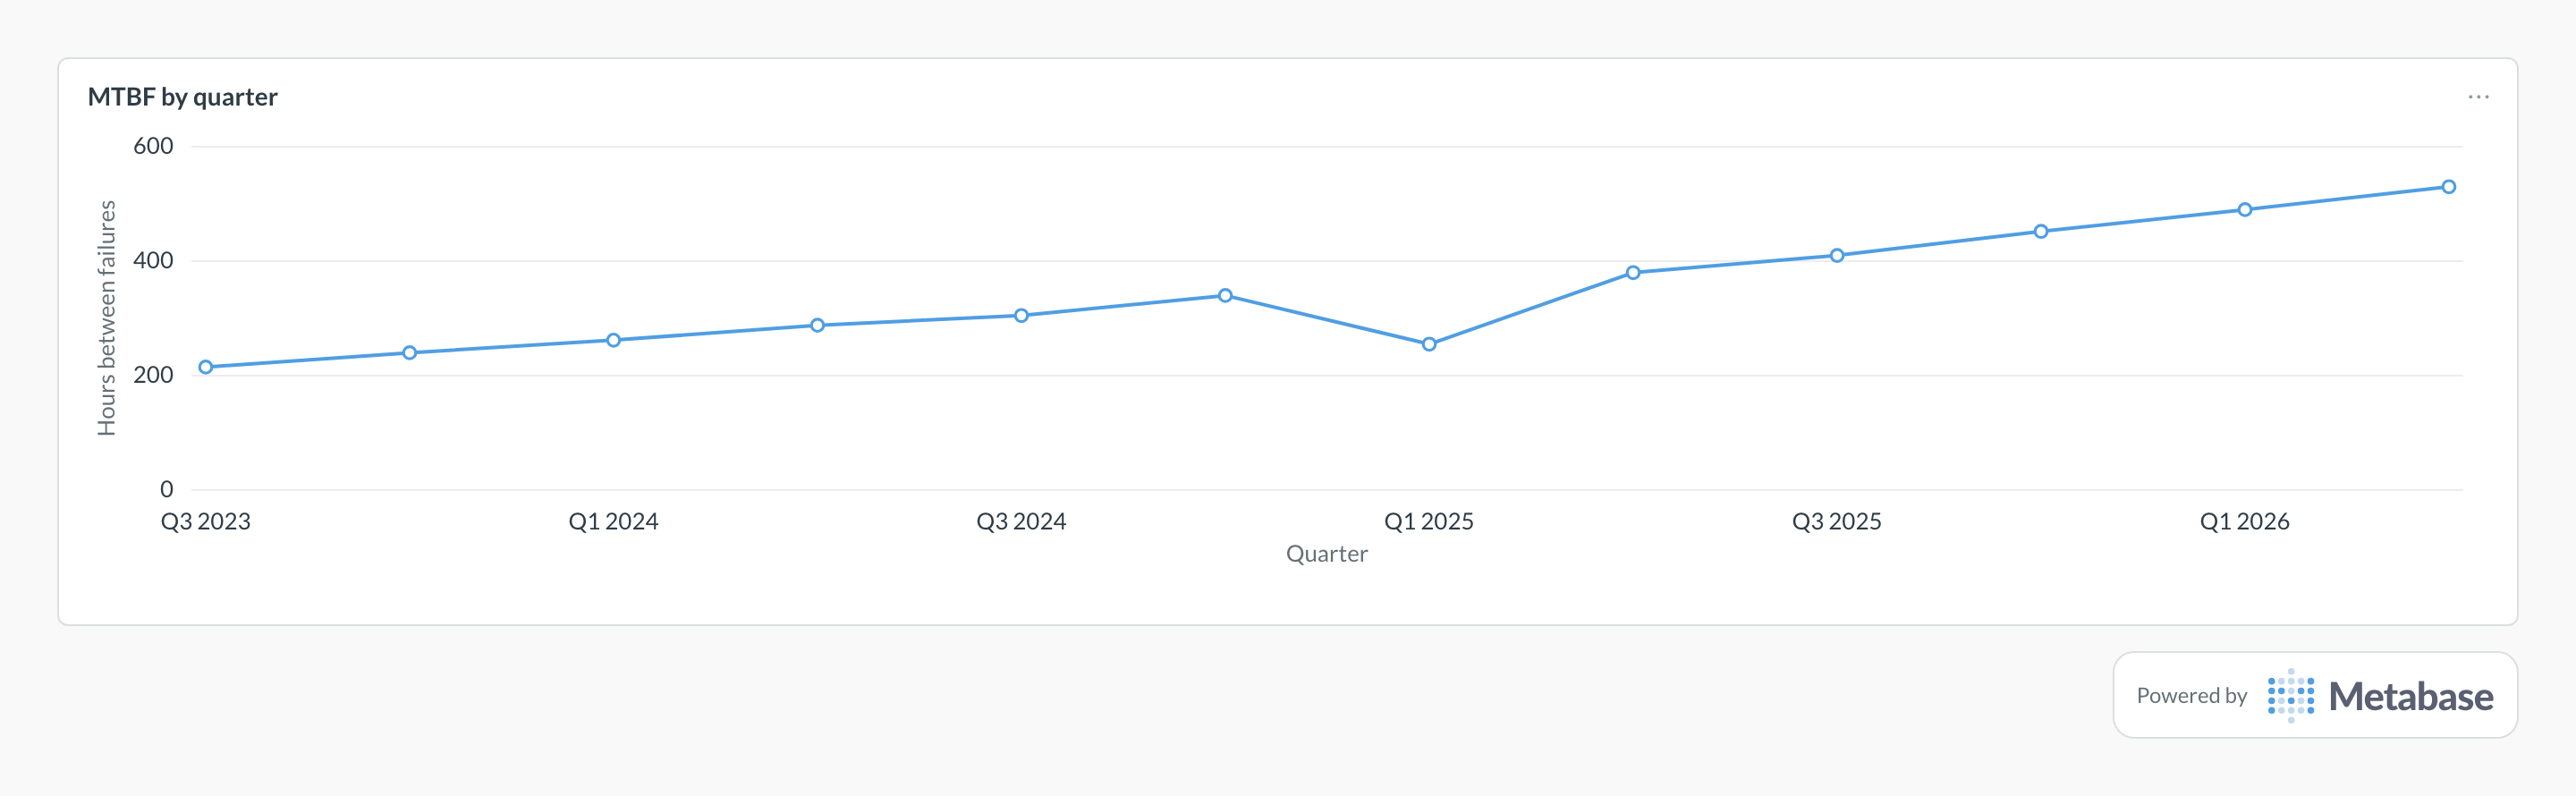
Chart MTBF per quarter as a line: a climbing series means the quiet stretches between Sev-1/Sev-2 incidents are getting longer. A down quarter like Q1 2025's is often just one incident cluster in a small sample — read it next to the failure count before calling it a reliability regression.
What MTBF measures
It measures how long a service runs before something breaks — failure frequency expressed as operating time. That makes it the complement of response metrics: MTTD and MTTA measure how fast you notice and respond, MTTR how fast you recover, and MTBF how long the peace lasts. Because availability ≈ MTBF ÷ (MTBF + MTTR), a service with a 30-day MTBF and a 1-hour MTTR sits at roughly 99.86% — and the decomposition shows whether the next point of availability comes cheaper from preventing failures or shortening them.
What data does it need?
-
An
incidentstable:started_at,resolved_at,service_name,severity,environment. - A written failure definition — typically Sev-1/Sev-2 in production — applied as a filter in the model, consistent with incident count.
- Source: PagerDuty, incident.io, or Datadog incident exports via Airbyte or scheduled syncs into the warehouse.
SQL patterns
WITH gaps AS (
  SELECT
    service_name,
    started_at,
    started_at - LAG(started_at) OVER (
      PARTITION BY service_name ORDER BY started_at
    ) AS gap
  FROM incidents
  WHERE environment = 'production'
    AND severity IN ('sev1', 'sev2')
)
SELECT
  service_name,
  date_trunc('quarter', started_at) AS quarter,
  COUNT(gap) AS failure_gaps,
  AVG(EXTRACT(EPOCH FROM gap)) / 3600 AS mtbf_hours,
  percentile_cont(0.5) WITHIN GROUP (
    ORDER BY EXTRACT(EPOCH FROM gap)
  ) / 3600 AS median_between_failures_hours
FROM gaps
WHERE gap IS NOT NULL
GROUP BY 1, 2
ORDER BY 1, 2;WITH rollup AS (
SELECT
service_name,
COUNT(*) AS failures,
SUM(EXTRACT(EPOCH FROM (resolved_at - started_at))) AS downtime_s
FROM incidents
WHERE resolved_at IS NOT NULL
AND environment = 'production'
AND severity IN ('sev1', 'sev2')
AND started_at >= CURRENT_DATE - INTERVAL '90 days'
GROUP BY service_name
)
SELECT
service_name,
failures,
-- 7,776,000 s = the 90-day window
ROUND((7776000 - downtime_s) / failures / 3600) AS mtbf_hours,
ROUND(downtime_s / failures / 60) AS mttr_minutes,
ROUND(100.0 * (7776000 - downtime_s) / 7776000, 3) AS availability_pct
FROM rollup
ORDER BY mtbf_hours ASC;Pitfalls
Where this metric applies
- PagerDuty + Metabase — incident lifecycle timestamps per service
- incident.io + Metabase — structured incidents with severity and timeline
- Datadog + Metabase — incidents joined to monitors and SLOs
- Prometheus + Metabase — alert-derived failure events per service
Related
Metrics
Dashboards
FAQ
What is the difference between MTBF and MTTR?
MTBF or MTTF — which one applies?
What counts as a failure?
Why does our MTBF jump around so much?
How do you track MTBF in Metabase?
started_at, resolved_at, service_name, and severity. Compute gaps between consecutive incident starts with LAG() per service, average them per quarter, and build one rollup that shows MTBF, MTTR, and derived availability side by side. Pin the trend to a MTBF dashboard and the long view to incident response trends.