How to Measure Mean Time Between Failure

Learn about Mean Time Between Failure, including how to measure it, and leverage it in dashboards and visualizations with Metabase.

What is Mean Time Between Failure?

Mean time between failures, or MTBF, is a metric that tells you the average time between software failures. The purpose of this metric is to show you how stable and reliable a product is, and give a piece of insight into performance. If the failures are frequent, it can highlight a need for change. You might notice that although problems that’re coming up aren’t difficult to fix, they’re happening frequently enough to identify a problem. This could be a team efficiency issue, a testing issue, or something else.

Get Started
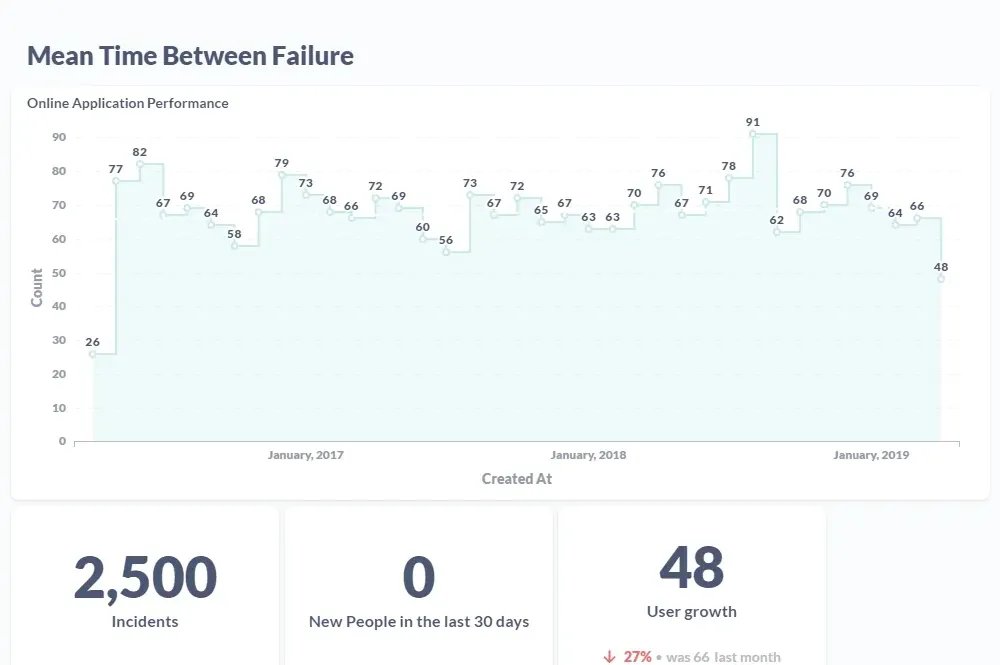
Graphs of Mean Time Between Failure

How to calculate Mean Time Between Failure

To calculate a product’s MTBF, you’ll need to divide the total number of operational hours by the number of failures. For example, if your product has been up and running for a total of 1,000 hours and there were 12 failures, your MTBF would be approximately 84 hours. That means every 84 hours your product is operational an error is more likely to occur.
Other KPIs to measure related to Mean Time Between Failure

  • Online Application Performance — response times and throughput as users actually experience them in production.
  • Time to Value — how quickly new customers reach their first meaningful outcome.
  • Build Time — how long builds and CI pipelines take end to end; slow builds drag every feedback loop.
  • Recovery Point Objective — the maximum data loss a recovery can tolerate, measured against actual backup cadence.
  • Downtime — time a service was unavailable per period; the inverse view of uptime.
  • Bug Count — open and net-new bugs over time, segmented by severity and age.
  • Automated Test Pass Percentage — the share of automated test cases that pass per run; a falling trend flags quality debt.
  • Infrastructure Service Value Scores — how much business value each infrastructure service delivers for its cost.
  • Storage Costs — what data storage costs per period, by system and by growth trend.

Why build a dashboard for Mean Time Between Failure?

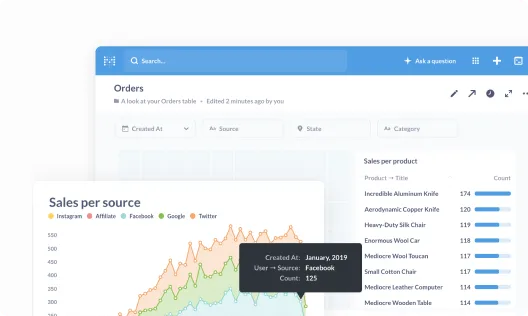
Sales per source graph

Everything in one place

Get everyone on the same page by collecting your most important metrics into a single view.
Sales per source graph

Share your perspective

Take your data wherever it needs to go by embedding it in your internal wikis, websites, and content.
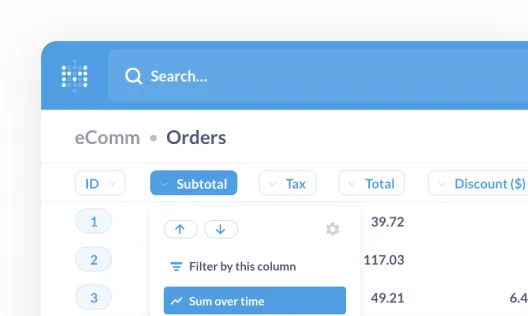
eCommerce orders filter

Unlock exploration

Empower your team to measure their own progress and explore new paths to achieve their goals.

How to use Metabase to measure Mean Time Between Failure

Get started

Step 1.
Skip the custom quote

That's right, no sales calls necessary—just sign up, and get running in under 5 minutes.

types of databases

Step 2.
Plugin your database

We connect to the most popular production databases and data warehouses.
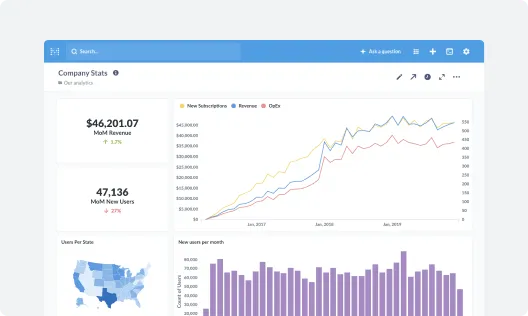
dashboard example

Step 3.
Build your KPI dashboards

Invite your team and start building dashboards—no SQL required.

Get started with Metabase

  • Free, no-commitment trial
  • Easy for everyone—no SQL required
  • Up and running in 5 minutes
