





What does a vulnerability management dashboard show in Metabase?
A vulnerability management dashboard shows open exposure and remediation velocity across every scanner: criticals by asset group, new vs. remediated per week, and SLA compliance by severity. It's built from findings synced from tools such as Tenable, Wiz, Snyk, and Orca Security.
For: security engineers, remediation owners, and CISOs reporting to the board. Grain: one row per open finding per asset.
What does a vulnerability management dashboard look like?
Here’s the layout this guide builds, at the grain of one open finding per asset: total exposure and SLA standing at the top, then where the critical and high findings sit by asset group and team, then remediation velocity and the assets that keep failing. Read it in the weekly remediation review.
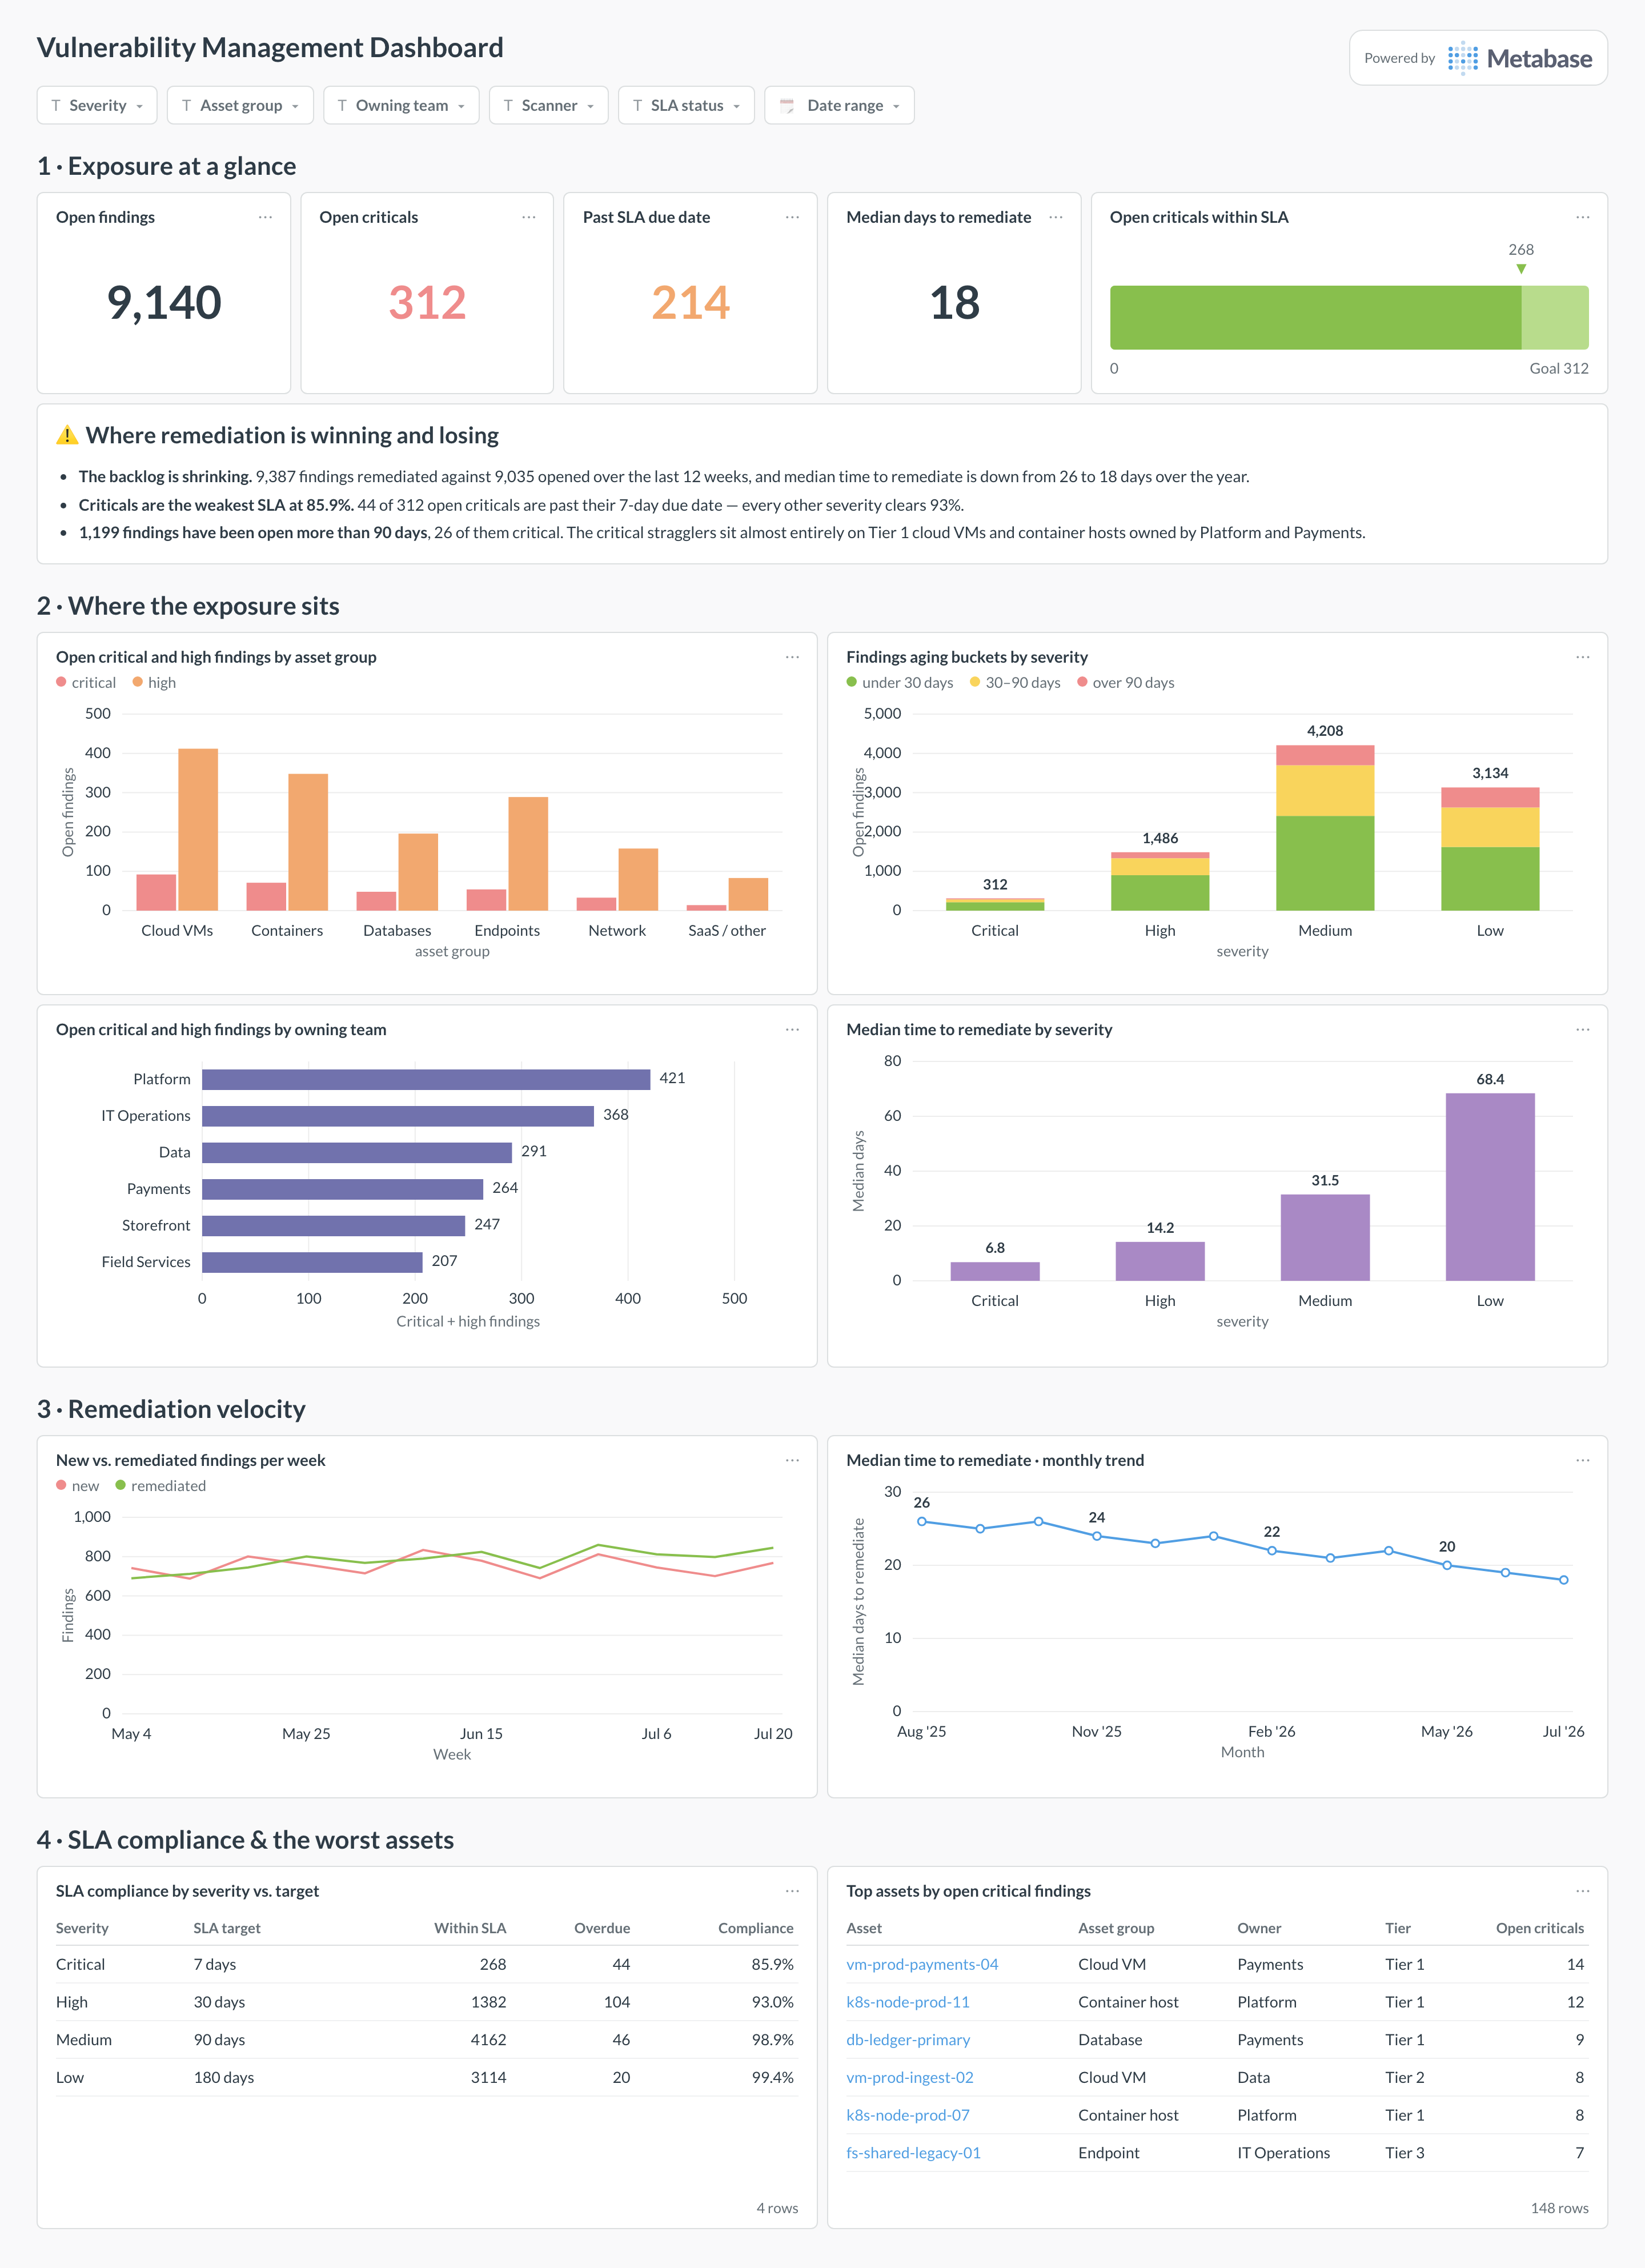
An example vulnerability management dashboard in Metabase, built from Tenable, Wiz, and Snyk data. Figures are illustrative.
Which cards belong on a vulnerability management dashboard?
- Open critical and high findings by asset group (bar)
- New vs. remediated findings per week (line)
- Median time to remediate by severity (bar)
- SLA compliance by severity vs. target (table)
- Findings aging buckets — under 30, 30–90, over 90 days (stacked bar)
- Top assets by open critical findings with owner (table)
What data does the dashboard need?
vulnerability_findings— one row per finding per asset, with severity, status,first_seen_at,resolved_at, andsla_due_at.assets— the inventory, with asset group, owning team, and criticality tier.
How do you build it?
- Sync findings from each scanner into one table with a shared severity scale and a canonical asset + CVE + source key.
- Join to the asset inventory so every finding has an owner and a criticality tier — unowned findings never get fixed.
- Stamp
sla_due_atat first sight from severity, so SLA compliance is computable without re-deriving policy in every query. - Build the open-criticals bar and the new-vs-remediated trend first; add aging buckets and the per-asset table next.
Example card SQL
SELECT
  a.asset_group,
  COUNT(*) AS open_criticals,
  COUNT(*) FILTER (
    WHERE f.first_seen_at >= CURRENT_DATE - INTERVAL '30 days'
  ) AS age_under_30d,
  COUNT(*) FILTER (
    WHERE f.first_seen_at < CURRENT_DATE - INTERVAL '30 days'
      AND f.first_seen_at >= CURRENT_DATE - INTERVAL '90 days'
  ) AS age_30_to_90d,
  COUNT(*) FILTER (
    WHERE f.first_seen_at < CURRENT_DATE - INTERVAL '90 days'
  ) AS age_over_90d
FROM vulnerability_findings f
JOIN assets a ON a.id = f.asset_id
WHERE f.severity = 'critical'
  AND f.status = 'open'
GROUP BY a.asset_group
ORDER BY open_criticals DESC;
Related
Metrics
Integrations
Dashboards
FAQ
What is a vulnerability management dashboard?
How do you dedupe the same CVE reported by multiple scanners?
Why use median time to remediate instead of the mean?
How is vulnerability SLA compliance computed?
sla_due_at derived from severity at first sight — say 15 days for critical, 30 for high. A finding is SLA-compliant if resolved_at lands before sla_due_at; open findings past their due date count as breaches now, not when they eventually close. Vulnerability SLA compliance is then the percentage of findings resolved (or still inside the window) on time, sliced by severity and asset group so owners see their own number.