





What does an application security findings dashboard show in Metabase?
An application security findings dashboard shows code-level risk across the SDLC: open findings by severity and repo, fix rate, quality-gate pass rates, and the CWEs that keep coming back. It's built from findings synced from tools such as SonarQube, Snyk, Semgrep, and bounty platforms like HackerOne.
For: AppSec engineers, engineering managers, and security leadership. Grain: one row per finding, across SAST, SCA, and bug-bounty sources.
What does an AppSec findings dashboard look like?
Here’s the layout this guide builds, at the grain of a single finding: the open backlog and its severity mix at the top, then who owns the risky ones and how fast they get fixed, then the rules, CWEs, and dependencies driving the volume. Read it weekly to see whether resolution is keeping pace with intake.
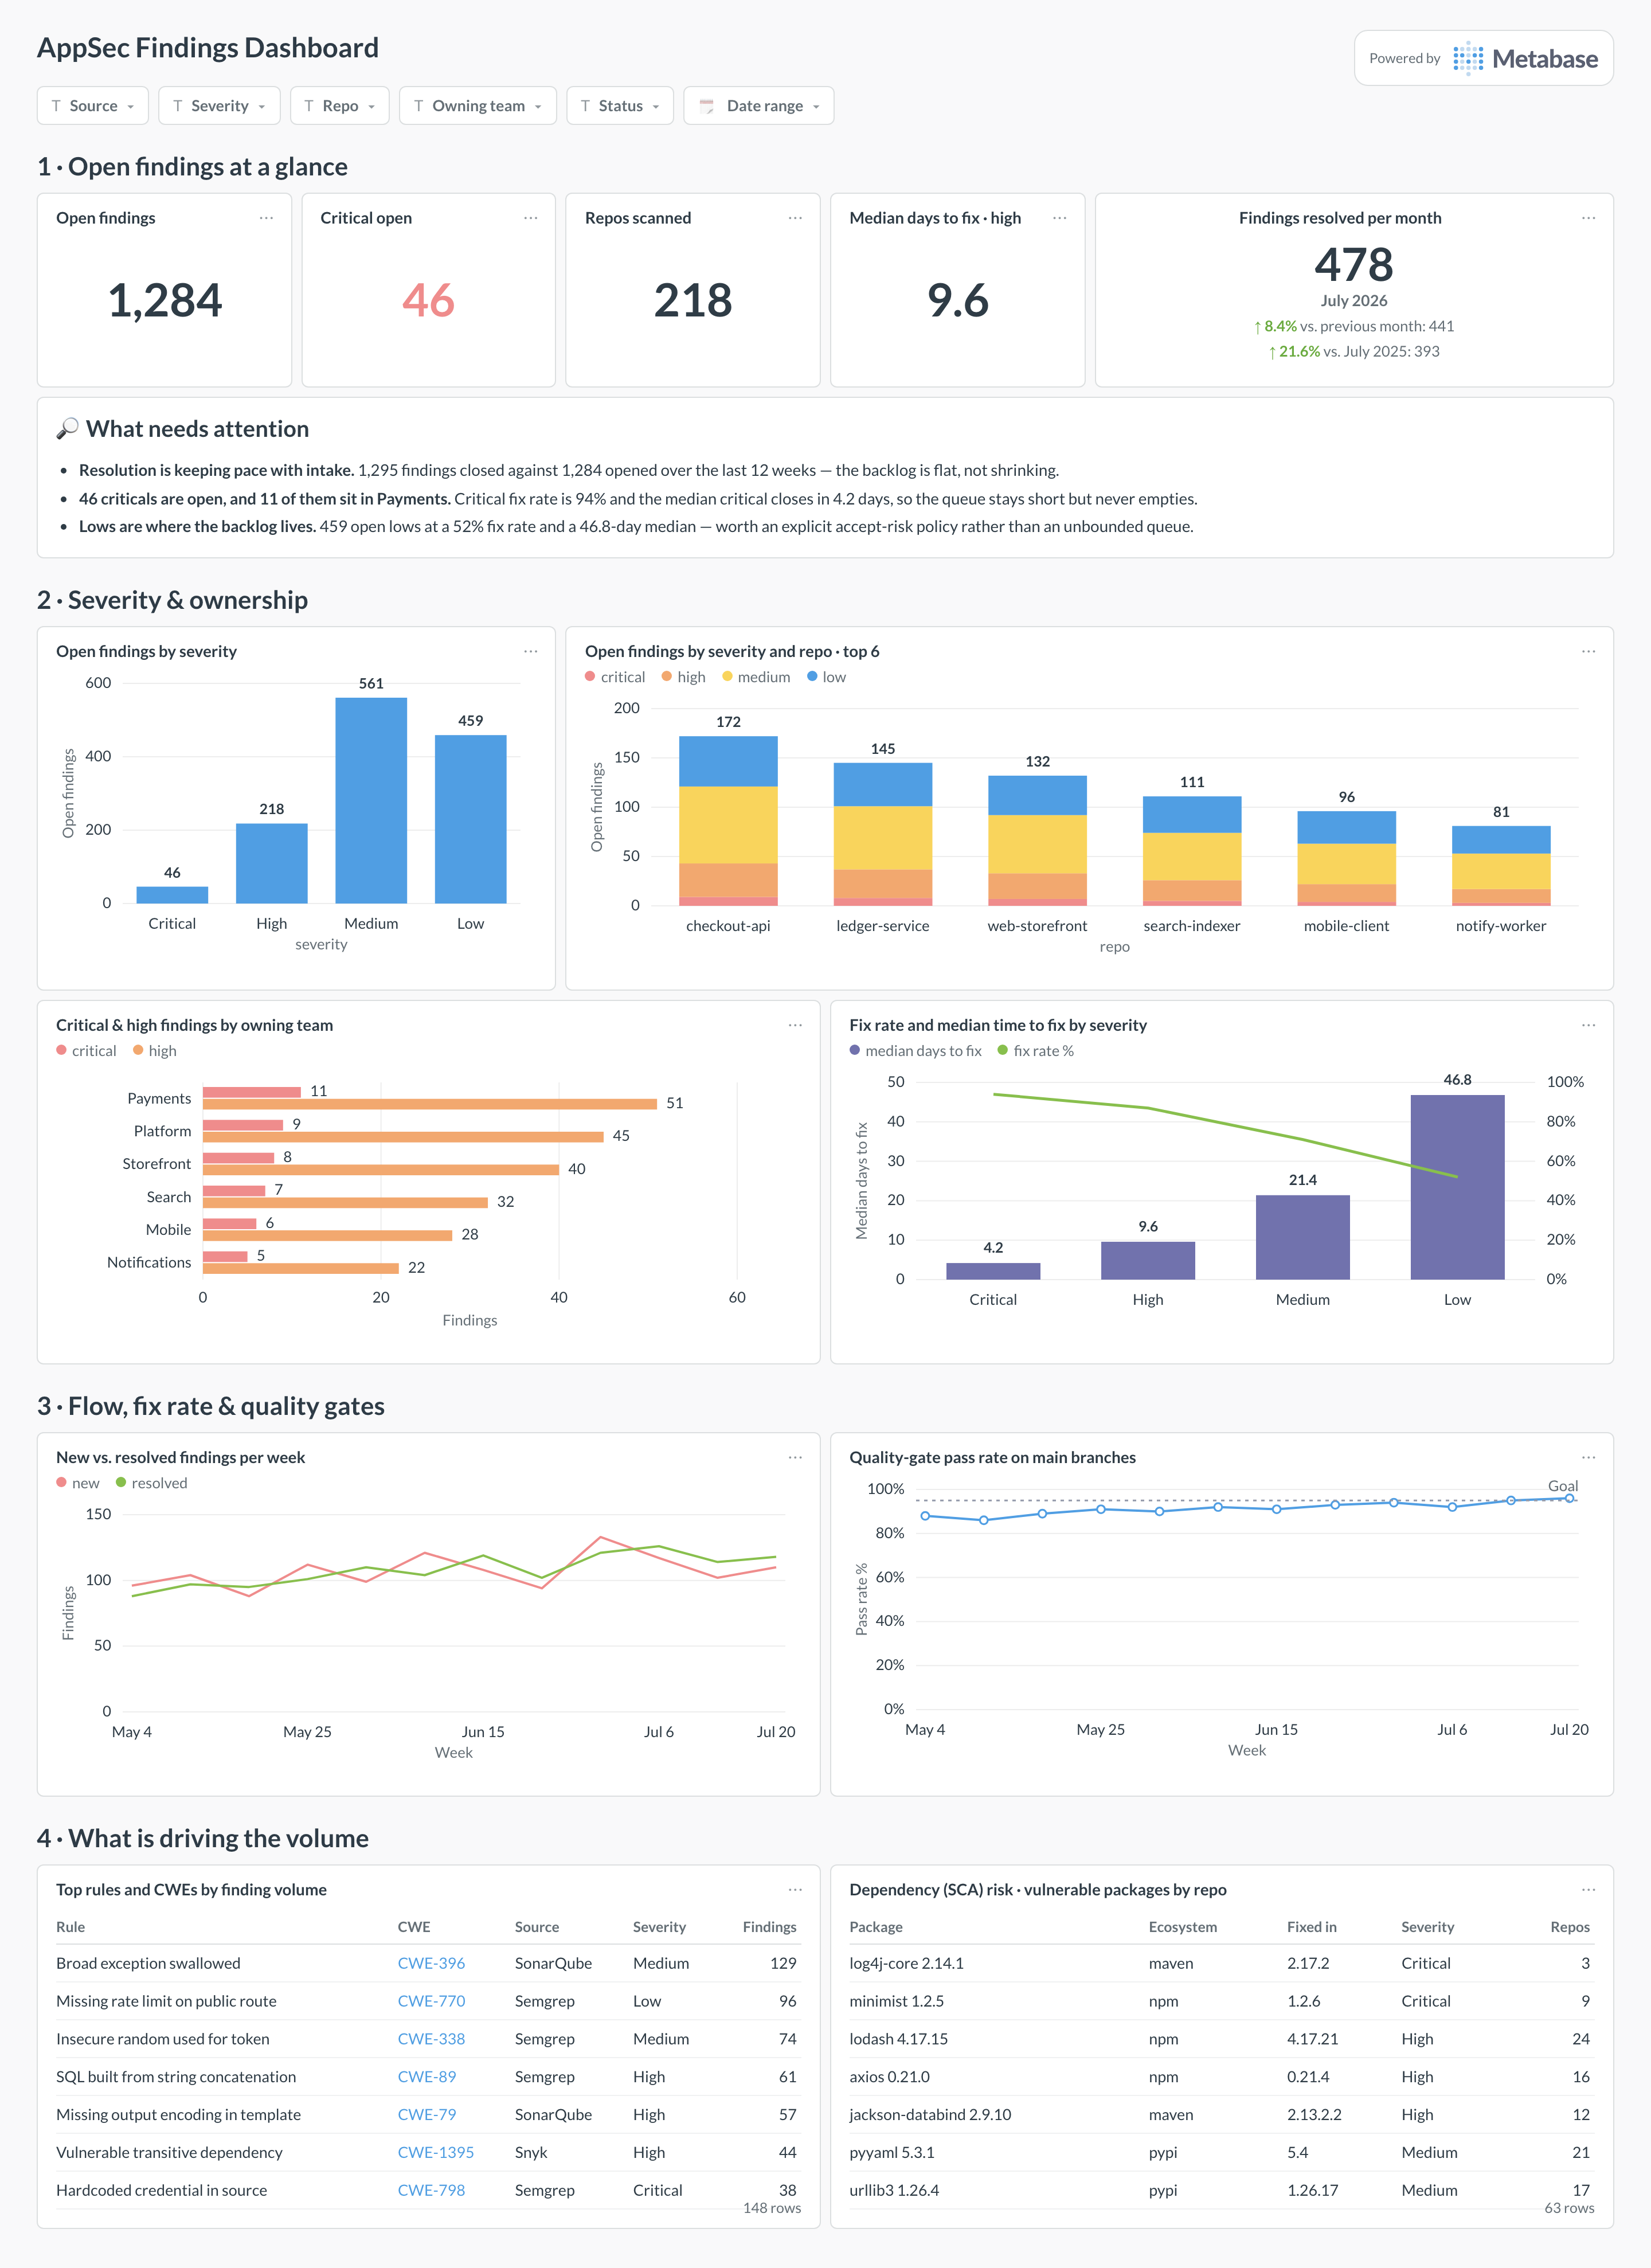
An example AppSec findings dashboard in Metabase, built from Semgrep, SonarQube, and Snyk data. Figures are illustrative.
Which cards belong on an AppSec findings dashboard?
- Open findings by severity and repo (stacked bar)
- New vs. resolved findings per week (line)
- Fix rate and median time to fix by severity (bar)
- Quality-gate pass rate on main branches (line)
- Top rules and CWEs by finding volume (table)
- Dependency (SCA) risk — vulnerable packages by repo (table)
What data does the dashboard need?
appsec_findings— one row per finding with source, repo, rule or CWE, severity, status,introduced_at, andresolved_at.repos— repository list with owning team and criticality.
How do you build it?
- Sync findings from each source into one table, mapping every tool’s severity scale to a shared four-level one and keeping the original for audit.
- Key findings per source — repo + rule + location for SAST, repo + dependency + CVE for SCA, report ID for bounty — so counts don’t collide.
- Separate
fixedfromwontfixandaccepted_riskstatuses so fix rate reflects code changes, not dismissals. - Build the open-by-severity and new-vs-resolved cards first; add quality-gate and CWE views once severity mapping is stable.
Example card SQL
WITH new_findings AS (
  SELECT
    DATE_TRUNC('week', introduced_at) AS week,
    source,
    COUNT(*) AS new_count
  FROM appsec_findings
  WHERE introduced_at >= CURRENT_DATE - INTERVAL '12 weeks'
  GROUP BY week, source
),
resolved_findings AS (
  SELECT
    DATE_TRUNC('week', resolved_at) AS week,
    source,
    COUNT(*) AS resolved_count
  FROM appsec_findings
  WHERE resolved_at >= CURRENT_DATE - INTERVAL '12 weeks'
  GROUP BY week, source
)
SELECT
  COALESCE(n.week, r.week) AS week,
  COALESCE(n.source, r.source) AS source,
  COALESCE(n.new_count, 0) AS new_findings,
  COALESCE(r.resolved_count, 0) AS resolved_findings
FROM new_findings n
FULL OUTER JOIN resolved_findings r USING (week, source)
ORDER BY week, source;
Related
Metrics
Integrations
Dashboards
FAQ
What is an application security findings dashboard?
How do you combine SAST, SCA, and bounty findings without double-counting?
How do you normalize severity across tools?
source_severity column for audit, and document the mapping. The dashboard is only trustworthy if "critical" means the same thing in every row; without the mapping, the severity chart just reflects which tool shouts loudest.Why do bug-bounty reports belong on this dashboard?
How do you measure fix rate honestly?
fixed means the code changed, while wontfix and accepted_risk mean the finding was dismissed. Fix rate is fixed ÷ (fixed + still open), with dismissals excluded from the numerator and shown on their own card — a team "resolving" half its backlog as accepted-risk looks identical to a team fixing it unless you separate the two. Trend the dismissal share too: a rising accepted-risk rate is a policy conversation, not a hygiene win.