





What is mean time to remediate (MTTR), and how do you measure it in Metabase?
Mean time to remediate (MTTR) is how long it takes to fix a vulnerability once it's been detected — measured, despite the name, as a median, in days, segmented by severity. It's the flow metric that explains whether your findings backlog is draining or silting up. Measure it in Metabase from findings synced from Tenable, Snyk, Wiz, or Semgrep. (Not the incident-recovery MTTR — same acronym, different clock.)
median(resolved_at - first_seen_at) over closed findings, by severity. Use percentile_cont(0.5), not AVG: fix times are right-skewed, and one 400-day finding shouldn’t define the metric. What does a mean time to remediate chart look like in Metabase?
Chart p50 and p90 days-to-fix by the month findings closed — the p50 is your typical pipeline speed, the p90 is the stuck tail, and both drifting down means the backlog is draining. A spike like Mar’s in both lines is often good news wearing a bad costume: a batch of long-stuck findings finally closed, and their accumulated age landed in that month’s percentiles.
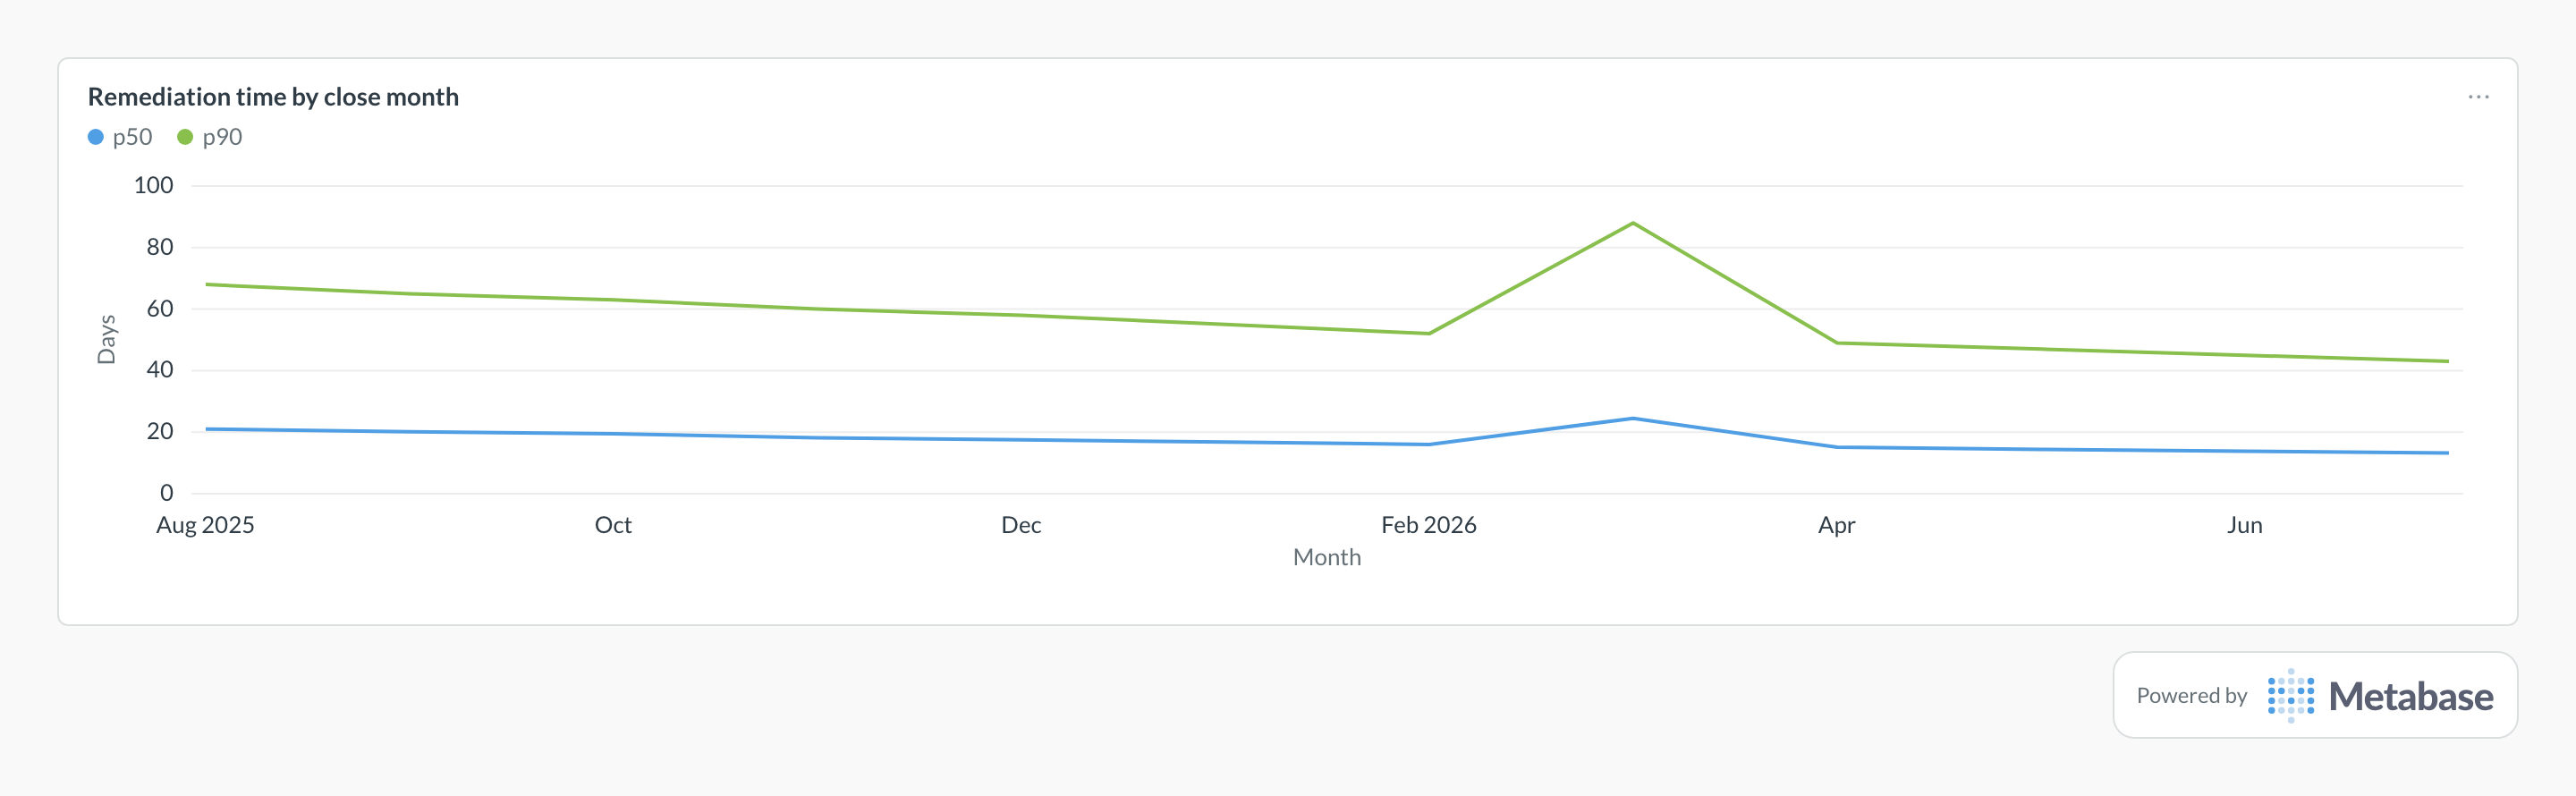
What mean time to remediate measures
It measures the speed of your fix pipeline: triage, ticketing, patching, and verification, end to end. Where open critical vulnerabilities tells you how big the backlog is, remediation time tells you whether it’s moving. Segmented by severity it becomes a commitment you can check — criticals in days, highs in weeks — and the direct input to SLA compliance.
What data does it need?
- A
vulnerability_findingstable withfirst_seen_at,resolved_at,status, and normalizedseverity. - First-seen timestamps carried through from the scanner — not overwritten by your pipeline’s import time.
- Resolution verified by a rescan, not just a ticket closed — otherwise you’re measuring ticket hygiene.
- Asset or team attribution if you want per-team medians instead of one org-wide number.
SQL patterns
SELECT
  severity,
  COUNT(*) AS findings_closed,
  ROUND(
    percentile_cont(0.5) WITHIN GROUP (
      ORDER BY EXTRACT(EPOCH FROM (resolved_at - first_seen_at)) / 86400.0
    )::numeric, 1
  ) AS median_days_to_remediate
FROM vulnerability_findings
WHERE status = 'resolved'
  AND resolved_at >= CURRENT_DATE - INTERVAL '180 days'
GROUP BY severity
ORDER BY median_days_to_remediate;SELECT
date_trunc('month', resolved_at) AS month,
COUNT(*) AS findings_closed,
ROUND(
percentile_cont(0.5) WITHIN GROUP (ORDER BY days_open)::numeric, 1
) AS p50_days,
ROUND(
percentile_cont(0.9) WITHIN GROUP (ORDER BY days_open)::numeric, 1
) AS p90_days
FROM (
SELECT
resolved_at,
EXTRACT(EPOCH FROM (resolved_at - first_seen_at)) / 86400.0 AS days_open
FROM vulnerability_findings
WHERE status = 'resolved'
) closed
GROUP BY 1
ORDER BY 1;Pitfalls
first_seen_at gets stamped when your ETL runs rather than when the scanner first observed the finding, every number is flattered by your sync lag. Carry the scanner’s first-seen timestamp through untouched. Where this metric applies
- Tenable + Metabase — first-seen and fixed timestamps per host finding
- Snyk + Metabase — dependency issues from introduction to fix-merged
- Wiz + Metabase — cloud issues with detection and resolution times
- Semgrep + Metabase — code findings from first detection to fixed commit
Related
Metrics
Dashboards
FAQ
Is this the same as MTTR for incidents?
Why use the median instead of the mean?
percentile_cont(0.5) in PostgreSQL — describes the typical finding; add p90 to keep the slow tail visible instead of averaged away.When does the remediation clock start?
first_seen_at — the first time any scanner observed the finding — not at the timestamp your pipeline imported it. Import time flatters you by however long the sync lag is, and the attacker's window opened at detection, not at your ETL run. Tenable and Wiz both expose first-seen timestamps; carry them through the sync untouched.How do you calculate mean time to remediate?
median(resolved_at - first_seen_at) over findings closed in the window, segmented by severity — despite the name, use the median, not the mean. Critical findings should show a very different number than lows; a single blended figure hides exactly the split that matters. Pair it with the still-open backlog from open critical vulnerabilities so closed-only survivorship bias can't flatter the trend.How do you track mean time to remediate in Metabase?
vulnerability_findings table with first_seen_at, resolved_at, and severity. Chart median days by severity for the headline, p50/p90 by close month for the trend, and put both on a vulnerability management dashboard next to your SLA compliance figures.