





What is open critical vulnerabilities, and how do you measure it in Metabase?
Open critical vulnerabilities is the count of open critical and high-severity findings across your environment, broken down by asset group and by how long each has been open. It's the headline number for exposure — the thing the CISO gets asked about after every headline CVE. Measure it in Metabase from findings synced from Tenable, Wiz, Snyk, or Orca Security.
COUNT(findings WHERE severity IN ('critical','high') AND status = 'open'), deduped to one row per asset-vulnerability pair, split by asset group and age bucket. The age split is the part leadership actually needs. What does an open critical vulnerabilities chart look like in Metabase?
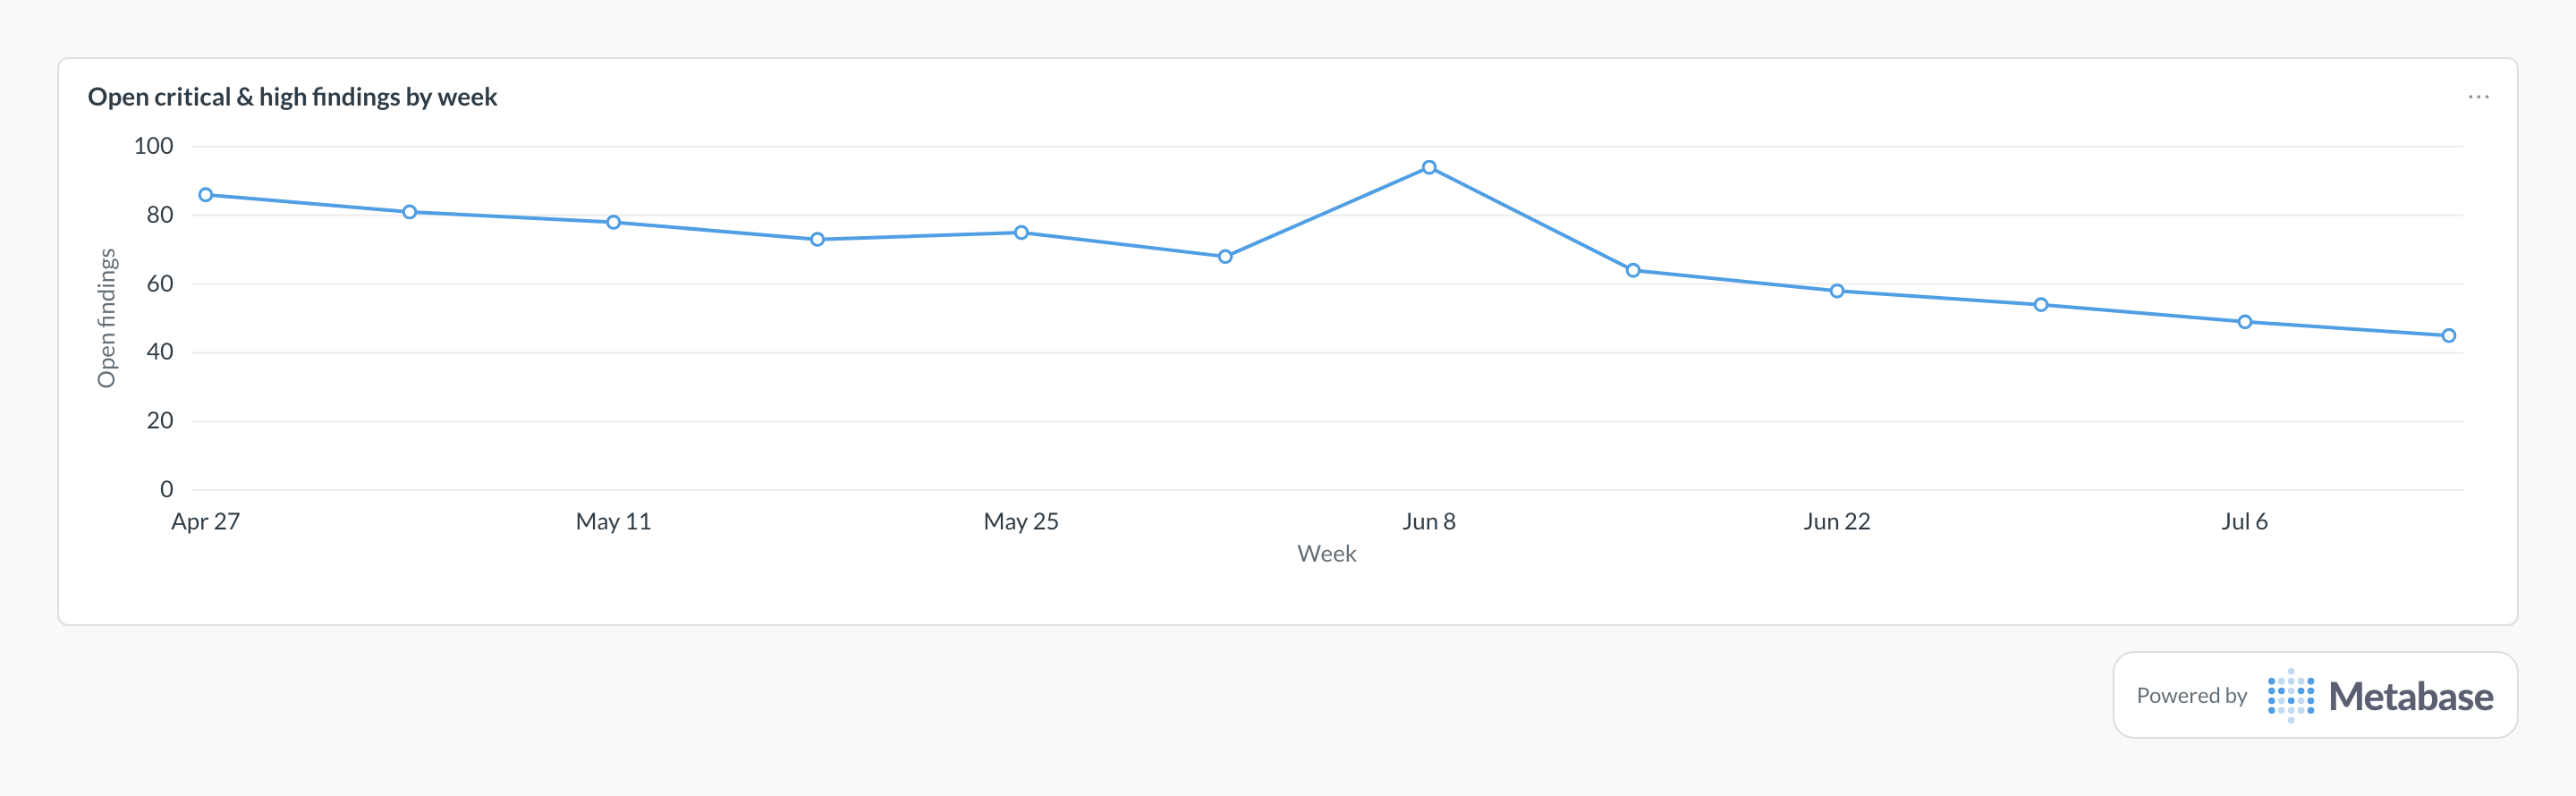
Trend the weekly count of open critical and high findings from daily snapshots and read the slope: a steady decline means remediation is outrunning discovery. A jump like Jun 8’s often isn’t new risk at all — onboarding another scanner surfaces findings that already existed, so check the source mix before sounding the alarm.
What open critical vulnerabilities measures
It measures how much known, serious risk is sitting unfixed right now. The raw total is a blunt instrument — what makes it actionable is the two splits: by asset group, so each owning team sees its own backlog, and by age, so a pile of ninety-day-old criticals can’t hide behind this week’s fresh scan results. Read it alongside mean time to remediate — one is the stock, the other the flow.
What data does it need?
- A deduped
vulnerability_findingstable:asset_id, vulnerability ID,severity,status,first_seen_at— one row per logical finding, not per scan result. - An
assetstable withasset_group(and owner) so counts land with the right team. - A normalized severity scale mapped from each scanner’s native scoring at sync time.
- Daily snapshots of open findings if you want a trend — the live table only knows the present.
SQL patterns
SELECT
  a.asset_group,
  CASE
    WHEN CURRENT_DATE - f.first_seen_at::date < 30 THEN '0-29 days'
    WHEN CURRENT_DATE - f.first_seen_at::date < 90 THEN '30-89 days'
    ELSE '90+ days'
  END AS age_bucket,
  COUNT(*) AS open_findings
FROM vulnerability_findings f
JOIN assets a ON a.id = f.asset_id
WHERE f.severity IN ('critical', 'high')
  AND f.status = 'open'
GROUP BY 1, 2
ORDER BY 1, 2;-- Requires a daily snapshot table: one row per open finding per day.
-- The live findings table only knows the present, so back-build history
-- by snapshotting open findings on a schedule.
SELECT
date_trunc('week', snapshot_date) AS week,
ROUND(AVG(open_criticals), 0) AS avg_open_criticals
FROM (
SELECT
snapshot_date,
COUNT(*) AS open_criticals
FROM vulnerability_findings_daily
WHERE severity IN ('critical', 'high')
AND status = 'open'
GROUP BY snapshot_date
) daily
GROUP BY 1
ORDER BY 1;Pitfalls
Where this metric applies
- Tenable + Metabase — network and host findings with VPR and CVSS scores
- Wiz + Metabase — cloud findings ranked by attack-path context
- Snyk + Metabase — open-source and container vulnerabilities by project
- Orca Security + Metabase — agentless cloud workload findings
Related
Metrics
Dashboards
FAQ
What counts as a critical or high finding?
severity column at sync time, document the mapping, and filter on that column — never on raw vendor fields mixed across sources.Why is my count higher than the scanner console shows?
(asset_id, vulnerability_id) pair. Consoles dedupe for you; a raw export doesn't. Model the deduped findings table first, keep per-scan rows in a separate raw table.How do I trend open criticals over time?
vulnerability_findings_daily snapshot table, then trend weekly averages from it. Pair the trend with mean time to remediate to tell whether a falling count means fixing or just slower scanning.How do you calculate open critical vulnerabilities?
severity IN ('critical', 'high') and status = 'open', grouped by asset group and age bucket. The age split matters as much as the total: fifty criticals opened this week is a busy patch cycle, fifty open for ninety-plus days is a process failure that SLA compliance will confirm.How do you track open critical vulnerabilities in Metabase?
vulnerability_findings table with severity, status, and first_seen_at. Chart the count by asset group and age bucket, snapshot daily for the trend, and put both on a vulnerability management dashboard as part of your security analytics stack.