Learn about Machine Learning Performance, including how to measure it, and leverage it in dashboards and visualizations with Metabase.
Machine learning performance metrics are a set of metrics that tell you about various classification performance indicators. These metrics aim to identify how well machine learning is working on coming up with predictions, gathering information, and how specific your machine learning can be. The machine learning we use is almost never 100% accurate; achieving that level of accuracy would take up a lot of resources. The true purpose of these metrics is just to make sure your machine learning is at a usable standard.
Get Started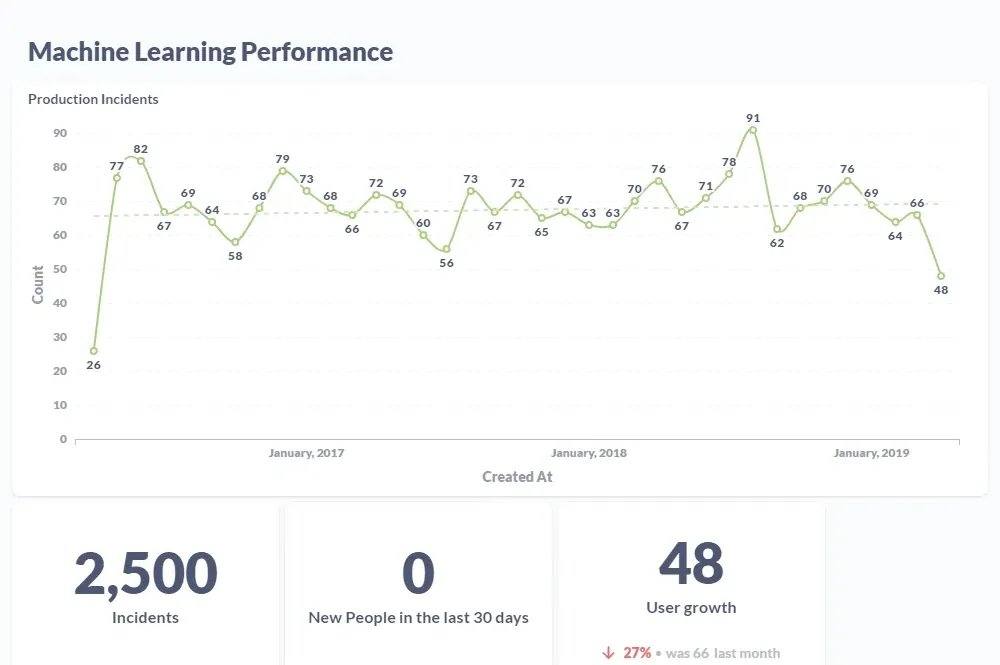
There are several different calculations you can use to assess the reliability of your machine learning. You’ll need to understand your machine learning’s true and false positives and negatives based on actual and predicted classifications. Some examples of calculations you can do to achieve this are: Recall (or sensitivity) - How many times a positive prediction was made by a model. Accuracy - How the model performs across all classes Precision - The quality of a positive prediction made by a model. Logarithmic loss - How close a prediction probability is to its true value.
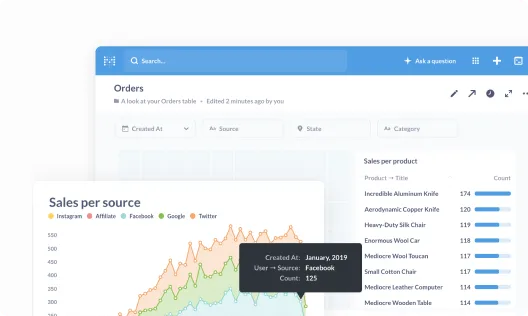
Get everyone on the same page by collecting your most important metrics into a single view.

Take your data wherever it needs to go by embedding it in your internal wikis, websites, and content.
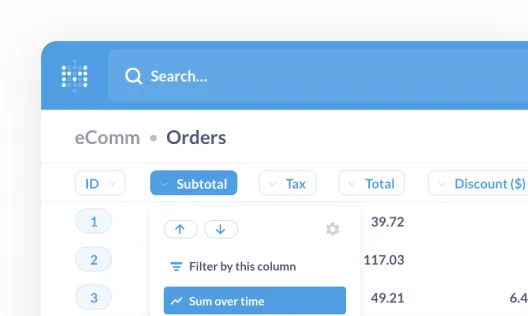
Empower your team to measure their own progress and explore new paths to achieve their goals.

That's right, no sales calls necessary—just sign up, and get running in under 5 minutes.

We connect to the most popular production databases and data warehouses.
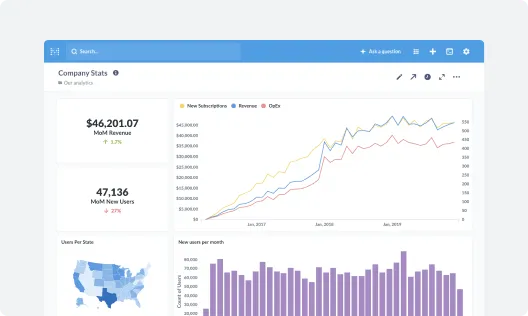
Invite your team and start building dashboards—no SQL required.




