




What goes in an IT compliance dashboard in Metabase?
An IT compliance dashboard tracks control attestation across frameworks — pass rates, evidence freshness, exceptions with owners, audit-finding burndown, and access reviews. It's the audit-cycle companion to the compliance posture dashboard: that page shows what your security platform's monitors see; this one shows what your auditor will ask about. Metabase builds it from GRC exports or a controls table in your warehouse.
For: IT compliance managers, control owners, and audit leads. Grain: one row per control test, evidence item, or exception. Refresh: daily from the GRC platform; weekly review cadence.
What does an IT compliance dashboard look like?
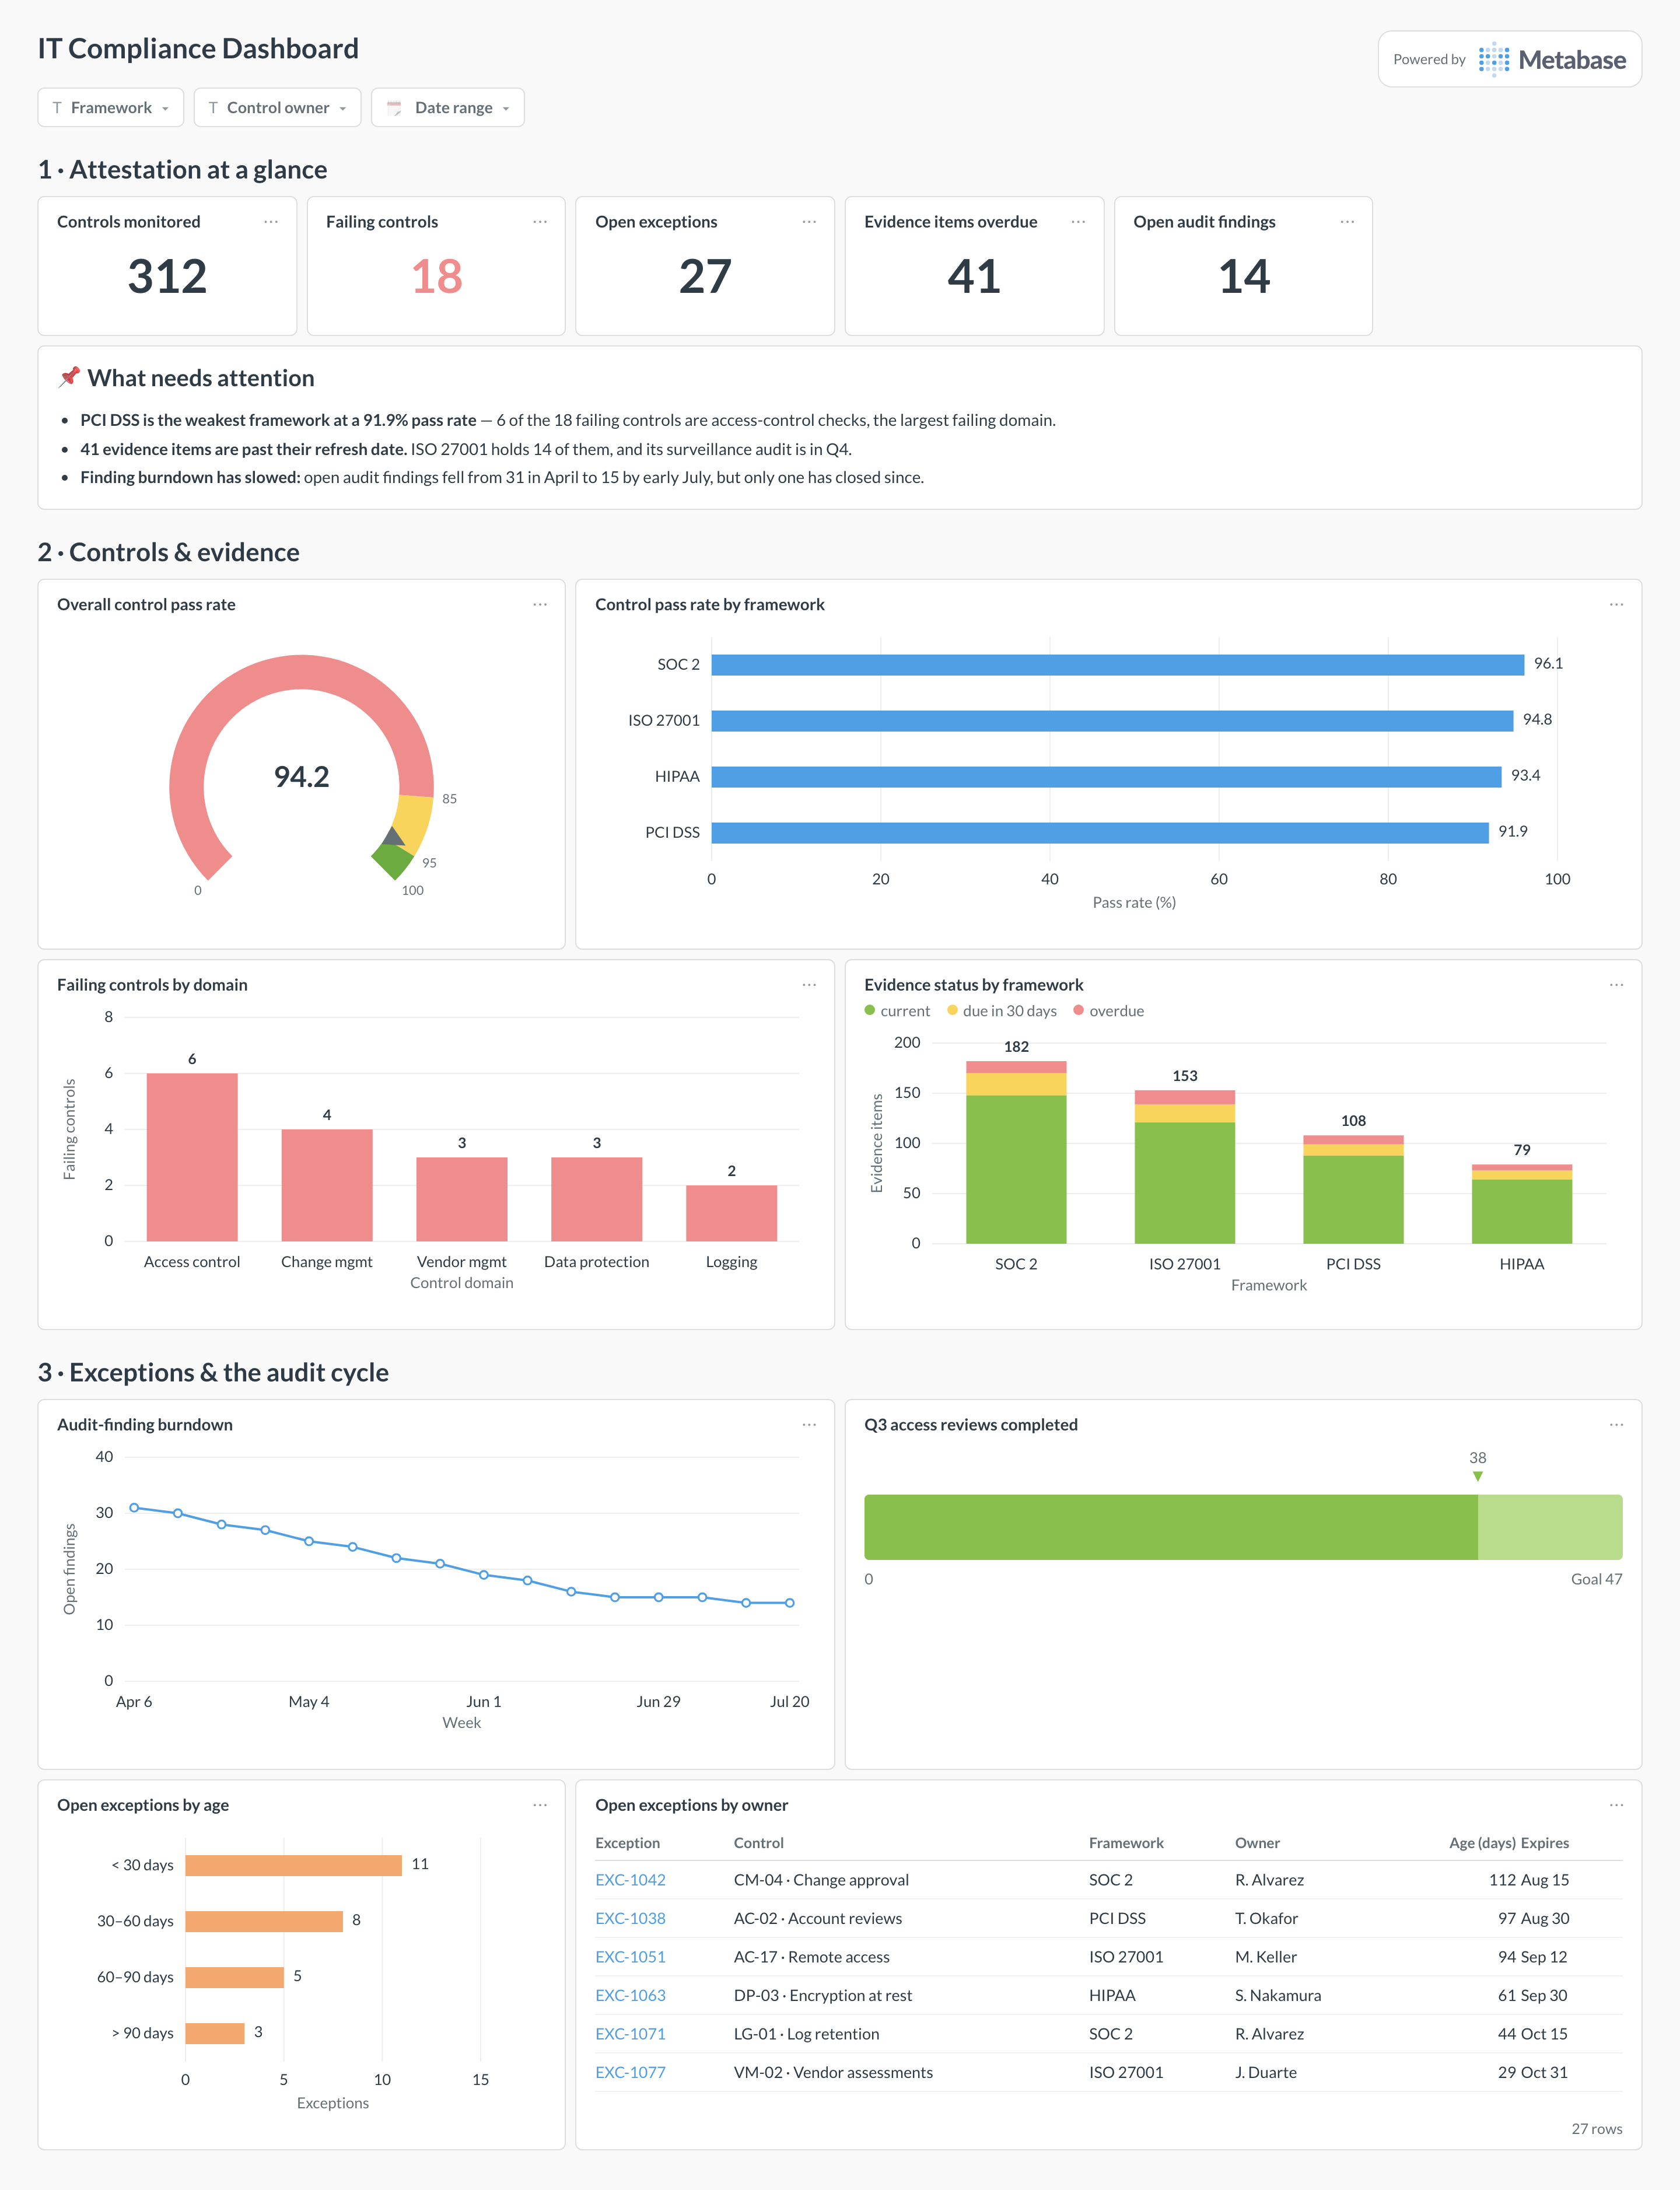
Here’s the layout this guide builds. The attestation headline sits at the top — controls monitored, failing, exceptions, overdue evidence, open findings — so the weekly review opens on one row; controls and evidence come next because pass rate and freshness are what slip between audits; the bottom section tracks the audit cycle itself: finding burndown, access-review progress, and the exception table the review meeting walks through.
Which cards belong on an IT compliance dashboard?
The eight below cover the three questions an audit cycle turns on: are the controls passing, is the evidence current, and are the known gaps being worked down?
- Overall control pass rate — latest test result across all active controls (gauge)
- Control pass rate by framework — SOC 2, ISO 27001, PCI DSS, HIPAA side by side (row)
- Failing controls by domain — where the gaps cluster (bar)
- Evidence status by framework — current, due within 30 days, overdue (stacked bar)
- Audit-finding burndown — open findings per week since the last audit (line)
- Access reviews completed — this quarter’s reviews against the due count (progress)
- Open exceptions by age — under 30 through over 90 days (row)
- Open exceptions by owner — the worklist, with control, framework, age, and expiry (table)
What data does the dashboard need?
- A
controlstable —control_id, name, domain, owner,active— plus acontrol_framework_maplinking each control to the frameworks it satisfies. control_testswithcontrol_id,tested_at, andstatus— the latest row per control drives every pass-rate card.- An
evidencetable withcollected_atand a per-itemrefresh_dayscadence, for the freshness buckets. exceptionswith owner,opened_at,expires_at, and the control they cover;findingswithopened_atandclosed_atfor the burndown.- Access-review records per quarter — system, reviewer,
due_at,completed_at— for the progress card.
How do you build it?
- Export control and evidence state from your GRC platform daily — Drata and Vanta both have APIs, and a spreadsheet-based program can load its sheets into the warehouse as-is.
- Model “current status” once: a view that takes the latest test per control and joins the framework map, so every pass-rate card shares one definition.
- Compute evidence freshness as
now() - collected_atagainst each item’s cadence, bucketed into current / due soon / overdue. - Build the exception and finding cards from their own tables — age buckets for exceptions, weekly open-count for the finding burndown — and keep “exception” strictly separate from “failing control.”
- Add filters for framework, control owner, and date range; subscribe control owners to a weekly digest so the exception table arrives in their inbox before the review meeting.
Example card SQL
SELECT
f.framework,
COUNT(DISTINCT c.control_id)                          AS controls,
COUNT(DISTINCT c.control_id)
  FILTER (WHERE t.status = 'fail')                    AS failing_controls,
ROUND(
  100.0 * COUNT(DISTINCT c.control_id)
            FILTER (WHERE t.status = 'pass')
    / NULLIF(COUNT(DISTINCT c.control_id), 0), 1
)                                                     AS pass_rate_pct,
COUNT(e.evidence_id)
  FILTER (WHERE e.collected_at
            < now() - (e.refresh_days || ' days')::interval)
                                                      AS evidence_overdue
FROM controls c
JOIN control_framework_map f USING (control_id)
LEFT JOIN LATERAL (
SELECT status
FROM control_tests
WHERE control_id = c.control_id
ORDER BY tested_at DESC
LIMIT 1
) t ON true
LEFT JOIN evidence e USING (control_id)
WHERE c.active
GROUP BY f.framework
ORDER BY pass_rate_pct ASC;
Related
Metrics
Integrations
Dashboards
FAQ
How is this different from a compliance posture dashboard?
What's the difference between a failing control and an exception?
How do I measure evidence freshness?
now() and collected_at versus that cadence. Then bucket into current, due within 30 days, and overdue. The 30-day bucket is the one that makes the dashboard useful: it turns evidence collection from a pre-audit scramble into a rolling queue. Group the overdue count by framework so you know which audit it endangers, not just how big the pile is.Should each framework get its own dashboard?
control_framework_map table means one test updates every framework's pass rate. A per-framework dashboard multiplies work and lets the same control be "passing" for SOC 2 and forgotten for ISO. Use a framework filter on one dashboard instead — that's what the control pass rate by framework card is for.How should exceptions appear on the dashboard?
What does a realistic control pass rate look like mid-cycle?
Where does the data come from if we track controls in spreadsheets?
controls sheet, an exceptions sheet, and a findings sheet upload cleanly as tables Metabase can query, and that alone gets you pass rates, aging, and burndown. When you adopt a GRC platform later, Drata and Vanta both expose control and evidence state through their APIs, so the dashboard keeps its shape and swaps its source. Start with the spreadsheet — the discipline of owners and expiry dates matters more than the tooling.