





What does an identity and access analytics dashboard show in Metabase?
An identity and access analytics dashboard shows the health of your login perimeter: failure rates and spray-shaped spikes, MFA adoption by factor, privileged actions, and deprovisioning lag for departed users. It's built from authentication rollups synced from tools such as Okta, Auth0, and CrowdStrike.
For: IAM engineers, security teams, and compliance leads. Grain: daily authentication rollups per app, outcome, and factor, plus one row per user.
What does an identity and access analytics dashboard look like?
Here’s the layout this guide builds, at the grain of a daily authentication rollup: who holds accounts and how they authenticate, then the shape of login success and failure, then the privileged actions and the offboarding lag that follow. Read it daily for spray-shaped spikes, and monthly for the access review.
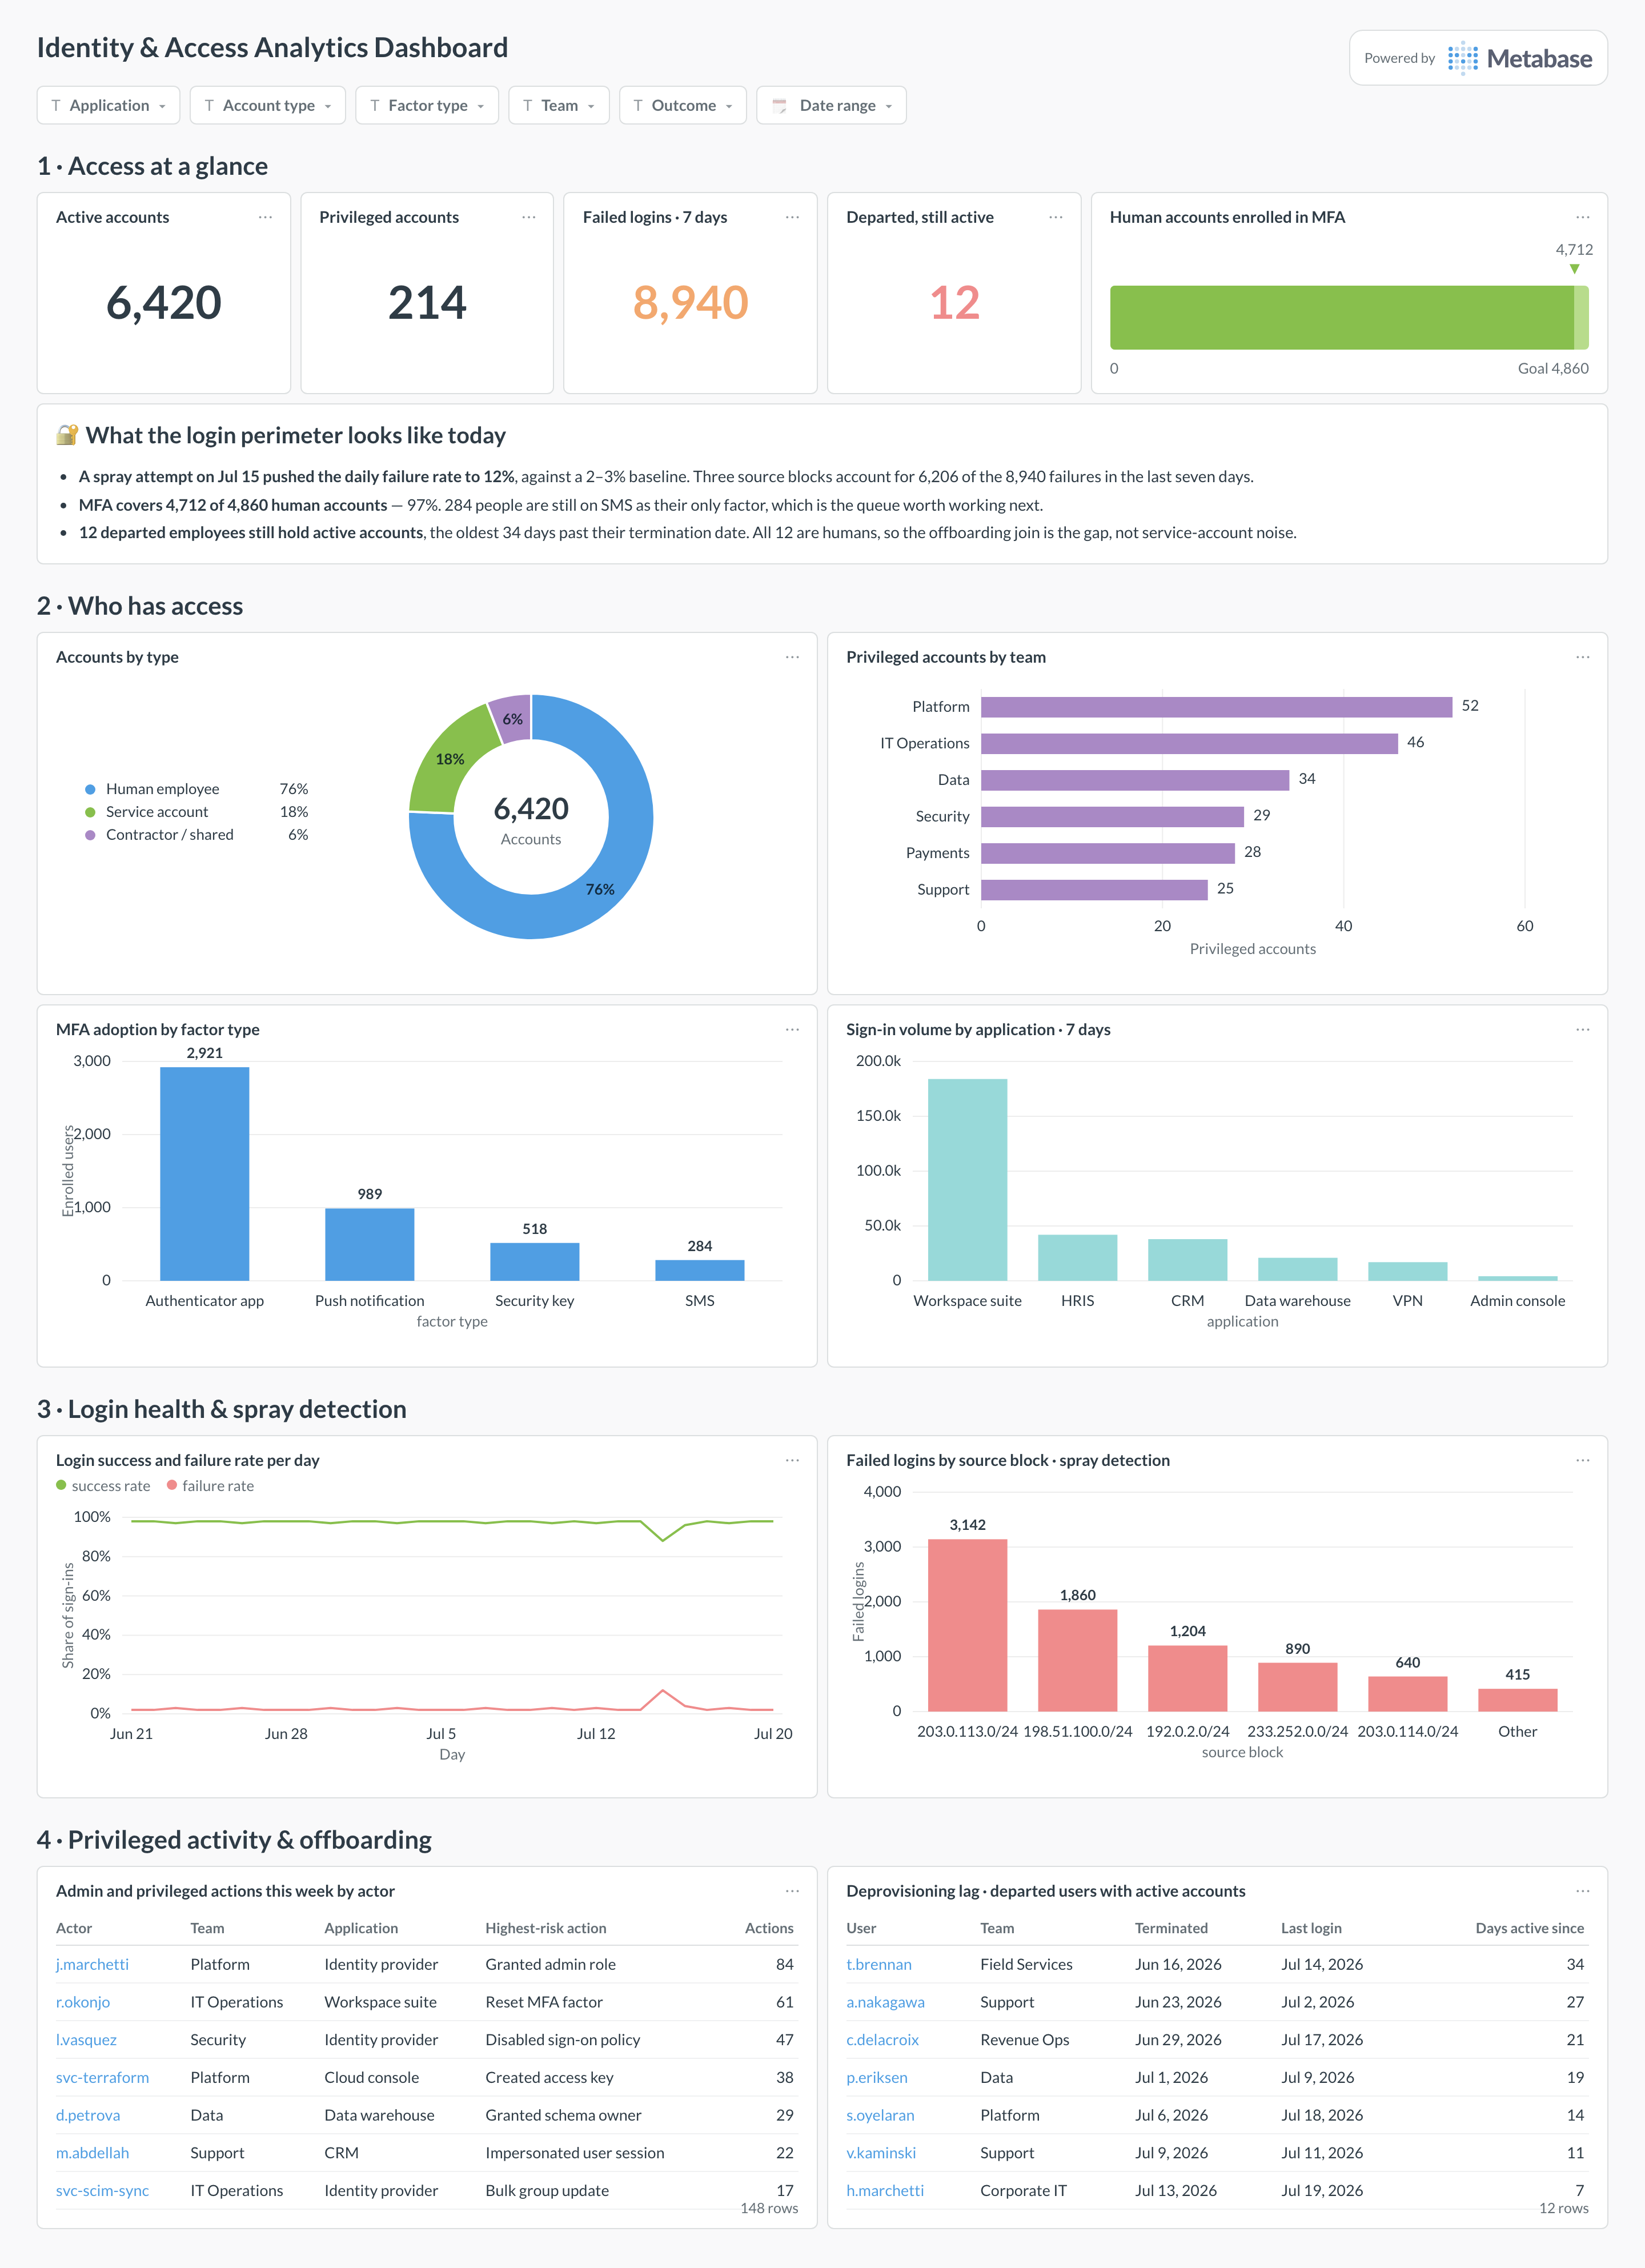
An example identity and access analytics dashboard in Metabase, built from Okta and Auth0 data. Figures are illustrative.
Which cards belong on an identity and access analytics dashboard?
- Login success / failure rate per day (line)
- Failed-login spikes by source — spray detection (bar)
- MFA adoption by factor type (bar)
- Sign-in volume by application (bar)
- Admin and privileged actions per week by actor (table)
- Deprovisioning lag — departed users with active accounts (table)
What data does the dashboard need?
auth_events_rollups— daily counts per app, outcome, and factor type.users— status,mfa_enrolled, last login, and account type (human vs. service).admin_events— privileged actions with actor and timestamp.
How do you build it?
- Roll up authentication events daily by app, outcome, and factor — sync the rollups, not the raw system-log firehose.
- Flag service accounts in the user table so MFA and login cards can filter to humans.
- Join users to the HR termination feed to compute deprovisioning lag — identity data alone can’t tell you who should be gone.
- Build the failure-rate trend and MFA adoption cards first; add spray detection and privileged-action views next.
Example card SQL
WITH daily AS (
  SELECT
    event_date,
    COALESCE(SUM(event_count) FILTER (WHERE outcome = 'failure'), 0)
      AS failures,
    SUM(event_count) AS attempts
  FROM auth_events_rollups
  WHERE event_date >= CURRENT_DATE - INTERVAL '90 days'
  GROUP BY event_date
)
SELECT
  event_date,
  ROUND(100.0 * failures / NULLIF(attempts, 0), 2) AS failed_login_pct,
  ROUND(
    100.0 * SUM(failures) OVER w / NULLIF(SUM(attempts) OVER w, 0), 2
  ) AS failed_login_pct_7d_avg
FROM daily
WINDOW w AS (
  ORDER BY event_date ROWS BETWEEN 6 PRECEDING AND CURRENT ROW
)
ORDER BY event_date;
Related
Metrics
Integrations
Dashboards
FAQ
What is an identity and access analytics dashboard?
Should you sync raw identity system logs into the warehouse?
auth_events_rollups instead: daily counts per app, outcome, and factor type. That's a few hundred rows a day, answers every card on this dashboard, and keeps forensic detail where it belongs — in the identity provider's own log search. Metabase reads the rollups from your SQL warehouse, not from the identity provider directly.How do you tell user friction from attack signal in failed logins?
How do you measure deprovisioning lag?
deactivated_at − termination_date per departed user, and the card lists anyone past termination with an active account, which auditors treat as a finding. This is the one card on the dashboard that cannot be built from identity data alone: without the HR join you only know who was deactivated, not who should have been.