





What is MFA adoption rate, and how do you measure it in Metabase?
MFA adoption rate is the share of active users with a strong second factor enrolled — the single highest-leverage number in identity security, since stolen passwords remain the most common initial access vector. Measure it in Metabase from user and factor data synced from Okta or Auth0, broken down by factor strength and department rather than reported as one org-wide average.
COUNT(users with MFA enrolled) ÷ COUNT(active human users), with the numerator split by strongest factor type. The unprotected-admins list matters more than the percentage. What does an MFA adoption rate chart look like in Metabase?
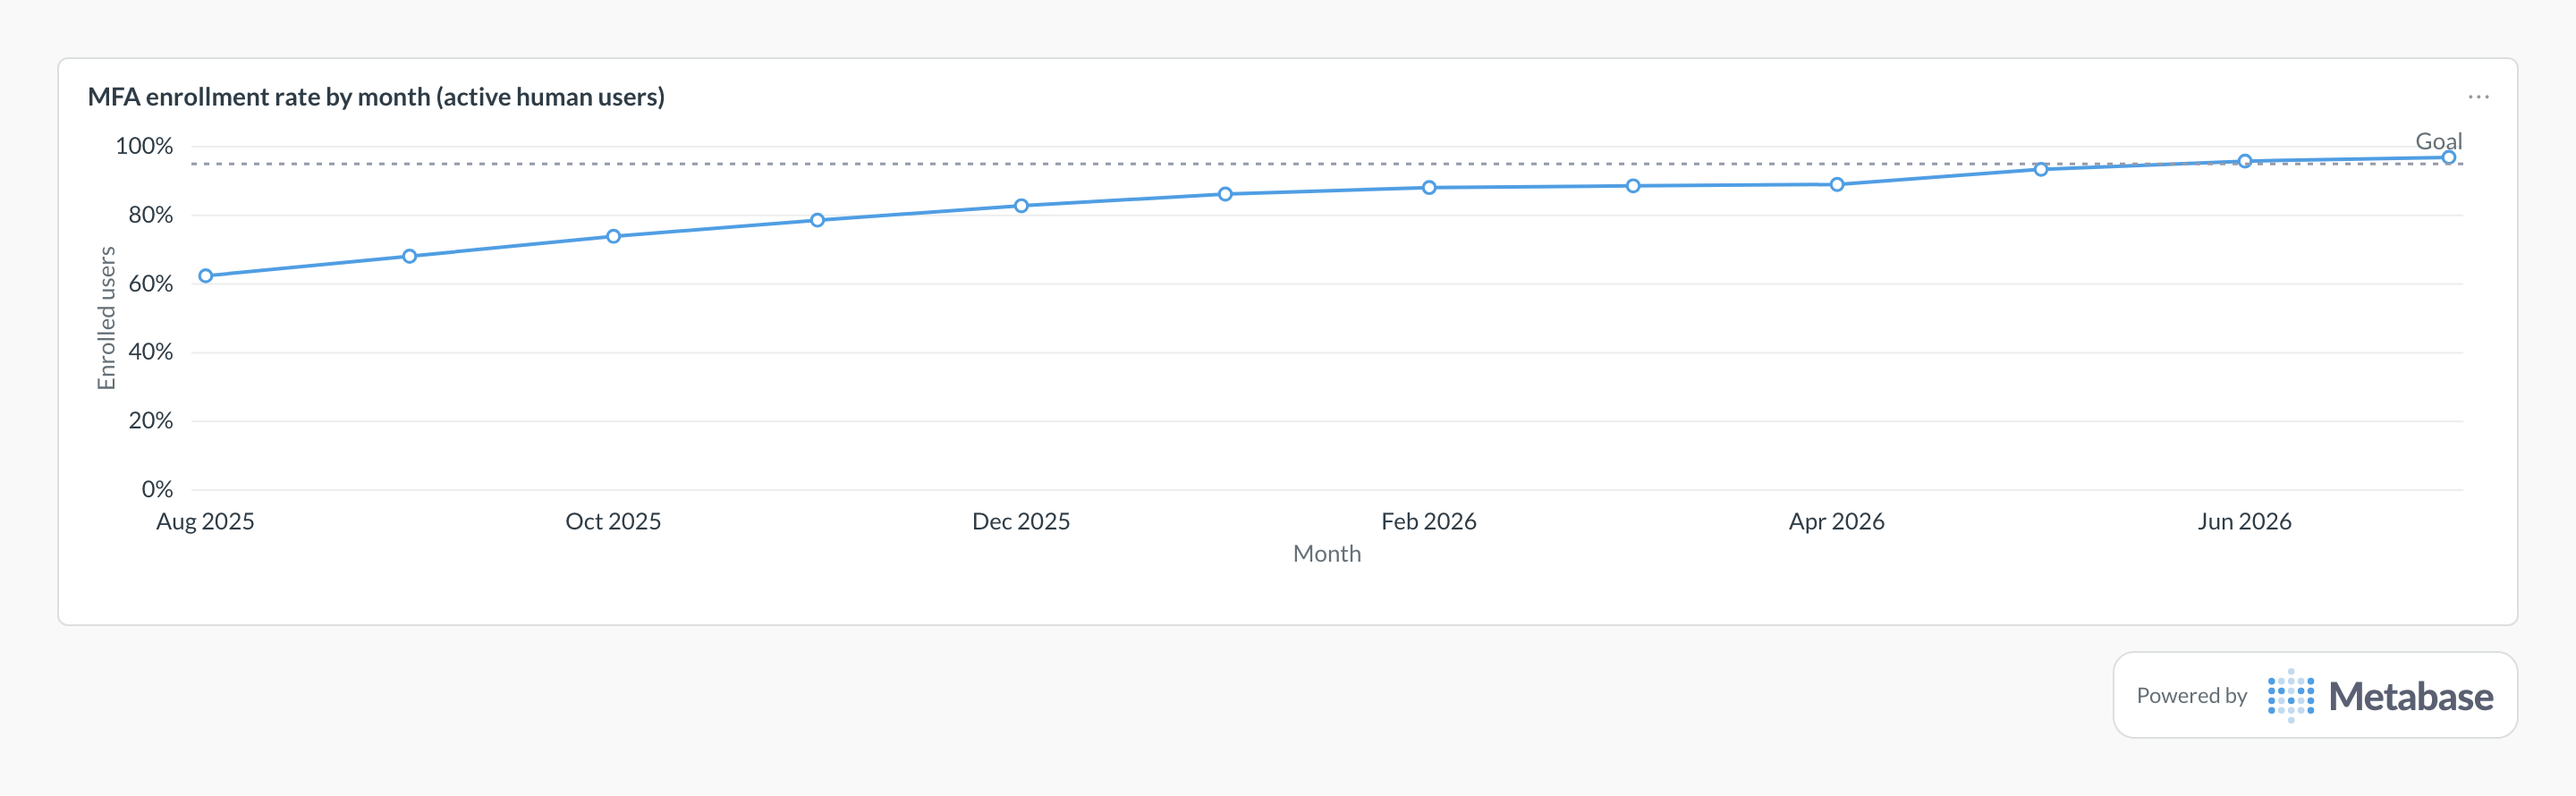
Chart enrolled users as a share of active human accounts by month, with the policy target drawn as the goal line. The curve climbs fast while adoption is voluntary, stalls in the high 80s through early 2026 — the long tail nudge emails never reach — and the jump past the 95% goal in May is what an enforcement deadline looks like.
What MFA adoption rate measures
It measures how much of your workforce a phished password can still compromise. Tracked properly it’s three numbers, not one: the enrollment rate (who has any second factor), the factor mix (how many are phishing-resistant versus SMS), and the gap list (which active accounts — especially privileged ones — have nothing). It’s also a standing compliance requirement, which is why it belongs next to control pass rate on the audit-readiness view.
What data does it need?
- A
userstable withstatus,user_type(person vs. service account), department, admin flag, andlast_login_at. - An
mfa_enrollmentstable: one row per user per enrolled factor, withfactor_type. - A factor-strength ranking (WebAuthn > TOTP/push > SMS) encoded in the query, so “strongest factor per user” is well-defined.
- Authentication logs if you also want usage — enrollment alone doesn’t prove the factor is ever exercised.
SQL patterns
WITH strongest AS (
  -- one row per user: their strongest enrolled factor
  SELECT
    user_id,
    MIN(
      CASE factor_type
        WHEN 'webauthn' THEN 1  -- phishing-resistant
        WHEN 'totp' THEN 2
        WHEN 'push' THEN 3
        WHEN 'sms' THEN 4       -- weakest
      END
    ) AS factor_rank
  FROM mfa_enrollments
  GROUP BY user_id
)
SELECT
  u.department,
  COUNT(*) AS active_users,
  ROUND(100.0 * COUNT(s.user_id) / COUNT(*), 1) AS enrolled_pct,
  COUNT(*) FILTER (WHERE s.factor_rank = 1) AS phishing_resistant,
  COUNT(*) FILTER (WHERE s.factor_rank IN (2, 3)) AS app_based,
  COUNT(*) FILTER (WHERE s.factor_rank = 4) AS sms_only
FROM users u
LEFT JOIN strongest s ON s.user_id = u.id
WHERE u.status = 'active'
  AND u.user_type = 'person'  -- exclude service accounts
GROUP BY u.department
ORDER BY enrolled_pct;SELECT
u.email,
u.department,
u.is_admin,
u.last_login_at::date AS last_login
FROM users u
LEFT JOIN mfa_enrollments e ON e.user_id = u.id
WHERE u.status = 'active'
AND u.user_type = 'person'
AND e.user_id IS NULL
-- admins first, then most recently active:
-- the riskiest unprotected accounts at the top
ORDER BY u.is_admin DESC, u.last_login_at DESC;Pitfalls
Where this metric applies
- Okta + Metabase — users, factor enrollments, and authentication logs
- Auth0 + Metabase — enrolled MFA methods per user across applications
Related
Metrics
Dashboards
FAQ
Do all second factors count the same?
Who belongs in the denominator?
status = 'active' and user_type = 'person' using the account-type fields Okta and Auth0 expose, and audit the service-account list separately.Why isn't the org-wide average enough?
How do you calculate MFA adoption rate?
COUNT(mfa_enrolled) / COUNT(active users). Scope the denominator to status = 'active' and user_type = 'person', then break the numerator down by strongest factor type so SMS-only enrollment doesn't masquerade as full protection.How do you track MFA adoption rate in Metabase?
users and mfa_enrollments tables. Chart adoption by department with the factor-type mix, keep the ranked unprotected-accounts list as the follow-up queue, and pair the whole view with failed login rate on the same identity dashboard — enrollment tells you who's protected, login telemetry tells you who's being attacked.