





What is failed login rate, and how do you measure it in Metabase?
Failed login rate is failed authentication attempts divided by total attempts, per day and per application. It's two metrics wearing one name: a UX signal (users fumbling passwords after a policy change) and a threat signal (credential stuffing and password sprays) — and the analysis only works if you can tell them apart. Measure it in Metabase from authentication logs synced from Okta or Auth0.
failures ÷ attempts, daily per app with a 7-day moving average. Watch each app against its own baseline, and run the sources-hitting-many-usernames query separately — sprays hide in org-wide averages. What does a failed login rate chart look like in Metabase?
Chart the daily failure rate with its 7-day average and read the average for the trend — here a slow drift down as SSO and MFA adoption spread. A one-day spike like Jul 8’s that barely moves the average usually follows a password-policy rotation; attack traffic shows up instead as one source failing across many accounts.
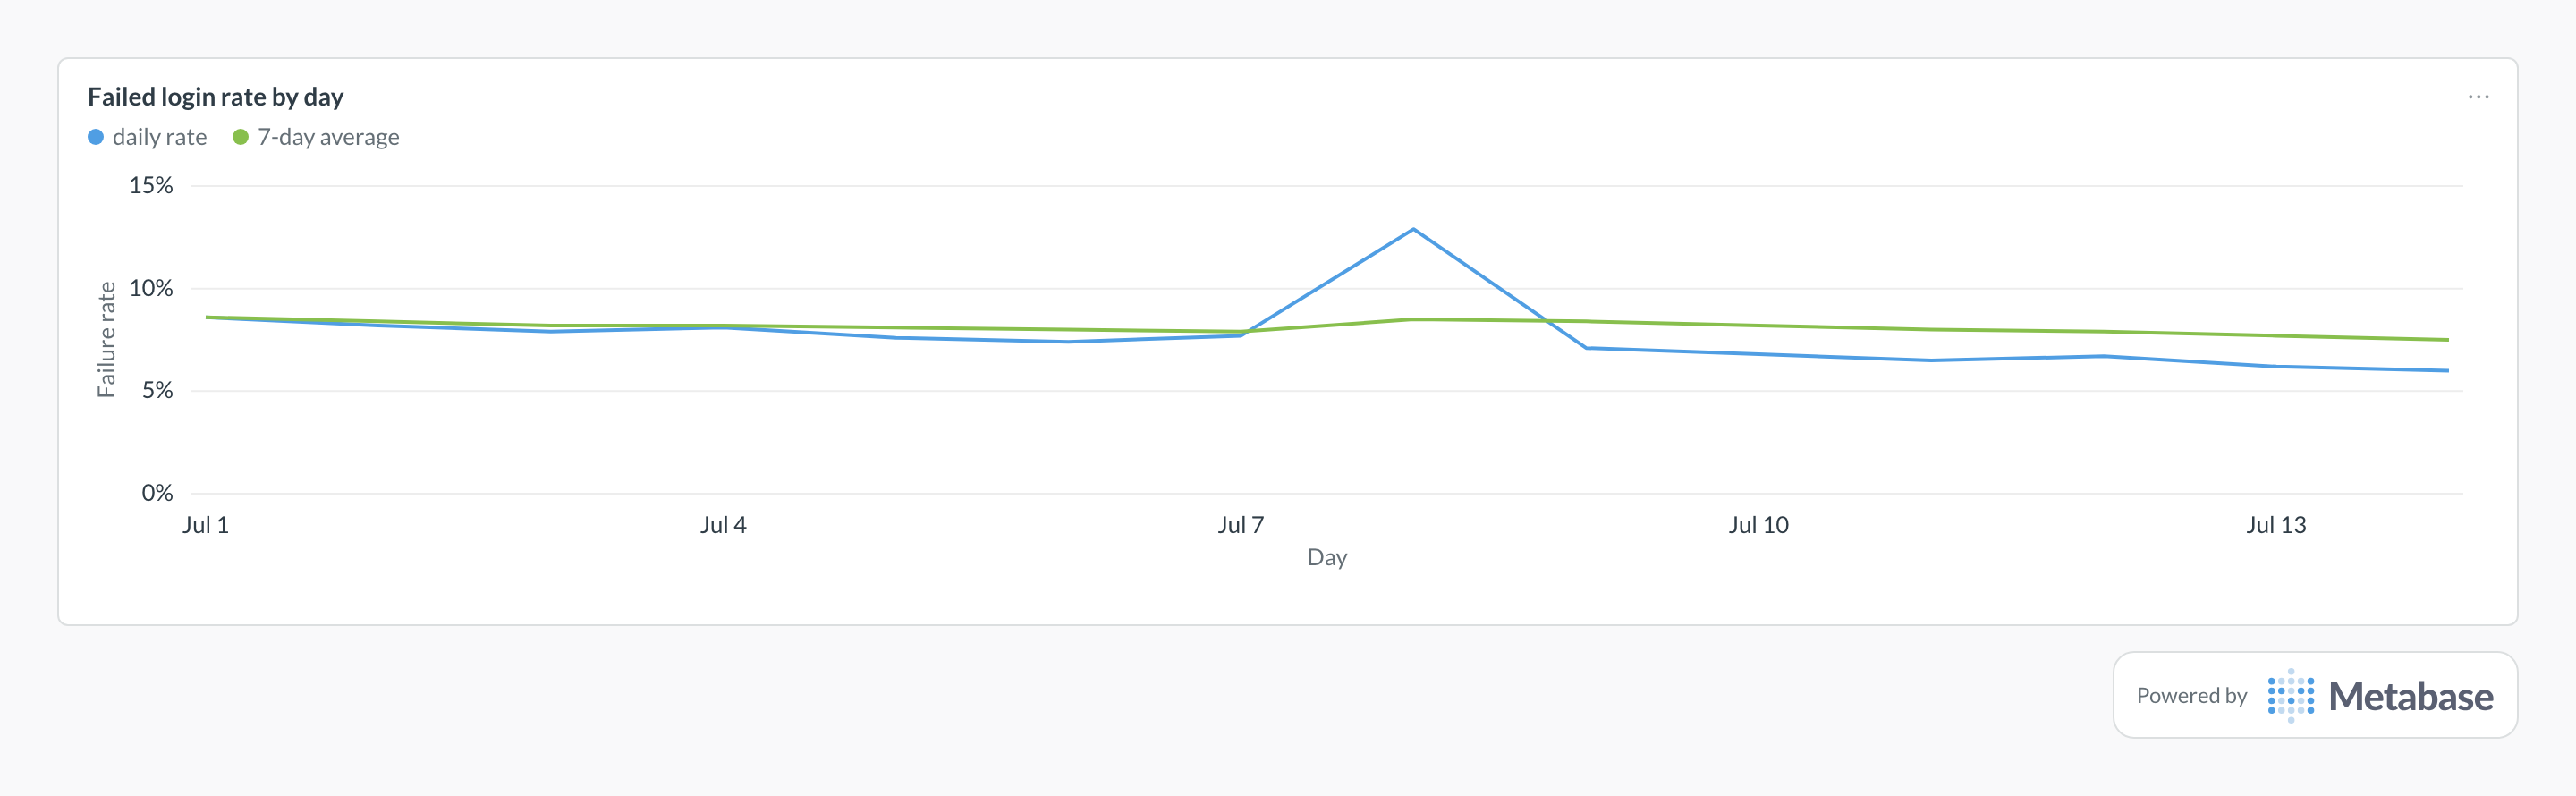
What failed login rate measures
It measures friction and hostility at the front door, in one number — which is why it always needs a second cut before it means anything. Segmented by failure reason, it separates the Monday-morning wrong-password crowd from invalid-username probes and MFA denials. Segmented by source, it exposes sprays that are invisible in the average. Deviations feed detection — a confirmed campaign becomes an input to MTTD — while sustained baseline drift usually points at a UX or policy problem instead.
What data does it need?
- A
login_eventstable:attempted_at,outcome, failure reason,app_name,username,source_ip. - Failure reason codes carried through the sync — they’re what separate user error from attack traffic.
- Source metadata (IP, and ASN or geo if available) for the spray view.
- A documented rule for what counts as an attempt: raw events or sessionized tries, applied consistently.
SQL patterns
WITH daily AS (
  SELECT
    attempted_at::date AS day,
    app_name,
    COUNT(*) AS attempts,
    COUNT(*) FILTER (WHERE outcome = 'failure') AS failures
  FROM login_events
  WHERE attempted_at >= CURRENT_DATE - INTERVAL '90 days'
  GROUP BY 1, 2
)
SELECT
  day,
  app_name,
  attempts,
  ROUND(100.0 * failures / NULLIF(attempts, 0), 2) AS failure_rate_pct,
  ROUND(
    100.0 * SUM(failures) OVER w / NULLIF(SUM(attempts) OVER w, 0), 2
  ) AS failure_rate_7d_avg
FROM daily
WINDOW w AS (
  PARTITION BY app_name
  ORDER BY day
  ROWS BETWEEN 6 PRECEDING AND CURRENT ROW
)
ORDER BY app_name, day;-- Many usernames failing from one source is a spray,
-- whatever the org-wide rate says
SELECT
source_ip,
COUNT(*) AS failed_attempts,
COUNT(DISTINCT username) AS distinct_usernames,
MIN(attempted_at) AS first_seen,
MAX(attempted_at) AS last_seen
FROM login_events
WHERE outcome = 'failure'
AND attempted_at >= now() - INTERVAL '24 hours'
GROUP BY source_ip
HAVING COUNT(DISTINCT username) >= 10
ORDER BY distinct_usernames DESC, failed_attempts DESC;Pitfalls
Where this metric applies
- Okta + Metabase — system log authentication events with outcome and reason
- Auth0 + Metabase — login events per application with failure codes
Related
Metrics
Dashboards
FAQ
How do I tell user error from attack traffic?
What failed login rate is normal?
attempts column on the chart.How does a password spray show up?
source_ip and count DISTINCT username. Ten-plus usernames from one source in a day is worth a look regardless of any rate, and confirmed sprays should feed your detection pipeline.How do you calculate failed login rate?
failures / attempts, daily and per application, with a 7-day moving average to smooth weekday cycles. Decide what counts as an attempt first — raw events, or sessionized tries where a burst of retries counts once — and apply the same rule to numerator and denominator.How do you track failed login rate in Metabase?
login_events table with outcome, failure reason, app, username, and source IP. Chart the daily per-app rate with its moving average, keep the spray-detection query — sources hitting many usernames — as a standing card, and pair it with MFA adoption rate on an identity and access analytics dashboard: one shows who's being attacked, the other who's protected.