




What goes in a Snowflake monitoring dashboard in Metabase?
A Snowflake monitoring dashboard tracks credits by warehouse, query duration percentiles, queue time, spill to local and remote storage, storage by type, and the queries responsible for the bill. Metabase connects to Snowflake natively, so every card is plain SQL over the account's own SNOWFLAKE.ACCOUNT_USAGE views — no exporter or agent in between.
For: data platform teams, analytics engineers, and whoever owns the Snowflake bill. Grain: one row per query and per warehouse-hour, rolled up daily.
Source:
SNOWFLAKE.ACCOUNT_USAGE (365-day history, 45 minutes to 3 hours behind real time).
What does a Snowflake monitoring dashboard look like?
Here’s the layout this guide builds. Account-level numbers and the month’s credit budget sit at the top; the middle section is performance — duration, queueing, warehouse load, and spill; the bottom section follows the money and the access, from credits per warehouse to the specific queries that dominate the total.
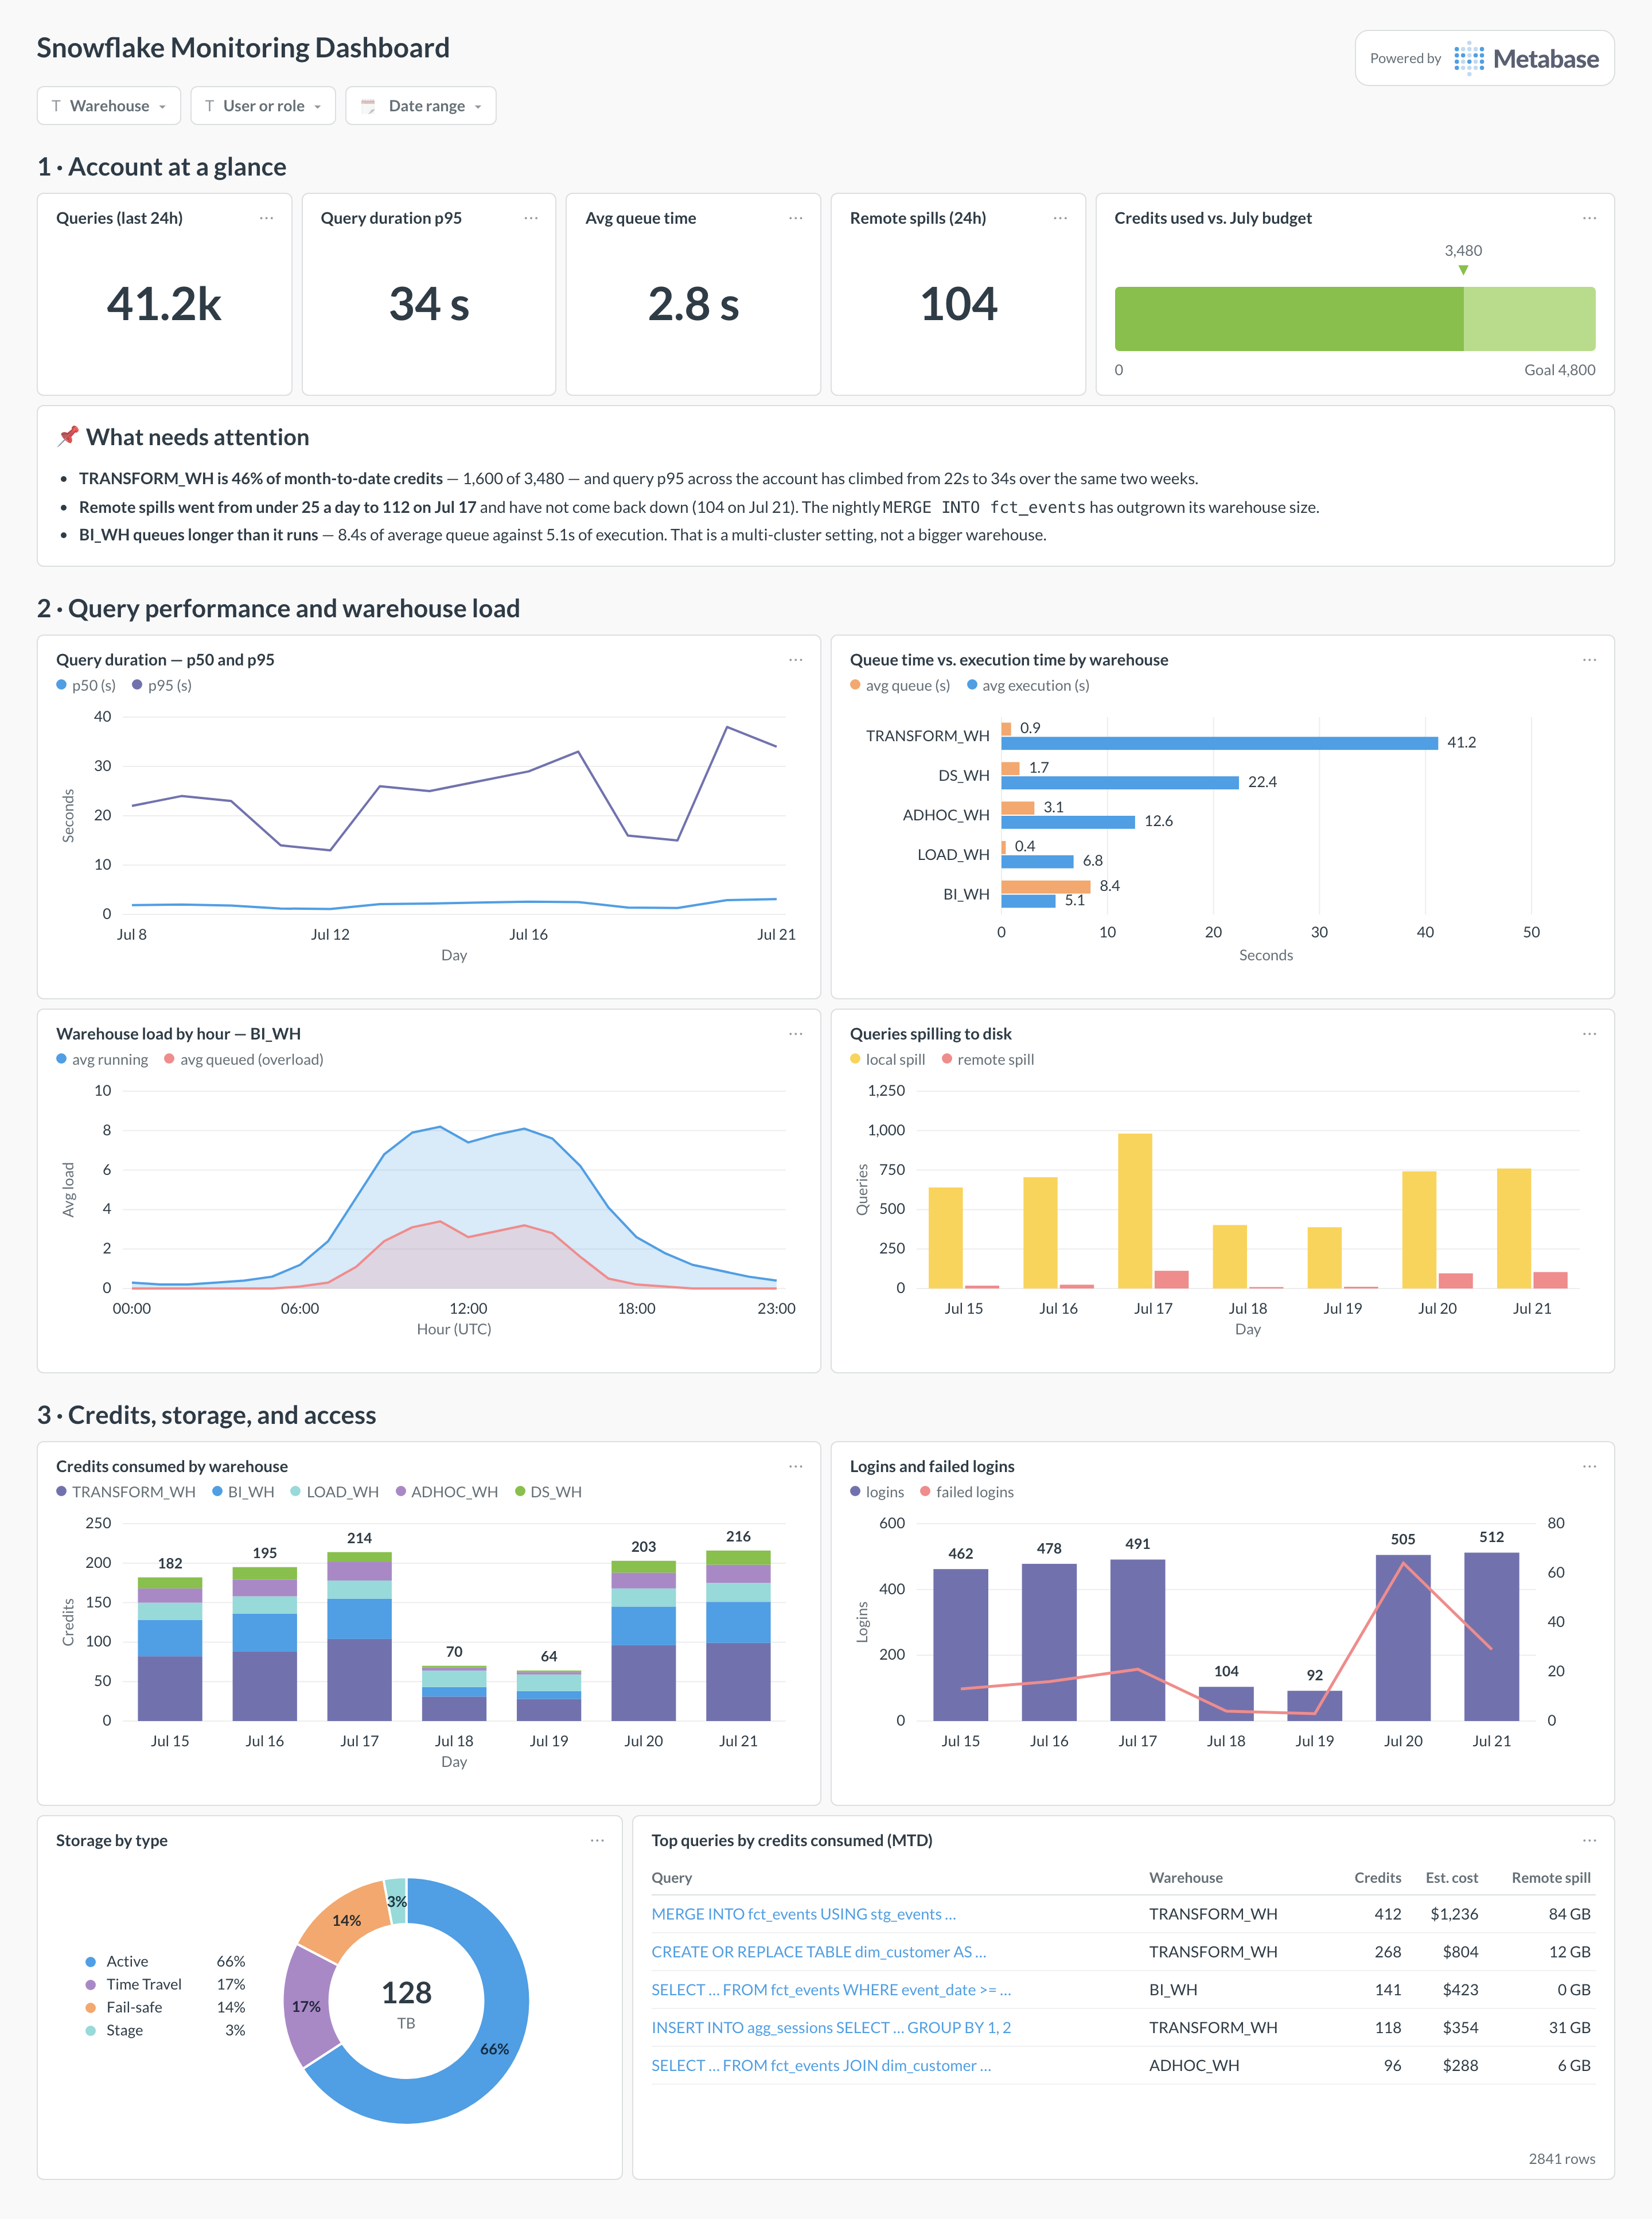
An example Snowflake monitoring dashboard in Metabase, built from SNOWFLAKE.ACCOUNT_USAGE. Figures are illustrative.
Which cards belong on a Snowflake monitoring dashboard?
Eight cards. Percentiles rather than averages for duration, queue time separated from execution time so the sizing decision is obvious, and spill split into local and remote — the difference is the difference between “busy” and “broken”.
- Query duration, p50 and p95 by day (line)
- Queue time vs. execution time by warehouse — average seconds of each (row)
- Warehouse load by hour — average running against average queued (area)
- Queries spilling to disk per day, local vs. remote (bar)
- Credits consumed by warehouse per day, compute plus cloud services (stacked bar)
- Logins and failed logins per day (combo)
- Storage by type — active, Time Travel, Fail-safe, stage (donut)
- Top queries by credits consumed, with warehouse, estimated cost, and remote spill (table)
What data does the dashboard need?
SNOWFLAKE.ACCOUNT_USAGE.QUERY_HISTORY— one row per query:total_elapsed_time,queued_overload_time,bytes_spilled_to_local_storageandbytes_spilled_to_remote_storage, warehouse, user, role,error_code, and query text.WAREHOUSE_METERING_HISTORY— hourlycredits_used_computeandcredits_used_cloud_servicesper warehouse, the basis for every cost card.STORAGE_USAGEandTABLE_STORAGE_METRICSfor active, Time Travel, Fail-safe, and stage bytes — and for the tables driving each.LOGIN_HISTORYfor logins, failures, and client type, andMETERING_DAILY_HISTORYto reconcile estimated cost against what Snowflake actually billed.INFORMATION_SCHEMA.WAREHOUSE_LOAD_HISTORY()for the running vs. queued load card — it is near real time, whereACCOUNT_USAGElags.- Your effective credit price, stored once in a model, so credits-to-dollars math never varies by card.
How do you build it?
- Connect Snowflake to Metabase with a dedicated read-only role, granted
IMPORTED PRIVILEGESon theSNOWFLAKEdatabase so it can readACCOUNT_USAGE. - Point the dashboard’s connection at a small, dedicated warehouse with a short auto-suspend — otherwise the monitoring keeps a large warehouse awake and shows up in its own credit chart.
- Model the join once: daily credits per warehouse from
WAREHOUSE_METERING_HISTORY, daily query stats fromQUERY_HISTORY, and one credit-price constant. Every card reads the model. - Build the credits and top-queries cards first — they pay for the dashboard — then queue time, spill, and warehouse load, which tell you what to change.
- Add filters for warehouse, user or role, and date range, and alert the platform channel when daily credits or remote-spilling queries cross their threshold.
Example card SQL
WITH credits AS (
SELECT
  DATE_TRUNC('day', start_time)          AS day,
  warehouse_name,
  SUM(credits_used_compute)              AS credits_compute,
  SUM(credits_used_cloud_services)       AS credits_cloud
FROM SNOWFLAKE.ACCOUNT_USAGE.WAREHOUSE_METERING_HISTORY
WHERE start_time >= DATEADD('day', -14, CURRENT_TIMESTAMP())
GROUP BY 1, 2
),
queries AS (
SELECT
  DATE_TRUNC('day', start_time)                              AS day,
  warehouse_name,
  COUNT(*)                                                   AS queries,
  ROUND(APPROX_PERCENTILE(total_elapsed_time, 0.95) / 1000, 1) AS p95_s,
  ROUND(AVG(queued_overload_time) / 1000, 2)                 AS avg_queue_s,
  COUNT_IF(bytes_spilled_to_local_storage  > 0)              AS local_spills,
  COUNT_IF(bytes_spilled_to_remote_storage > 0)              AS remote_spills
FROM SNOWFLAKE.ACCOUNT_USAGE.QUERY_HISTORY
WHERE start_time >= DATEADD('day', -14, CURRENT_TIMESTAMP())
  AND warehouse_name IS NOT NULL
GROUP BY 1, 2
)
SELECT
c.day,
c.warehouse_name,
q.queries,
q.p95_s,
q.avg_queue_s,
q.local_spills,
q.remote_spills,
ROUND(c.credits_compute + c.credits_cloud, 2)          AS credits,
ROUND((c.credits_compute + c.credits_cloud) * 3.00, 2) AS est_cost_usd
FROM credits c
LEFT JOIN queries q
ON q.day = c.day AND q.warehouse_name = c.warehouse_name
ORDER BY c.day, credits DESC;
Related
Metrics
Integrations
Dashboards
FAQ
What is a Snowflake monitoring dashboard?
SNOWFLAKE database, and Metabase connects to Snowflake natively — so every card is ordinary SQL against the account you are monitoring, with no exporter, agent, or metrics store in between.Which ACCOUNT_USAGE views should the cards read?
SNOWFLAKE.ACCOUNT_USAGE.QUERY_HISTORY is one row per query with total_elapsed_time, queued_overload_time, bytes_spilled_to_local_storage, bytes_spilled_to_remote_storage, warehouse, user, role, error code, and query text. WAREHOUSE_METERING_HISTORY gives hourly credits_used_compute and credits_used_cloud_services per warehouse — the cost cards. STORAGE_USAGE splits stored bytes into active, Time Travel, Fail-safe, and stage. LOGIN_HISTORY covers access, including failures and client type. Two gotchas: ACCOUNT_USAGE lags real time by roughly 45 minutes to three hours depending on the view, and it needs the ACCOUNTADMIN role or an explicit grant of IMPORTED PRIVILEGES on the SNOWFLAKE database.ACCOUNT_USAGE or INFORMATION_SCHEMA?
ACCOUNT_USAGE for the dashboard and INFORMATION_SCHEMA for the live view. ACCOUNT_USAGE keeps a year of history and covers the whole account, but lags by up to a few hours. The INFORMATION_SCHEMA table functions — QUERY_HISTORY(), WAREHOUSE_LOAD_HISTORY() — are near-real-time but capped at 7 to 14 days and scoped more narrowly. A practical split: trend cards read ACCOUNT_USAGE, and the one or two “what is running right now” cards read the table functions.What does queue time tell me that duration doesn't?
queued_overload_time is time a query spent waiting because the warehouse had no room, not time spent working. High queue with short execution — BI_WH in the example, 8.4s of queue against 5.1s of execution — means the warehouse is admission-limited, and the fix is a multi-cluster warehouse (raise MAX_CLUSTER_COUNT), not a bigger one. The reverse pattern, long execution and no queue, means the queries themselves are heavy: resize up, or fix the query. Sizing up a queueing warehouse doubles the credit rate and barely moves the wait.Why does spill to remote storage matter so much?
bytes_spilled_to_local_storage) and then to remote object storage (bytes_spilled_to_remote_storage). Remote spill is orders of magnitude slower, and a query that starts remote-spilling has usually crossed a data-volume threshold rather than changed. In the example, remote spills jump from under 25 a day to 112 and stay there — one nightly MERGE outgrew its warehouse. Chart the count of spilling queries per day, and alert on remote spill specifically; local spill on a busy warehouse is normal.How do I turn credits into dollars on the dashboard?
ACCOUNT_USAGE.METERING_DAILY_HISTORY and the actual invoice. Storage is billed separately, per TB-month, and Time Travel plus Fail-safe are often a third of the bill — which is why the storage-by-type card is worth its space. For the cross-vendor picture, pair this with a cloud spend overview and let cost anomalies do the alerting.