




What is queue time, and how do you measure it in Metabase?
Queue time is how long work waits before anyone acts on it — a ticket sitting in "Ready for review," a build waiting for a free runner. It is usually the dominant share of lead time: items spend far longer waiting between steps than being worked on, which makes queues the highest-leverage place to look when delivery feels slow. Measure it in Metabase from status history synced from Jira or Linear, and from CI job records from Buildkite or GitHub Actions.
What does a queue time chart look like in Metabase?
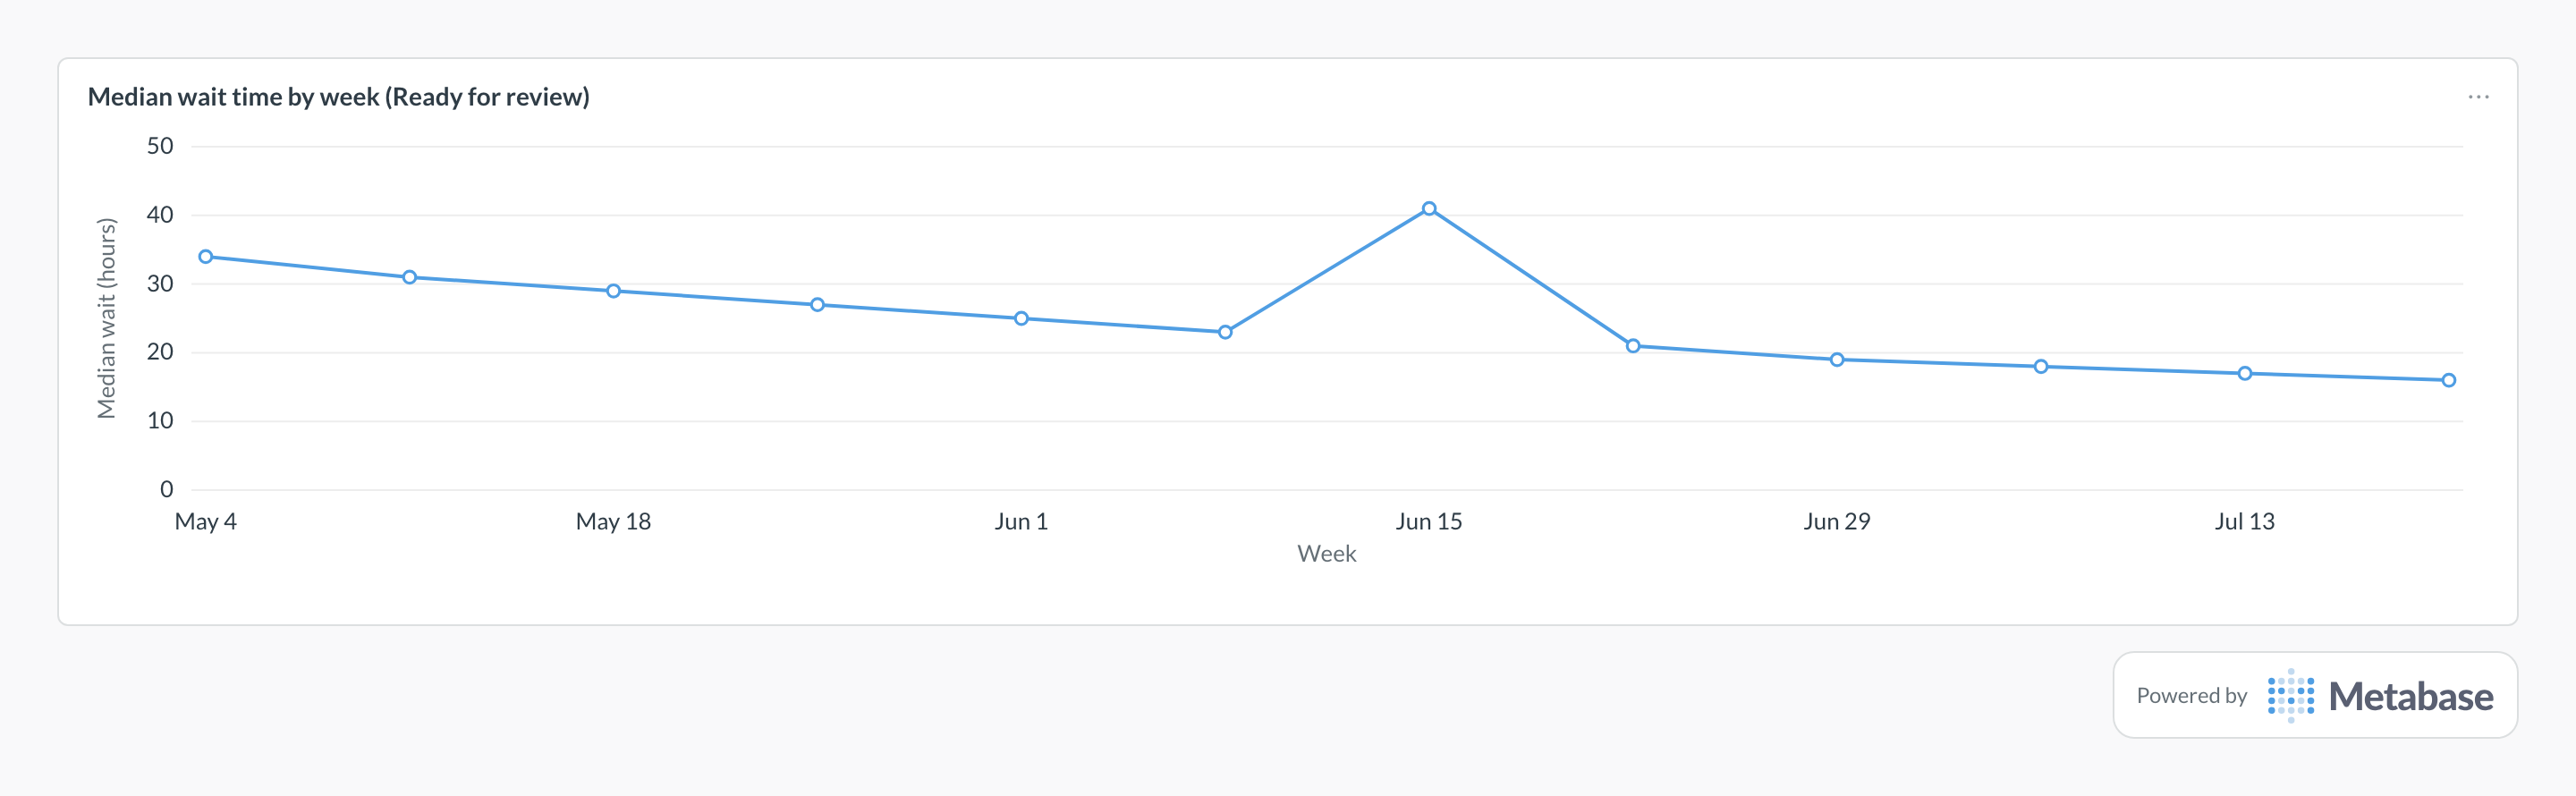
Trend the median hours items sit in one wait state per week as a line — medians, because a few items that wait for weeks would drown the typical case in an average. The steady decline is what draining a queue looks like, while a spike like Jun 15's usually means capacity vanished for a week — reviewers pulled onto an incident — rather than more work arriving.
What does queue time measure?
It measures the invisible part of delivery. Teams optimize the visible part — coding faster, reviewing faster — but an item's clock runs the whole time, and most of it runs in queues. Two kinds matter for engineering teams:
- Workflow wait states — "Ready for review," "Ready for QA," "Blocked," "Ready to deploy." Each is a handoff where the item waits for a person. Per-state medians show exactly which handoff is the bottleneck, which is more actionable than any aggregate cycle time number.
- CI job queue time — the gap between a job being triggered and a runner picking it up. It's invisible inside wall-clock pipeline duration, but it has a different fix: capacity, not faster tests. Rising queue time on one runner pool at predictable hours is a sizing problem, not a code problem.
The summary statistic is flow efficiency: active time divided by total elapsed time. When it's low — and it usually is — adding developers or working faster barely moves delivery, because the constraint is the waiting. Draining the worst queue raises throughput without anyone working harder.
What data does it need?
-
A
status_transitionstable:issue_id,state,entered_at,exited_at, and astate_categorytag marking which states are wait states. - History, not current state. This comes from Jira's
issue_changelogor Linear's issue history. A plain current-state sync overwrites transitions and cannot reconstruct waiting — if the history isn't in the sync, the metric isn't measurable. -
For CI queues: a
ci_jobstable withtriggered_at,started_at, andrunner_pool— Buildkite and GitHub Actions both expose the timestamps needed to derive the wait.
SQL patterns
SELECT
  state,
  COUNT(*) AS visits,
  percentile_cont(0.5) WITHIN GROUP (
    ORDER BY EXTRACT(EPOCH FROM (exited_at - entered_at)) / 3600.0
  ) AS median_wait_hours,
  percentile_cont(0.9) WITHIN GROUP (
    ORDER BY EXTRACT(EPOCH FROM (exited_at - entered_at)) / 3600.0
  ) AS p90_wait_hours
FROM status_transitions
WHERE state_category = 'waiting'
  AND exited_at >= CURRENT_DATE - INTERVAL '90 days'
GROUP BY state
ORDER BY median_wait_hours DESC;SELECT
runner_pool,
date_trunc('day', triggered_at) AS day,
COUNT(*) AS jobs,
percentile_cont(0.5) WITHIN GROUP (
ORDER BY EXTRACT(EPOCH FROM (started_at - triggered_at))
) AS median_queue_seconds,
percentile_cont(0.9) WITHIN GROUP (
ORDER BY EXTRACT(EPOCH FROM (started_at - triggered_at))
) AS p90_queue_seconds
FROM ci_jobs
WHERE started_at IS NOT NULL
AND triggered_at >= CURRENT_DATE - INTERVAL '30 days'
GROUP BY 1, 2
ORDER BY 1, 2;Pitfalls
Where this metric applies
- Jira + Metabase — wait states derived from the issue changelog
- Linear + Metabase — per-state durations from issue history
- Buildkite + Metabase — job wait times per queue and agent pool
- GitHub Actions + Metabase — job queue delay per runner group
Related
Metrics
Dashboards
FAQ
How is queue time different from cycle time and lead time?
What is flow efficiency?
Can I measure queue time without status history?
issue_changelog, Linear's issue history, or an equivalent transitions table in the sync. If your pipeline doesn't capture it, fix the pipeline first; there is no SQL workaround for data that was never stored.Why medians and percentiles instead of averages?
How do you track queue time in Metabase?
status_transitions table with entered and exited timestamps per state, and tag which states are wait states. For CI, sync job records from Buildkite or GitHub Actions and compute started_at − triggered_at per runner pool. Chart medians and p90s, and pin the per-state breakdown to a queue time dashboard.