Learn about Queue Time, including how to measure it, and leverage it in dashboards and visualizations with Metabase.
Queue time is a measurement relevant to customer service that gives you the average time customer service representatives take to address a customer ticket. Visualizing your queue time can help your customer service teams identify pain areas and create a plan for improvements. It can also be an indication of low staffing, an increase in technical problems, and a variety of other things that could be creating problems for your customer service teams. Your customer satisfaction levels rely on your queue times to be reasonable, and your customer service success relies on your ability to set realistic expectations.
Get Started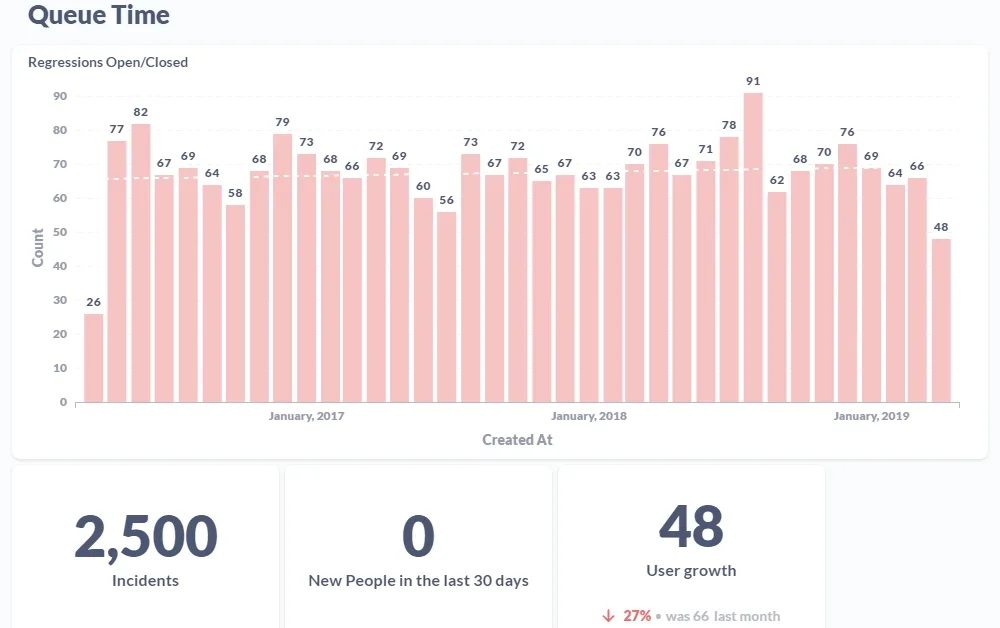
Each method of customer service communication should be segmented into different parts. Your team’s email responses will likely be different than their phone response times. If you average everything together, you get an inaccurate view of how your overall queue times are working. For example, it might take 3-4 hours to get an email response out to begin working on a problem, but it could only take 15 minutes to get through via phone. In order to look at each individual communication method’s queue time, you’ll need to calculate the average of all the wait times for a given time period. Let’s say you want to calculate your queue time for one month. For the specified communication method, add up all of the wait times in minutes. Then, you’ll do this calculation: Total number of minutes / Total number of calls = Queue time
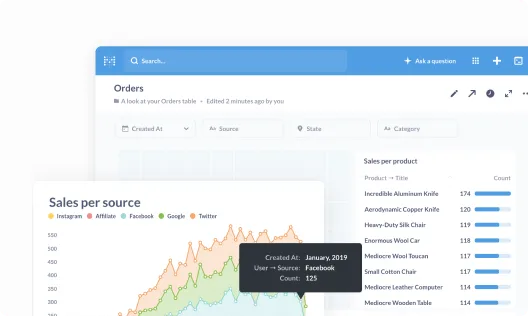
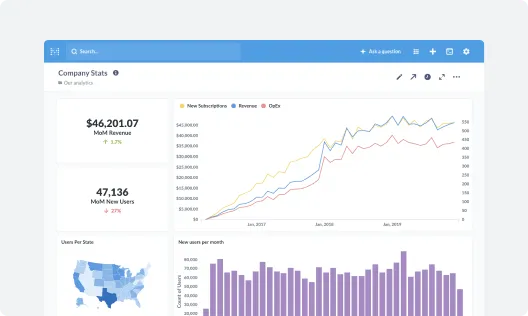
Get everyone on the same page by collecting your most important metrics into a single view.
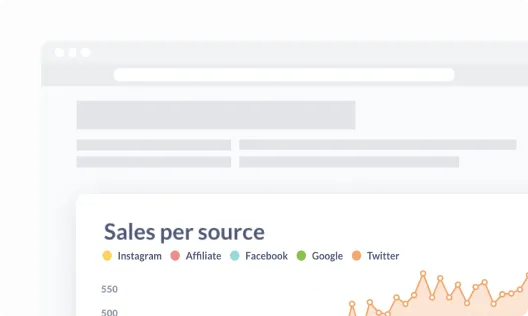
Take your data wherever it needs to go by embedding it in your internal wikis, websites, and content.
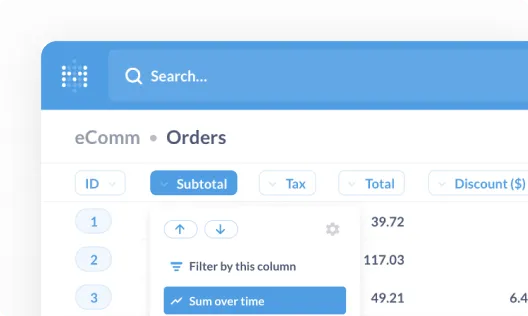
Empower your team to measure their own progress and explore new paths to achieve their goals.

That's right, no sales calls necessary—just sign up, and get running in under 5 minutes.

We connect to the most popular production databases and data warehouses.
Invite your team and start building dashboards—no SQL required.


