





What is resource utilization, and how do you measure it in Metabase?
Resource utilization is used capacity divided by requested or provisioned capacity — how much of the CPU, memory, or nodes you pay for actually does work. It's the bridge between reliability and cost: too high means no headroom for spikes, too low means money spent on idle capacity. Measure it in Metabase from daily snapshots synced from Kubernetes, Amazon ECS, Amazon EKS, or GKE.
used ÷ requested per workload per day, from
snapshots (not raw metrics streams). Judge against explicit capacity targets —
utilization is a trade-off dial, not a score to maximize.
What does a resource utilization chart look like in Metabase?
Rank workloads by average used ÷ requested and read both tails: batch-etl near 90% CPU is healthy for batch work, while checkout-api idling at 22% is paid-for headroom nobody uses. Watch for pairs that disagree, too — search's low CPU next to 78% memory means the workload is memory-bound, so right-sizing it is about the request mix, not just shrinking everything.
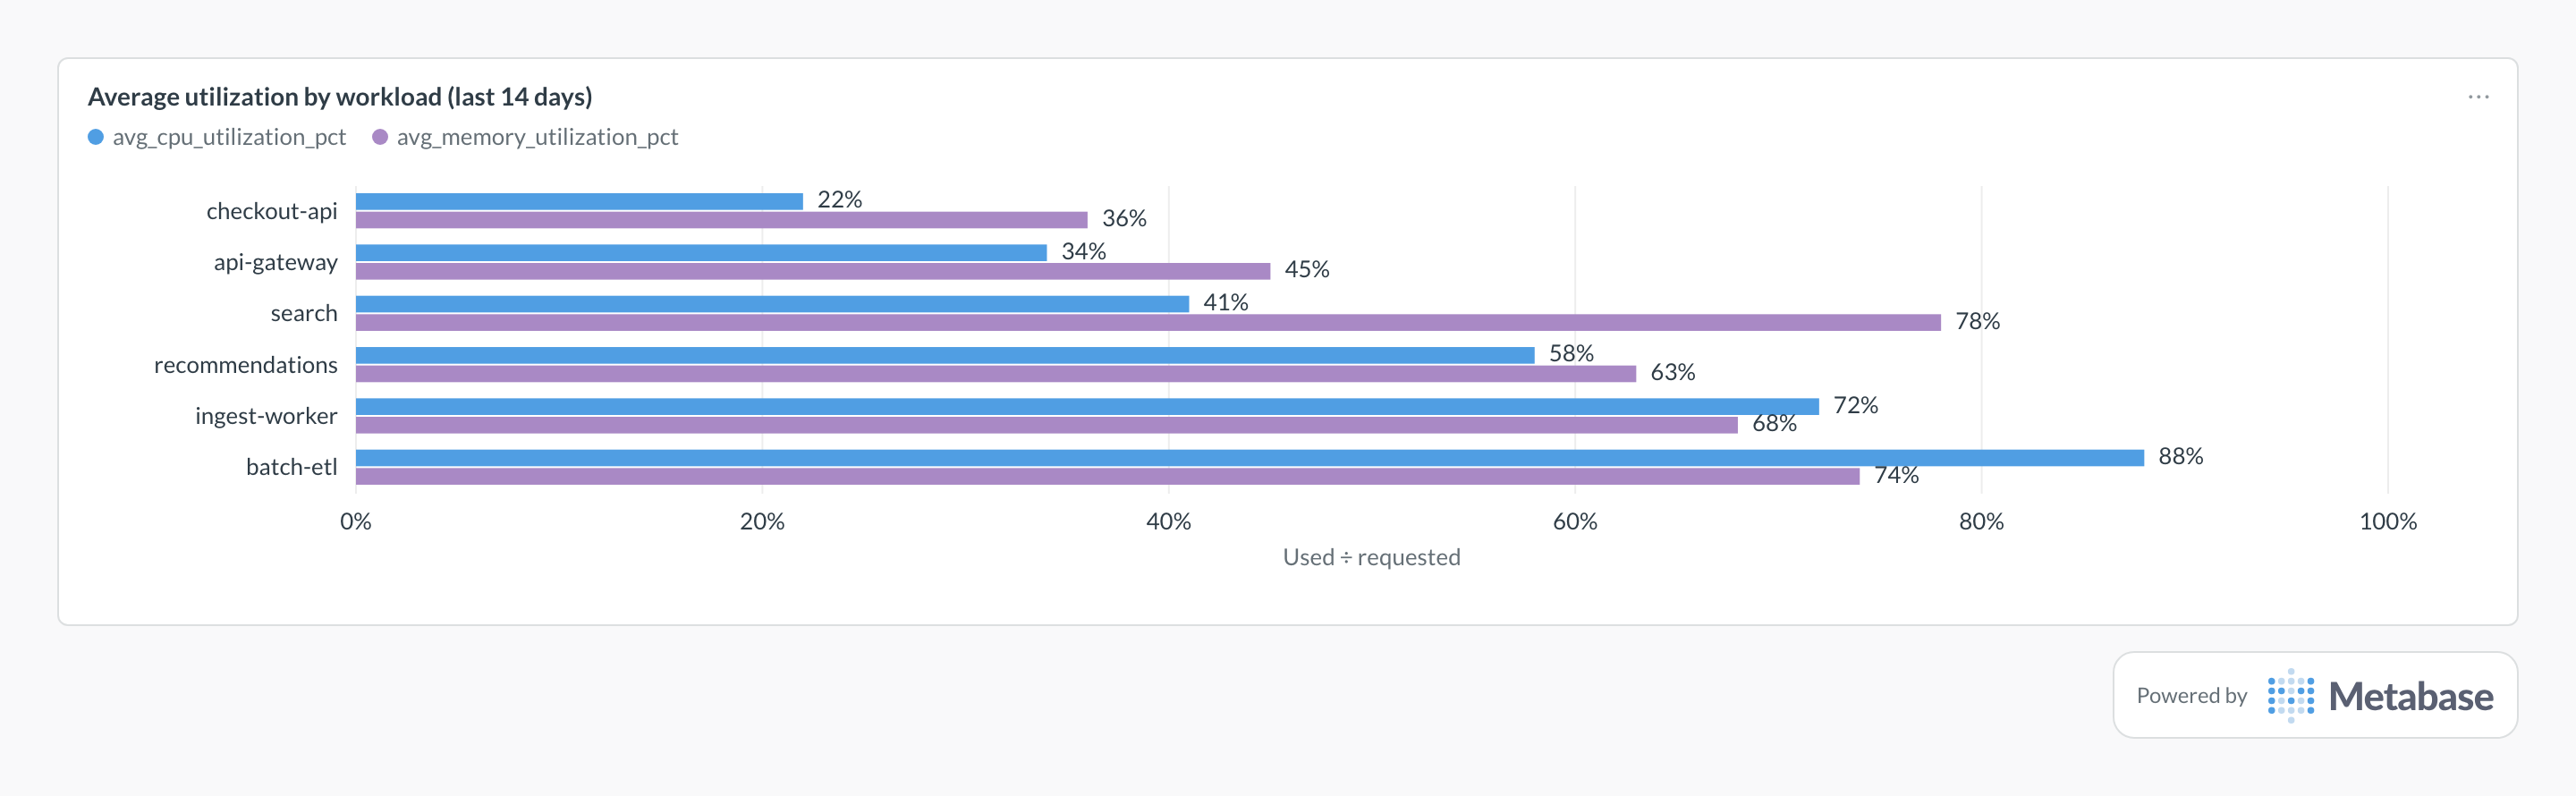
What resource utilization measures
It measures the gap between what workloads claim and what they use. The used-vs-requested view finds over-provisioned deployments (right-sizing candidates); requested-vs-allocatable finds stranded node capacity. Joined with cost allocations, it ranks the gaps by dollars — which is what turns a chart into a backlog.
What data does it need?
-
resource_snapshots: workload, cluster/namespace, snapshot date, requested and used CPU/memory. -
Optional
cost_allocationsper service/namespace per day to price the waste. - Source: kube-state-metrics + Prometheus, CloudWatch Container Insights, or the Cloud Monitoring API — exported as daily aggregates.
SQL patterns
SELECT
  workload_name,
  namespace,
  ROUND(AVG(cpu_used_cores / NULLIF(cpu_requested_cores, 0)) * 100, 1)
    AS avg_cpu_utilization_pct,
  ROUND(AVG(memory_used_bytes / NULLIF(memory_requested_bytes, 0)) * 100, 1)
    AS avg_memory_utilization_pct
FROM resource_snapshots
WHERE snapshot_date >= CURRENT_DATE - INTERVAL '14 days'
GROUP BY workload_name, namespace
ORDER BY avg_cpu_utilization_pct ASC;SELECT
s.namespace,
ROUND(AVG(s.cpu_used_cores / NULLIF(s.cpu_requested_cores, 0)) * 100, 1)
AS avg_cpu_utilization_pct,
ROUND(SUM(c.cost_usd), 2) AS cost_usd_30d
FROM resource_snapshots s
JOIN cost_allocations c
ON c.namespace = s.namespace
AND c.usage_date = s.snapshot_date
WHERE s.snapshot_date >= CURRENT_DATE - INTERVAL '30 days'
GROUP BY s.namespace
ORDER BY cost_usd_30d DESC;Pitfalls
Where this metric applies
- Kubernetes + Metabase — requests vs. usage from kube-state-metrics
- Amazon ECS + Metabase — service utilization from Container Insights
- Amazon EKS + Metabase — pod and node utilization
- GKE + Metabase — utilization joined to billing-export costs
Related
Metrics
Dashboards
FAQ
What's a healthy utilization target?
Why snapshots instead of live metrics?
resource_snapshots with requested and used CPU and memory — are cheap to store, fast to query, and enough to rank the gaps. The raw streams stay in Prometheus or CloudWatch where they belong; Metabase gets the rollups, the same pattern every observability integration uses. Keep peak or p95 in the snapshot alongside the average so bursty workloads don't look idle.How do I put a dollar figure on low utilization?
resource_snapshots to cost_allocations per namespace or service per day — AWS CUR with split cost allocation for EKS, GCP billing export with cost allocation for GKE, or OpenCost on any Kubernetes cluster. Ranking namespaces by spend next to their average utilization turns "we're over-provisioned" into a prioritized list; the infrastructure cost dashboard shows the pattern.How do you calculate resource utilization?
cpu_used_cores ÷ cpu_requested_cores per workload per day, and the same for memory. Name the denominator on every card — used over requested finds greedy resource requests, requested over allocatable finds stranded node capacity, and the two point at different fixes. Compute it from daily snapshots built on kube-state-metrics plus Prometheus, CloudWatch Container Insights for ECS, or the Cloud Monitoring API for GKE.How do you track resource utilization in Metabase?
resource_snapshots — workload, namespace, requested and used CPU and memory — from Kubernetes, Amazon EKS, or GKE into a SQL database. Chart average and peak utilization per workload, sort ascending to surface right-sizing candidates, and join cost allocations to rank the gaps by dollars on an infrastructure cost dashboard.