





What does an infrastructure cost dashboard show in Metabase?
An infrastructure cost and utilization dashboard shows where capacity and spend concentrate, and where they're wasted — utilization against requests, cost by service, and the idle resources nobody remembers. It combines snapshots and billing data from platforms such as Kubernetes, Amazon ECS, Amazon EKS, and GKE.
For: Platform engineers, engineering leadership, and finance partners. Grain: one row per workload per day (snapshots), plus cost allocations per service per day.
What does an infrastructure cost dashboard look like?
Here’s the layout this guide builds, at the grain of one workload per day: total spend against budget at the top, then where the money goes by namespace and workload alongside utilization, then the waste, idle-resource and biggest-mover tables. Read it monthly with finance, and before any capacity decision.
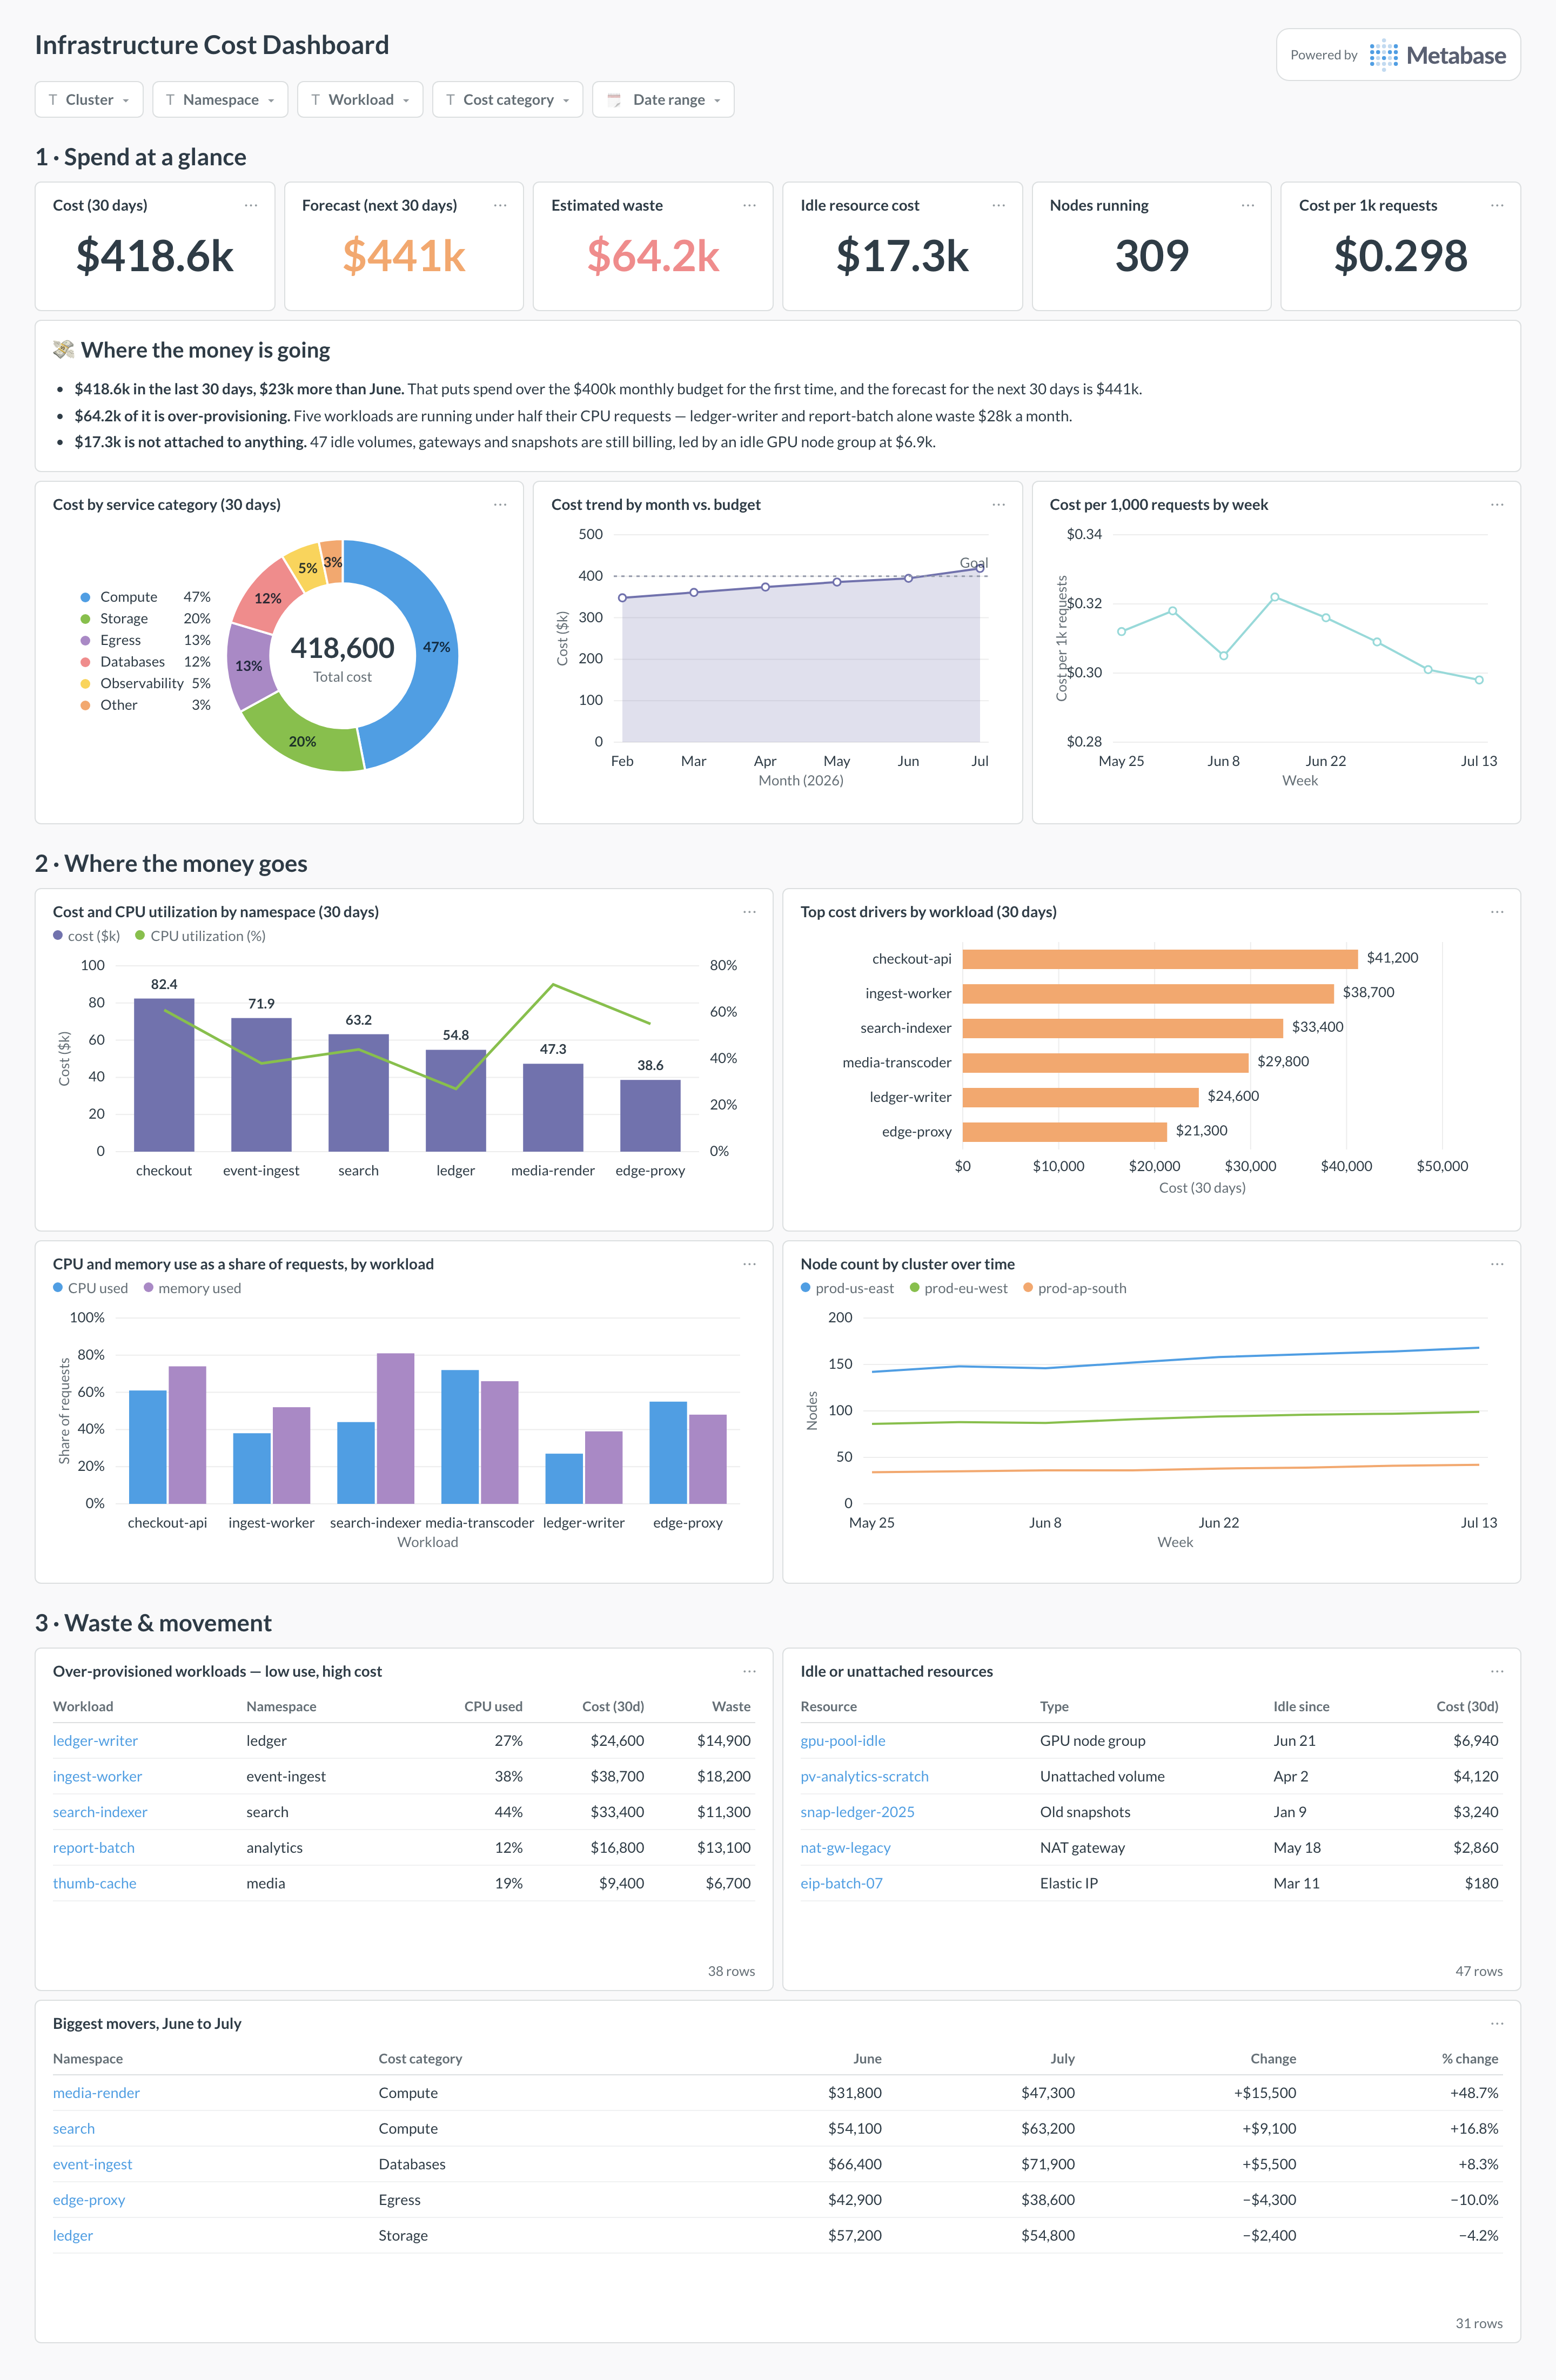
An example infrastructure cost dashboard in Metabase, built from Kubernetes and GKE usage and billing data. Figures are illustrative.
Which cards belong on an infrastructure cost dashboard?
- CPU and memory utilization vs. requests by workload (bar)
- Cost by service or namespace, trailing 30 days (bar)
- Cost trend by month with forecast (line)
- Over-provisioned workloads — low use, high cost (table)
- Idle or unattached resources (table)
- Node or instance count by cluster over time (line)
- Cost per request or per tenant where the join exists (line)
What data does the dashboard need?
resource_snapshots— daily requested vs. used CPU and memory per workload, cluster, and namespace.cost_allocations— spend by service, namespace, or cluster per day, from your cloud billing export (AWS CUR, GCP Billing → BigQuery) or cost tooling.serviceswith owners and teams, so cost lands on a roadmap, not a shrug.
How do you build it?
- Land daily snapshots from kube-state-metrics/Prometheus or the platform APIs (see the Kubernetes guide for routes).
- Enable cost allocation at the source — GKE cost allocation, AWS split cost allocation, or a tool like OpenCost — and export it daily.
- Join usage and cost on service and day; normalize service names across platforms first.
- Build the over-provisioned table first — it’s where the money is — then trends and per-team views.
Example card SQL
SELECT
s.workload_name,
ROUND(AVG(s.cpu_used_cores / NULLIF(s.cpu_requested_cores, 0)) * 100, 1)
  AS avg_cpu_utilization_pct,
ROUND(SUM(c.cost_usd), 2) AS cost_usd_30d
FROM resource_snapshots s
LEFT JOIN cost_allocations c
ON c.service_name = s.workload_name
AND c.usage_date = s.snapshot_date
WHERE s.snapshot_date >= CURRENT_DATE - INTERVAL '30 days'
GROUP BY s.workload_name
HAVING AVG(s.cpu_used_cores / NULLIF(s.cpu_requested_cores, 0)) < 0.3
ORDER BY cost_usd_30d DESC;
Related
Metrics
Integrations
Dashboards
FAQ
What is an infrastructure cost dashboard?
What data sources feed an infrastructure cost dashboard?
resource_snapshots — requested vs. used CPU and memory per workload — from kube-state-metrics via Prometheus or the platform APIs of Kubernetes, Amazon ECS, and GKE. Spend comes as cost_allocations from the billing export — AWS CUR, GCP Billing to BigQuery — or tooling like OpenCost. Normalizing service names across the two feeds is most of the work.Is high utilization good or bad?
Where does the cost data come from?
cost_allocations table keyed by service or namespace — shared, untagged spend needs an explicit allocation rule, or it quietly distorts every per-team number.How often should infrastructure cost be reviewed?
resource_snapshots and cost_allocations tables.